Bitcoin (BTC) heads into the first week of September on a rocky road downhill after United States markets’ Jackson Hole rout.
After the U.S. Federal Reserve reinforced hawkish comments on the inflation outlook, risk assets sold off across the board, and crypto is still reeling from the aftermath.
A fairly nonvolatile weekend did little to improve the mood, and BTC price action has returned to focus on areas below $20,000.
In so doing, multiple weeks of upside have effectively disappeared, and in turn, traders and analysts expect a retest of the macro lows seen in June this year.
While all is now quiet regarding the Fed until the September rate hike decision, there is still plenty of room for upset as geopolitical uncertainty and inflation persist, the latter still increasing in Europe.
However, as last week, Bitcoin appears fundamentally resilient as a network, with on-chain data telling a different story to price charts.
Cointelegraph takes a look at five factors to consider when wondering where BTC/USD may head in the coming days.
Spot price triggers $18,000 target
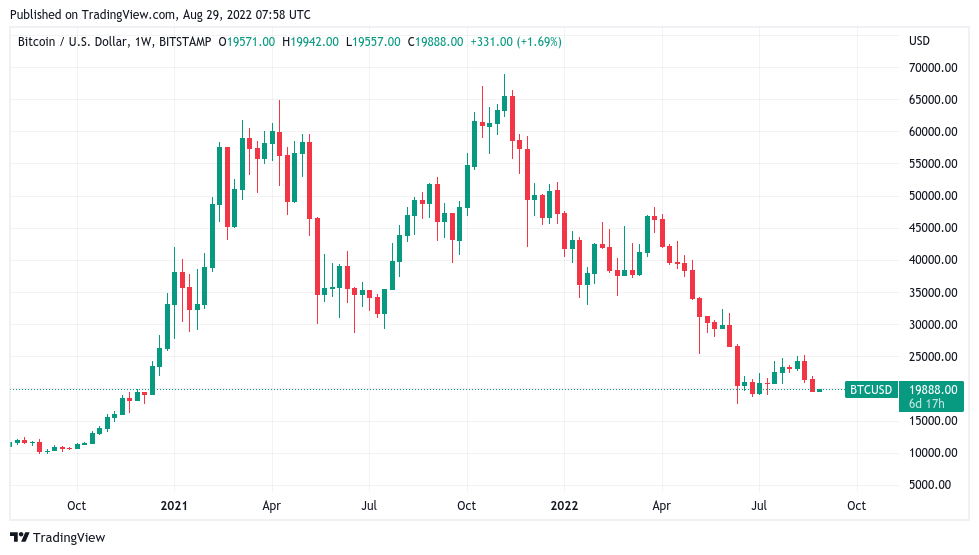
Data from Cointelegraph Markets Pro and TradingView confirms no surprises for guessing what happened to BTC/USD into the latest weekly close.
After a comparatively uneventful weekend trading period, the pair sold off considerably at the end of Aug. 28, resulting in the lowest weekly close since early July.
A $2,000 red weekly candle thus sealed a miserable August for bulls, this following an initial $3,000 of losses the week prior.
With days until the monthly candle completes, the mood among analysts was understandably less than optimistic in the short term.
“Hoping we can see a recovery this week but the way equities closed Friday doesn't look so hot,” trader Josh Rager summarized to Twitter followers in part of a weekend update.
Popular trading account Il Capo of Crypto nonetheless eyed the possibility for a brief squeeze to the upside before continuation of the downtrend.
Noting negative funding rates implying derivatives market bias towards straight losses, he predicted that $23,000 could reappear first.
“Much more people expecting 19k than those expecting 23k. Funding says it all. Also, there's a lot of juicy liquidity above 21k. Squeeze those shorts,” he tweeted.
Responding, trader Mark Cullen noted that traders were “adding more BTC shorts in the area between 20.1 and 20.3k.”
“There is a nice inefficiency above there and another at around 20.9-21.1k. If it can break up it's likely to be a fast move higher,” he added.
Amid various calls for $17,000 or lower, technical analyst Gert van Lagen gave a $17,500 floor target for the daily chart.
$BTC[1D]
— Gert van Lagen (@GertvanLagen) August 28, 2022
White C-wave scenario I showed last Monday played out like clockwork. Double test of green box on daily.
C-wave looks final, time to bounce
Invalidation: 17.5k#BullMarket #Bitcoin https://t.co/acs6bFEl66 pic.twitter.com/DkhXmp3GDc
In a slightly less cautious outlook, TMV Crypto meanwhile flagged $18,400 as a high-timeframe area of interest.
Traders prepare for further U.S. stocks declines
Last week’s bombshell of a speech by Fed Chair Jerome Powell sent shockwaves through risk assets worldwide.
According to one tally, Powell’s eight-minute address wiped over $2 trillion from global stocks, including $1.25 trillion in the U.S. alone.
#Fed's Powell has destroyed ~$2tn in global stock market cap with his 8-minute “Until the Job Is Done” Jackson Hole speech, makes $4.2bn loss per second. pic.twitter.com/05YE5yG693
— Holger Zschaepitz (@Schuldensuehner) August 28, 2022
“At some point, as the stance of monetary policy tightens further, it likely will become appropriate to slow the pace of increases,” Powell said.
“Restoring price stability will likely require maintaining a restrictive policy stance for some time. The historical record cautions strongly against prematurely loosening policy.”
Bitcoin and altcoins alike felt the squeeze, with Aug. 29 set to be something of a make or break Wall Street trading session.
Speaking on Bloomberg Television, Paul Christopher, head of global market strategy at Wells Fargo Investment Institute, warned that U.S. stocks would fall further, with the S&P 500 due for a trip below 4,000 next.
On the flipside, crypto-focused Game of Trades argued that peak inflation from July had already signaled a macro low in stocks.
Once again the peak in inflation has called the bottom is stocks for now.
— Game of Trades (@GameofTrades_) August 28, 2022
Let’s watch to see if this continues to play out. pic.twitter.com/HE2KfrjMVL
Flagging cumulative data for the S&P, Game of Trades continued to argue that all was in fact not as bad as it seemed.
“SP500 is showing A LOT of underlying strength,” accompanying comments from the weekend read.
“The cumulative advance/decline line speaks to the underlying strength in the market, which many investors are failing to notice. Despite the SP500 being double digits away from the ATH, the indicator has entered new highs.”
Even a drop to 3,900, another insight stated, would preserve a “bullish formation.”
U.S. dollar targets September 2002 levels
A key accompaniment to upheaval in equities remains the strength of the U.S. dollar this week.
A classic inversely correlated relationship, dollar performance versus risk assets is in the spotlight thanks to the U.S. dollar index (DXY) making new twenty-year highs this week.
At the time of writing on Aug. 29, those highs are still playing out, DXY having hit 109.47 in its highest spike since September 2002.
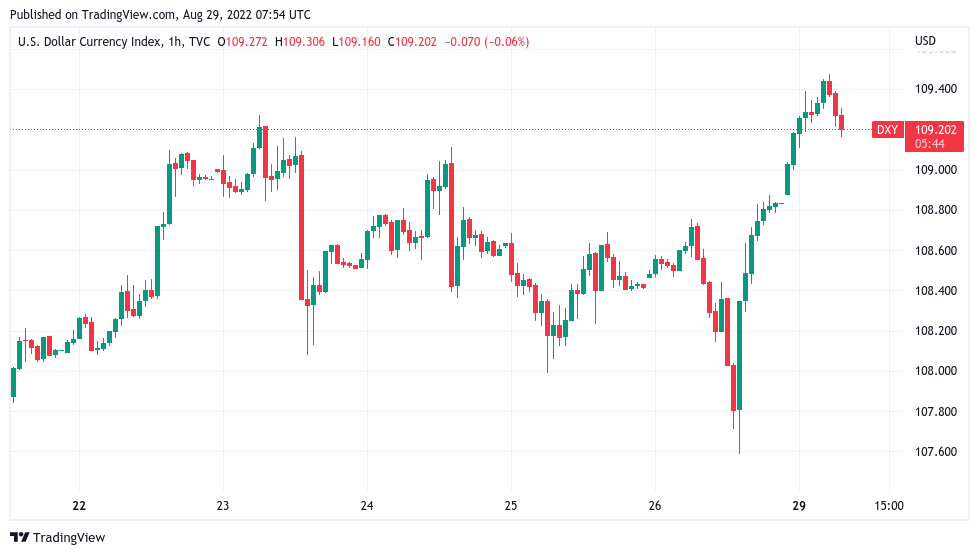
“If the dollar keeps going, it's going to really break things. It has literally done parabolic,” Raoul Pal, founder of Global Macro Investor, responded, warning that there was “literally nothing until 120” in terms of resistance on the DXY chart.
Cointelegraph contributor Michaël van de Poppe was equally alarmed, including DXY as a factor creating a “moment of truth for the entire crypto market.”
Moment of truth coming up for the entire #crypto market.
— Michaël van de Poppe (@CryptoMichNL) August 29, 2022
Facing another test of the 200-Week MA, which ultimately could lead to a HL and retest.
Sentiment is on an ultimate low.$DXY needs to reverse or top out soon, though. pic.twitter.com/qlvutKi9QG
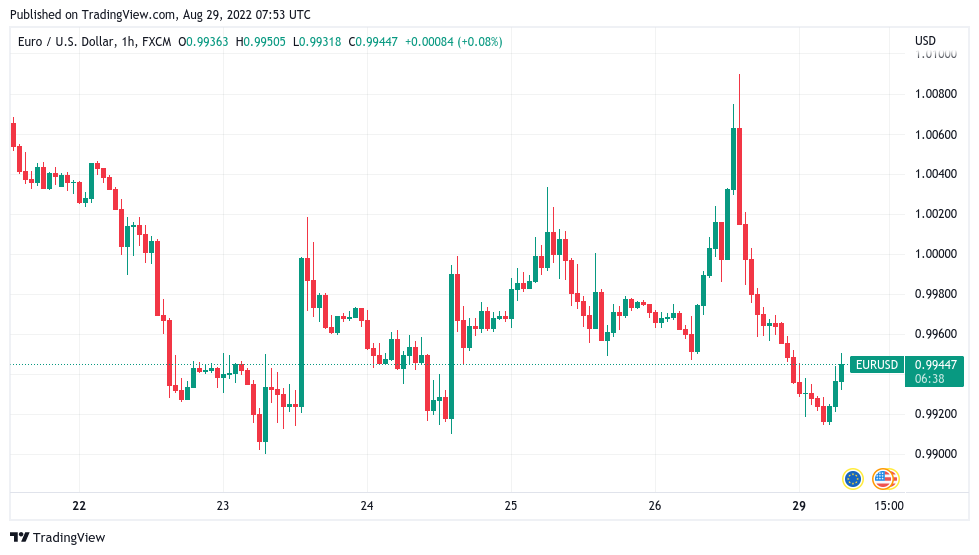
The dollar’s surge likewise spelled pain for major fiat currencies, notably the euro, which swiftly headed back below parity with the greenback into Aug. 29.
The European Central Bank, along with the Bank of Japan, has been reluctant to instigate the same bill of rate hikes as the Fed, leading to inflation continuing to climb over the summer.
MVRV-Z score retreats into the green
Heading back into its “buy” zone is a classic Bitcoin strength indicator which has caught macro bottoms throughout Bitcoin’s lifespan.
The MVRV-Z score indicator, which began to prepare analysts for a price bottom in July, is now falling again, hitting its lowest in a month.
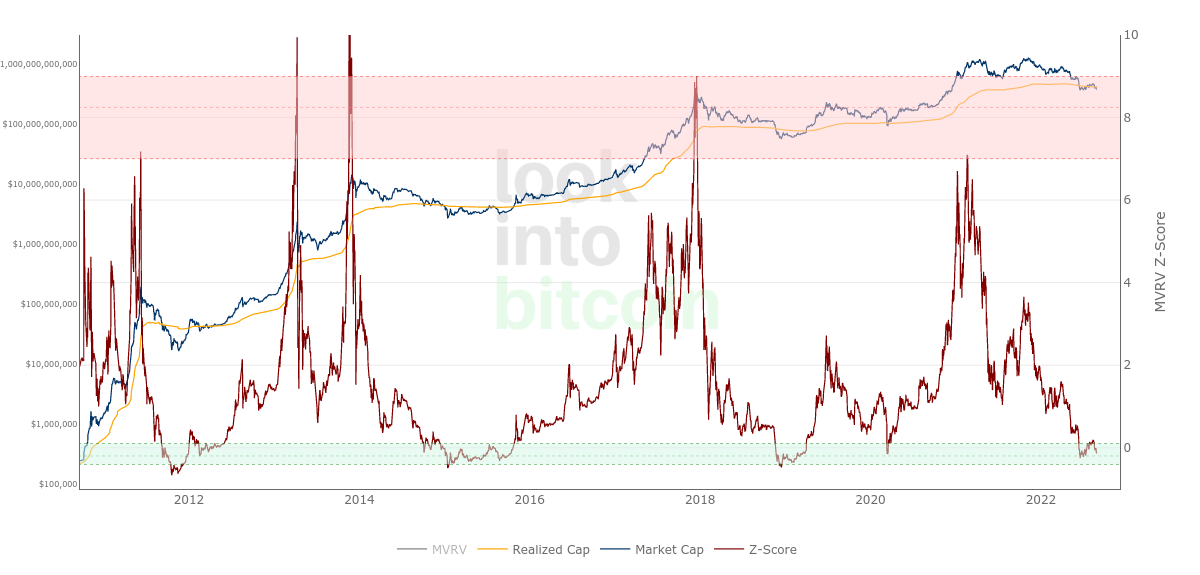
MVRV-Z uses market cap and realized price to determine how close BTC/USD is to its “fair value.”
In July, it printed a potential BTC price floor of $15,600, while briefly exiting its buy zone before returning during the second half of August.
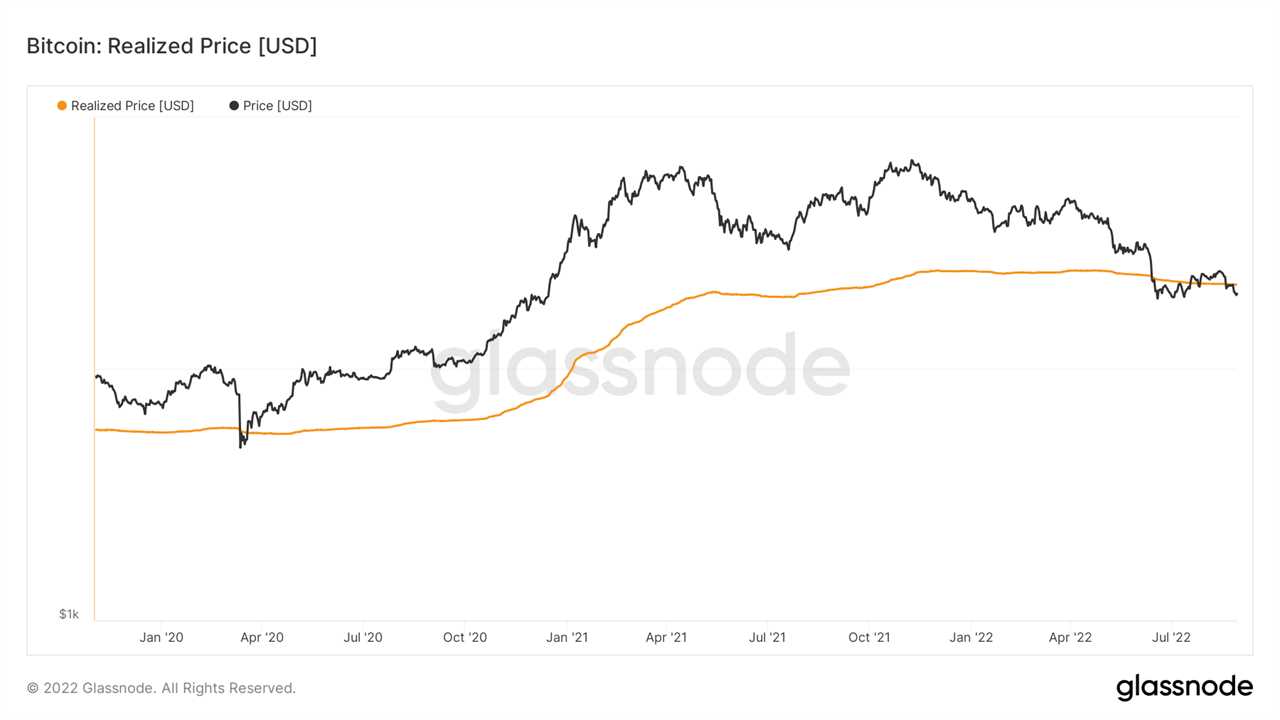
As Cointelegraph reported, realized price — the average at which the BTC supply last moved — now sits at around $21,600, data from on-chain analytics firm Glassnode confirms.
"Extreme fear" makes a comeback
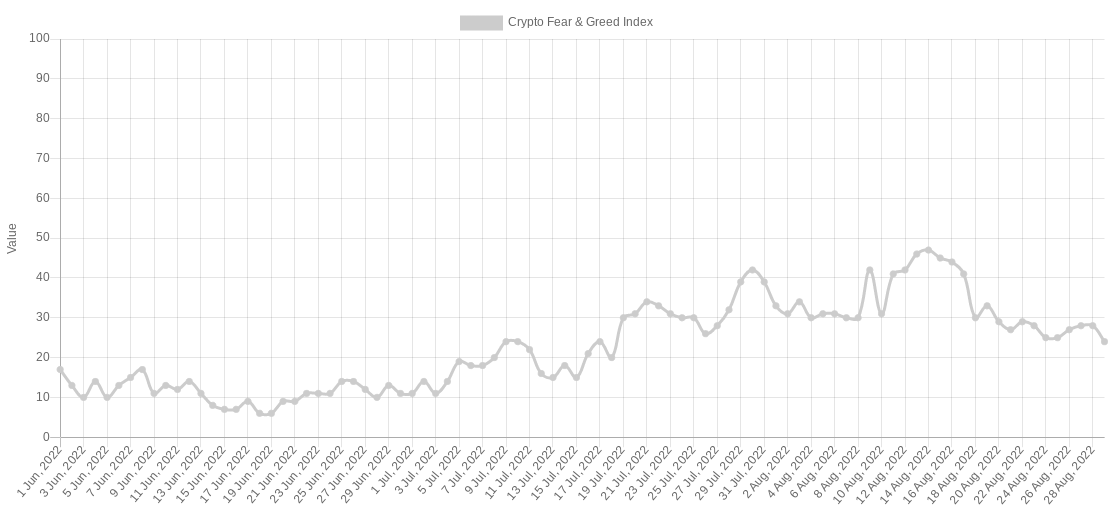
Perhaps unsurprisingly, Bitcoin heading back below $20,000 has caused its key market sentiment gauge to return to its most bearish category.
Related: Bitcoin mining difficulty set for 8-month record gains despite BTC price dip
As of Aug. 29, the Crypto Fear & Greed Index is back in “extreme fear” territory at 24/100.
Having reached as high as 47/100 during the relief rally, the Index now resides in the bracket which has characterized several months of 2022.
This year even saw its longest-ever spell in “extreme fear,” along with lows of just 6/100 as an overall market sentiment score.
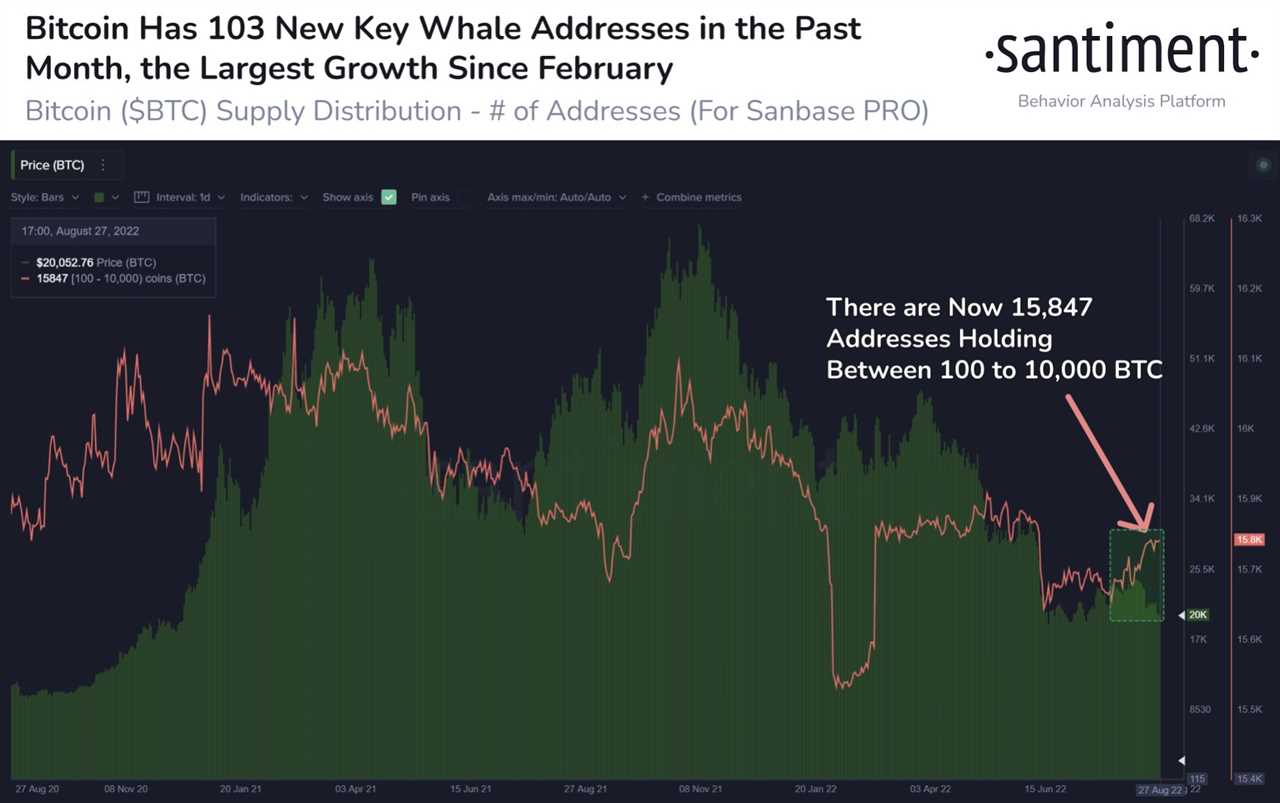
Analyzing the mood across investors, however, on-chain research firm Santiment noted that large-volume investors were adding to their holdings rather than divesting.
“As Bitcoin has danced around $20,000 this weekend, a positive sign is the growth in the amount of key whale addresses,” it commented on a chart for August.
“There's a correlation between $BTC's price & the amount of addresses holding 100 to 10k $BTC, and they're up 103 in the past 30 days.”
Nonetheless, others felt that there was still some way to go before a genuine macro turning point was reached in crypto demand.
“The true generational entry is not just when people are afraid to buy, but when they're too broke to buy,” on-chain analytics firm Material Indicators acknowledged.
“Not there yet.”
com. Every investment and trading move involves risk, you should conduct your own research when making a decision.
Title: US dollar hits new 20-year high — 5 things to know in Bitcoin this week
Sourced From: cointelegraph.com/news/us-dollar-hits-new-20-year-high-5-things-to-know-in-bitcoin-this-week
Published Date: Mon, 29 Aug 2022 09:08:10 +0100


