As Bitcoin price rallied to a new 2020 high, the open interest on CME Bitcoin (BTC) futures rose to $1.16 billion, making it the world’s largest Bitcoin futures market, according to Arcane Research. This suggests that institutional investors are relatively unmoved by the recent sharp correction in Bitcoin price.
Guggenheim Partners has become the latest and the largest Wall Street institution that plans to invest in Bitcoin.
Guggenheim has sought the Securities and Exchange Commission's (SEC) nod to invest up to 10% of its Macro Opportunities Fund’s net asset value in Bitcoin through the Grayscale Bitcoin Trust. The fund currently has $5.3 billion in assets, hence, Guggenheim may buy $500 million or more worth of Bitcoin.
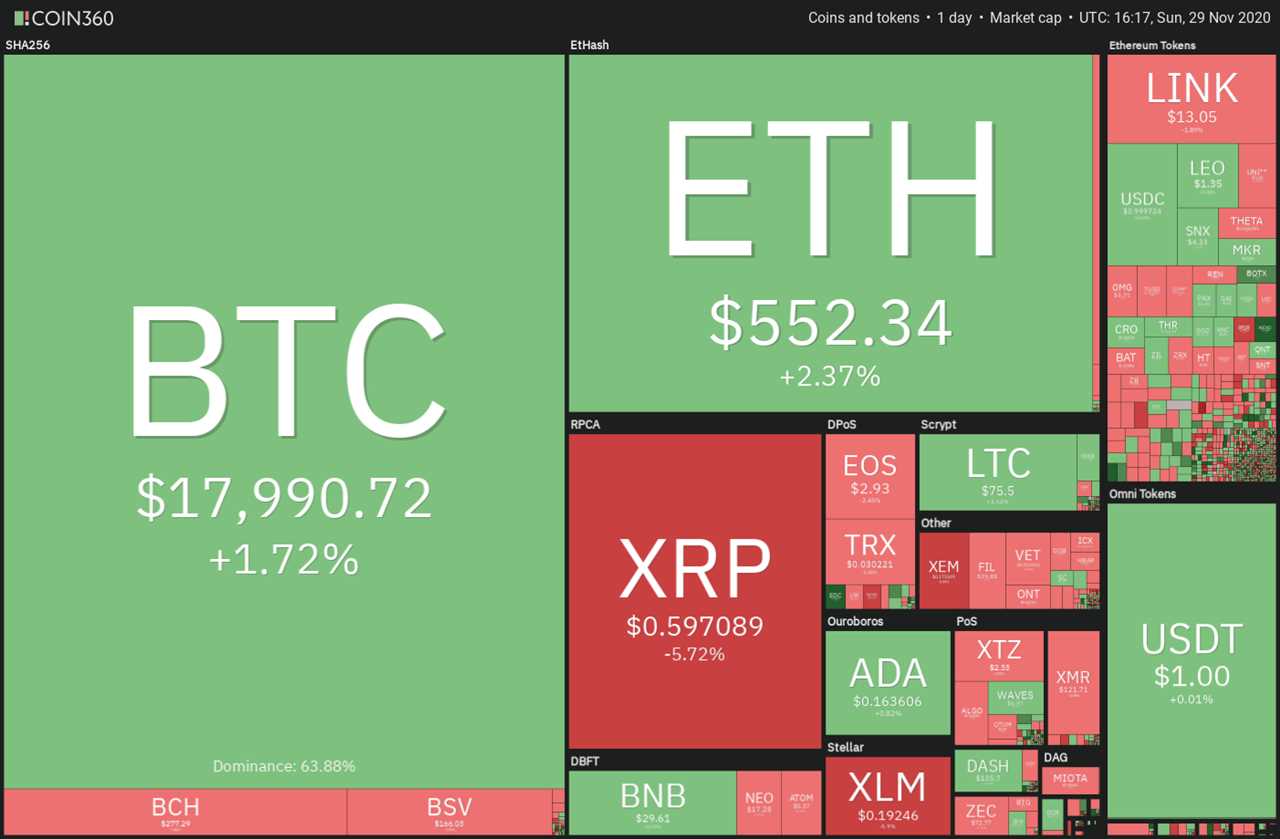
The increase in institutional investor’s appetite comes even as Bitcoin is close to its all-time high and this shows they are confident in the long term story of the digital asset.
Global Macro Investor and Real Vision CEO Raoul Pal said in an interview with Cointelegraph that Bitcoin’s most conservative target is a rally to $150,000 by November 2021. If a large amount of institutional money continues to flow into the crypto space, Bitcoin could even rise to $250,000, added Pal.
The long-term fundamentals of cryptocurrencies continue to improve but the price could still fall in the short term and it's likely that investors will view each dip as a buying opportunity.
Let’s analyze the charts of the top-five cryptocurrencies to find out what opportunities exist.
BTC/USD
In a strong uptrend, the bulls generally buy the dip to the 20-day exponential moving average. The long tails on the Nov. 26 and 27 candlesticks show that bulls aggressively purchased Bitcoin (BTC) at lower levels.
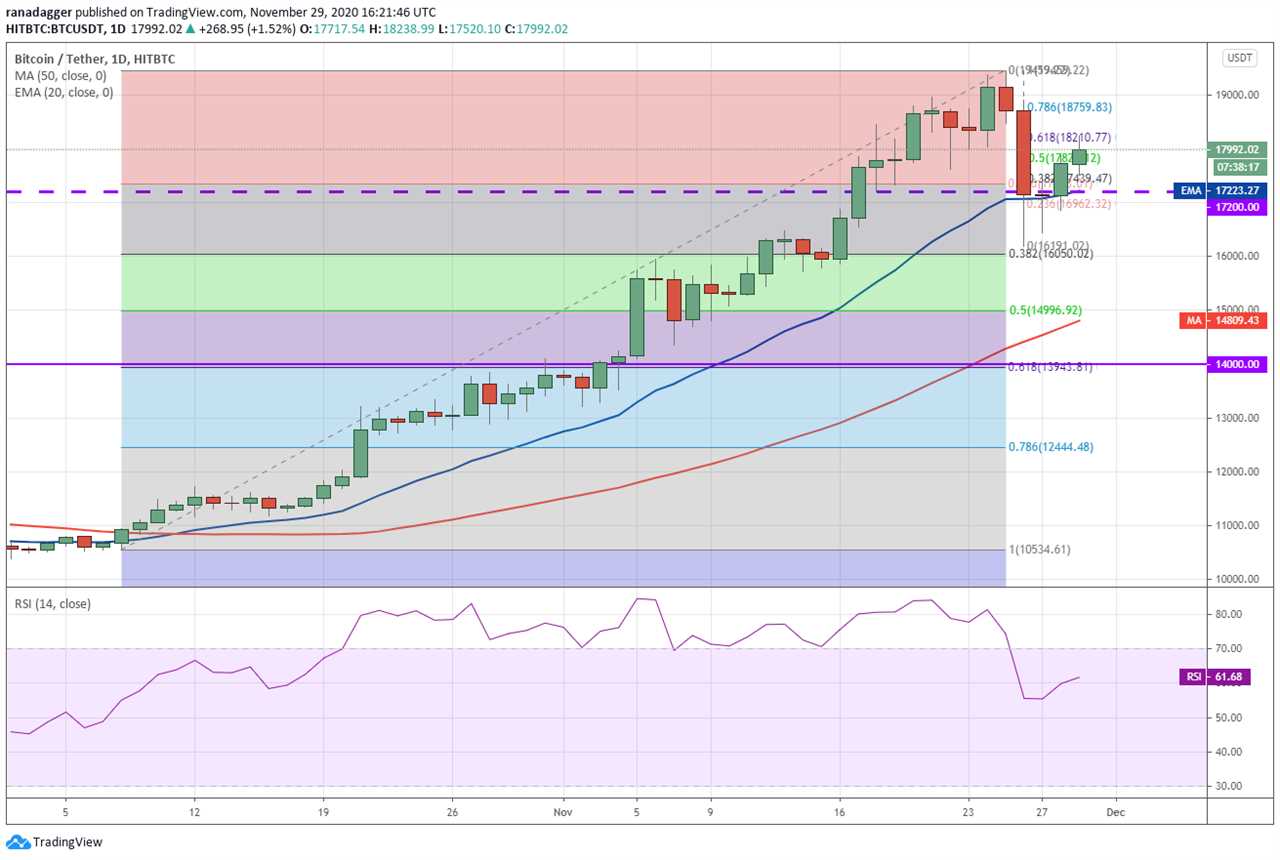
The upsloping moving averages and the relative strength index (RSI) in the positive zone suggest that bulls are in control.
However, the bears will try to stall the current up-move at $18,210.77, which is the 61.8% Fibonacci retracement level of the most recent fall. If the price turns down from this resistance, a few days of range-bound action is possible.
Conversely, if the bulls can push the price above $18,210.77, the BTC/USD pair could rally to $19,459.22 and then to the magical number of $20,000. A breakout of this resistance could start the next leg of the uptrend.
This bullish view will be invalidated if the price turns down from the current levels and plummets below $16,000.
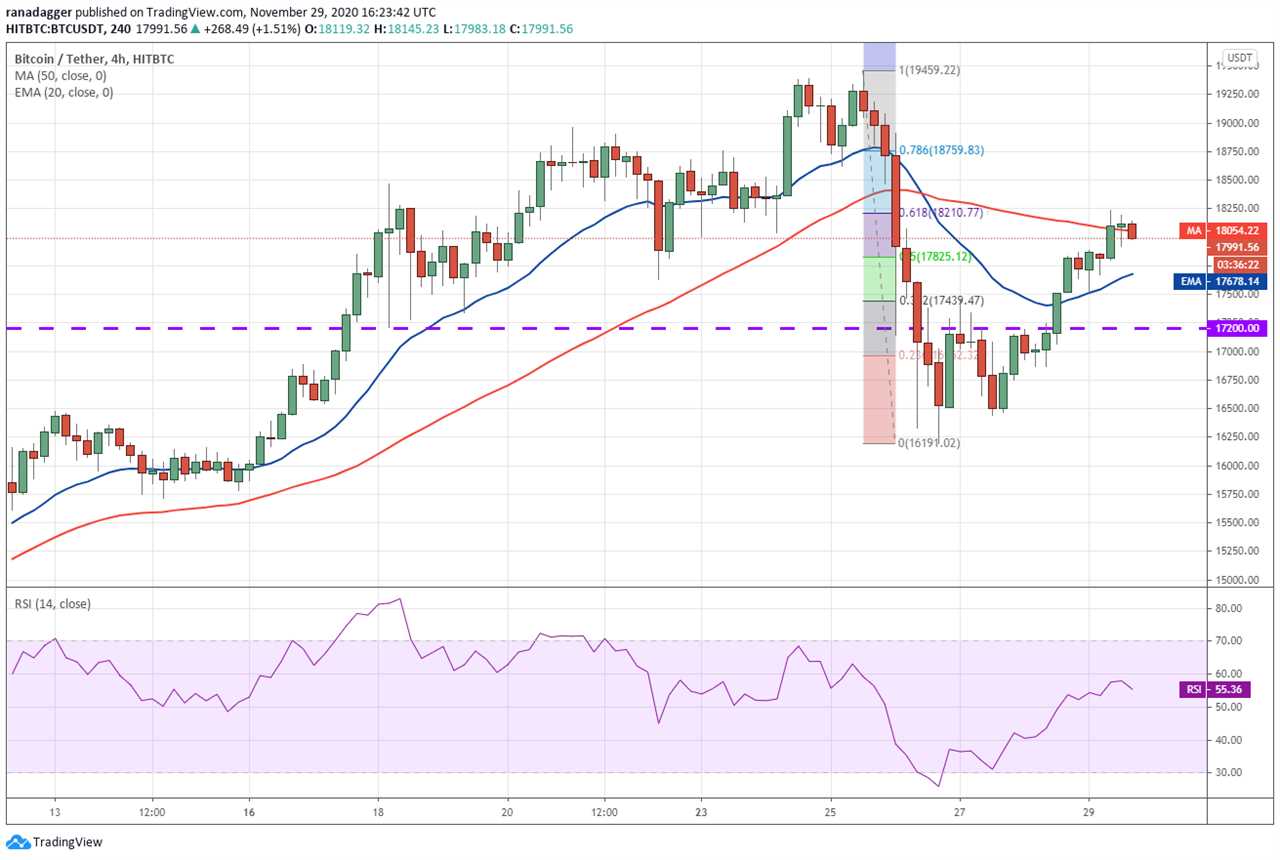
The 4-hour chart shows that the rebound off the lower levels has hit a wall near the 50-simple moving average, which is placed just below the 61.8% Fibonacci retracement level of $18,210.77.
If the bears can sink the price below $17,500, a retest of $16,400 will be on the cards. If the bulls again buy at lower levels, a few days of range-bound action could ensue.
On the contrary, if the bulls can propel the price above $18,210.77, a retest of $19,459.22 is possible.
ETH/USD
The long tails on the Nov. 26 and 27 candlesticks show that the bulls purchased the dips in Ether (ETH) to the breakout level of $488.134 aggressively. This suggests that the sentiment remains positive.
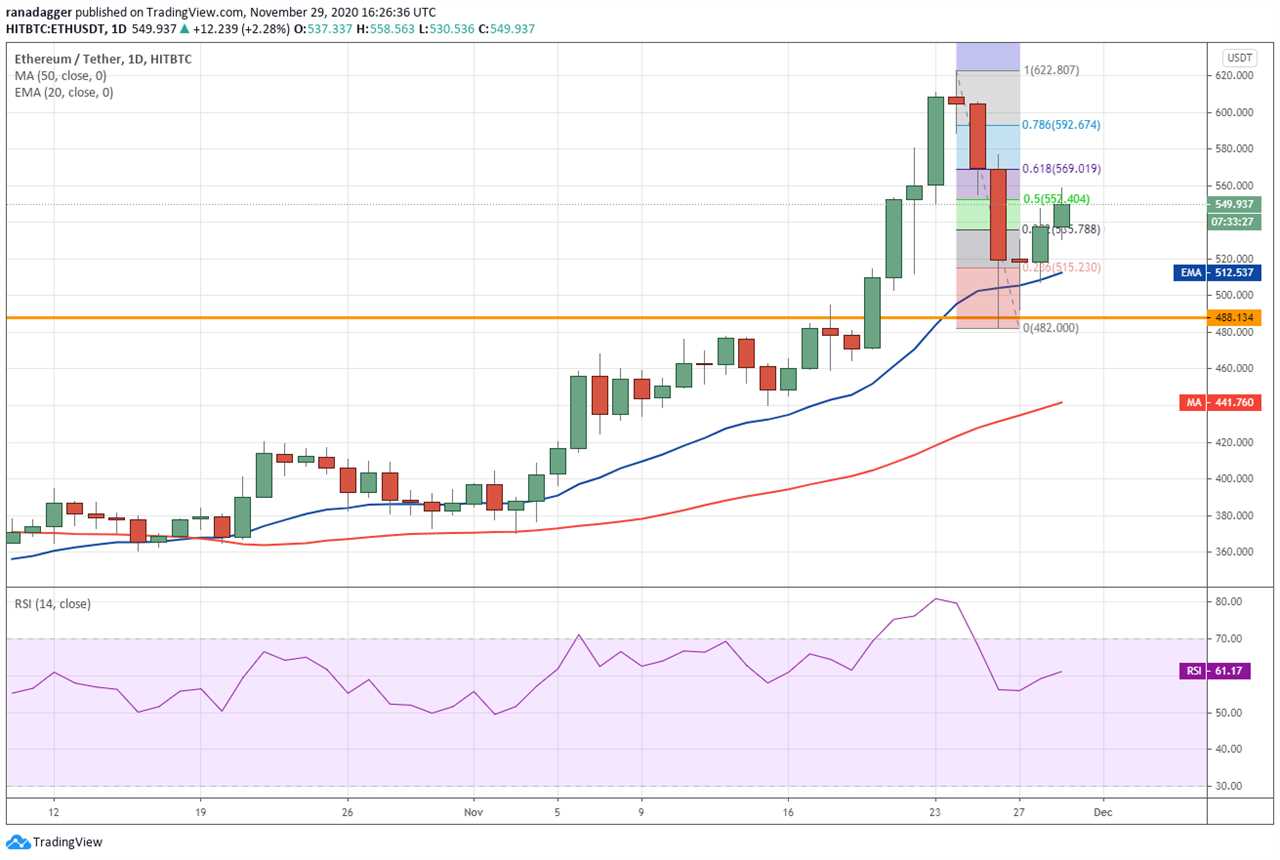
The upsloping moving averages and the RSI in the positive zone suggest that bulls have the upper hand. However, the buyers are unlikely to have an easy path to $625. The bears will try to stall the current rally at the 61.8% Fibonacci retracement level of $569.019.
If the price turns down from this resistance and breaks the 20-day EMA ($512), then a retest of $482 will be on the cards.
Conversely, if the bulls can push the price above $569.019, the ETH/USD pair could rally to $592.674 and then $622.807. A breakout of this level may start the next leg of the uptrend that could propel the pair to $800.
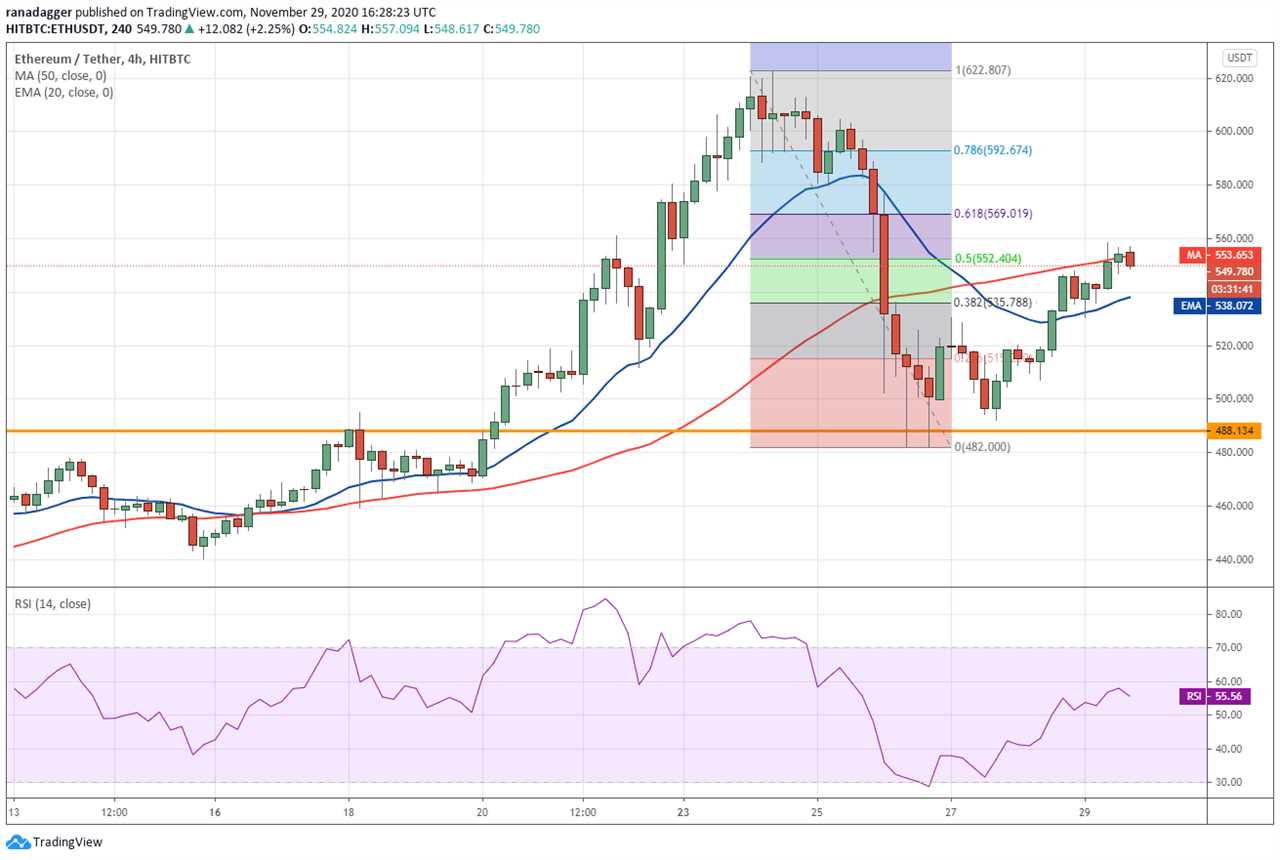
The 4-hour chart shows that the bears are defending the 50-SMA. If the price turns down from the current levels and drops below $520, a retest of $482 will be on the cards.
However, if the bulls can push the price above $569.019, a rally to $592.674 and then to $622.807 is possible.
Traders can keep an eye on the RSI because if it sustains above 60, it will suggest that bulls are back in command. On the other hand, if the RSI turns down from 60, it will suggest resistance at higher levels and that could result in a few days of range-bound action.
ADA/USD
Cardano's ADA had corrected to $0.1199845 on Nov. 26, just above the 78.6% Fibonacci retracement level of $0.1173063. Usually, such a large fall reduces the possibility of the continuation of the uptrend.
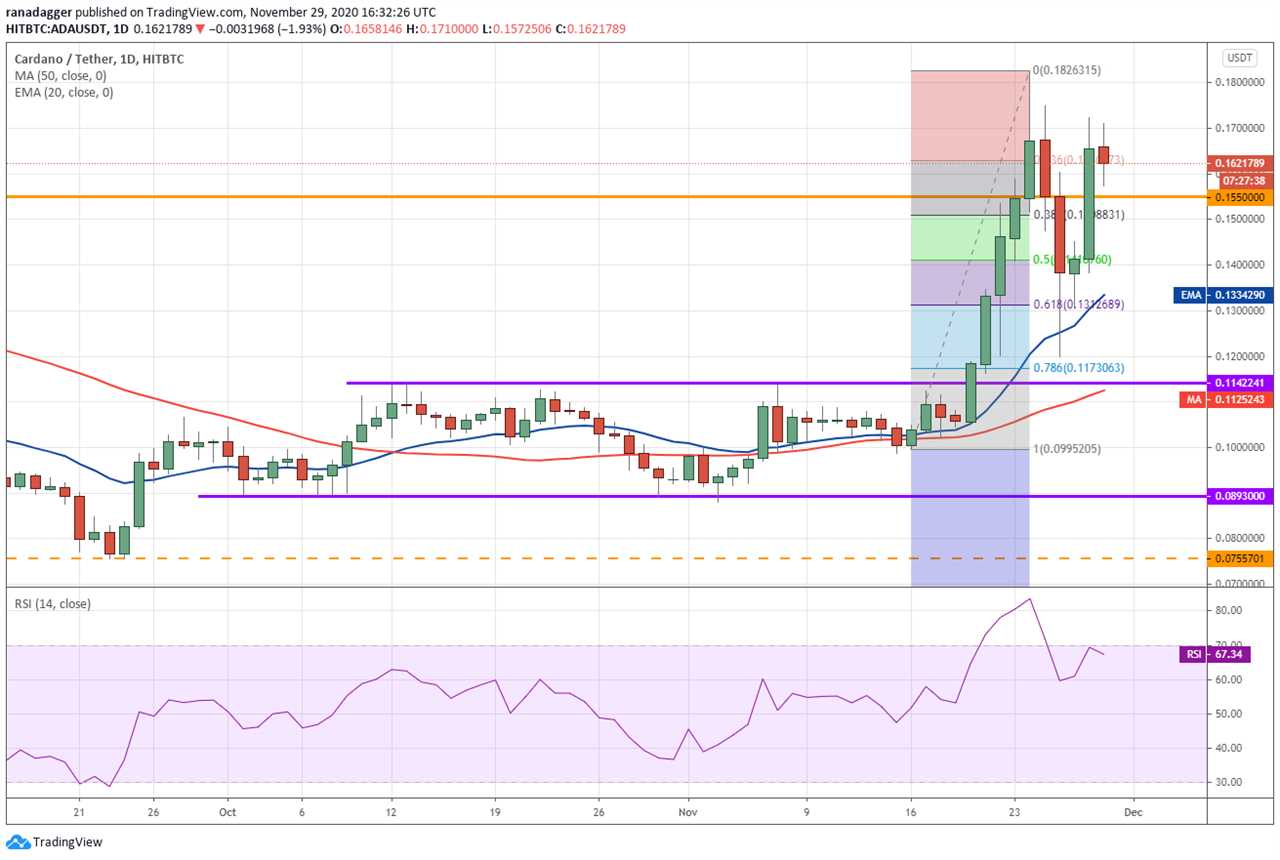
However, the long tail on the Nov. 26 candlestick and the sharp rebound on Nov. 28 has again brought the bulls back in contention. The bounce shows that the bull aggressively purchased at lower levels.
The upsloping moving averages and the RSI near the overbought territory suggest that bulls are in command. If the bulls can thrust the price above $0.1826315, the next leg of the uptrend to $0.2129 and then to $0.235 could begin.
Contrary to this assumption, if the price turns down from the $0.1826315 resistance, the ADA/USD pair may remain range-bound for a few days.
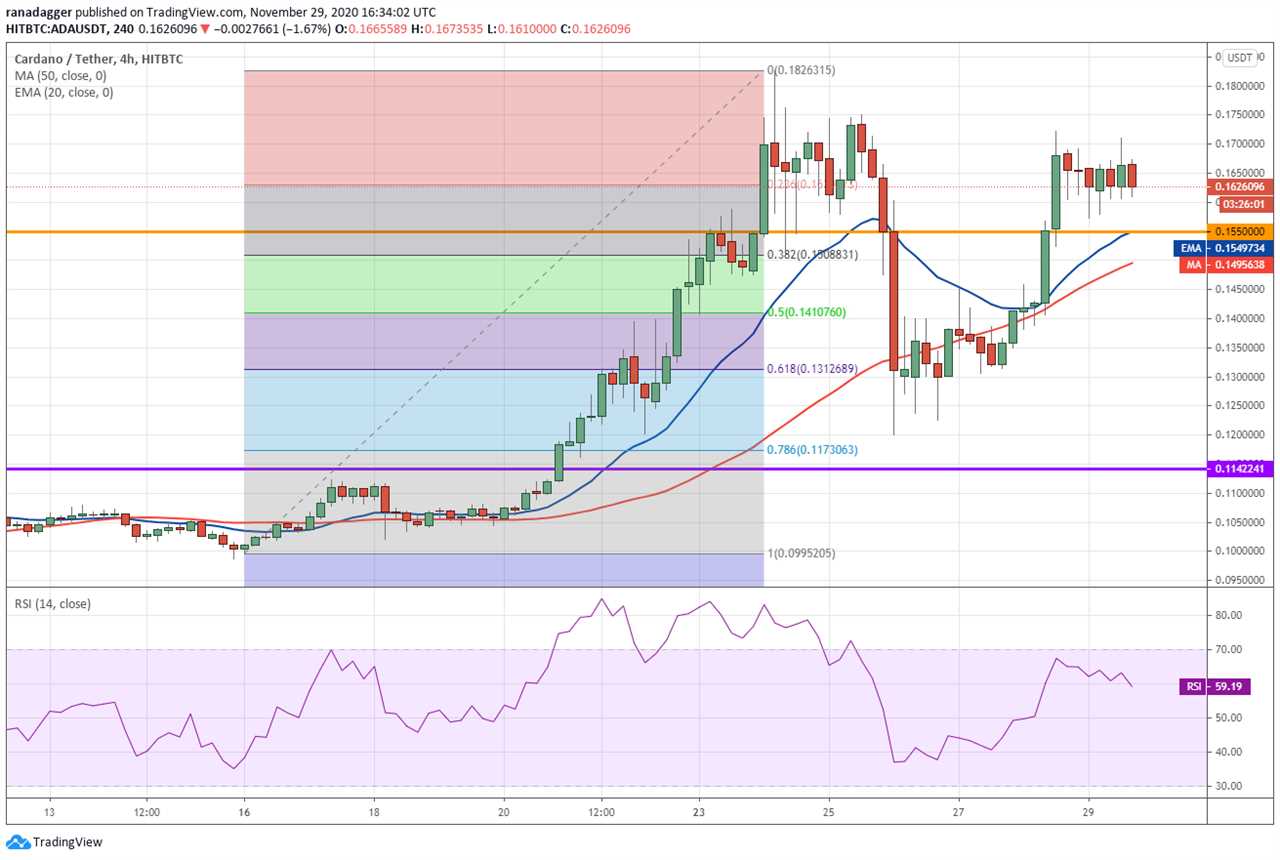
The upsloping moving averages on the 4-hour chart and the RSI in the positive zone show that the bulls have the upper hand. The buyers will now try to drive the price above $0.175 resistance.
If they can do that, a retest of $0.1826315 is possible. Conversely, if the price turns down from the overhead resistance, the pair could remain range-bound for a few days. A break below the moving averages will suggest that the bears have made a comeback.
XLM/USD
The correction in Stellar Lumens (XLM), from the recent highs of $0.231655 on Nov. 25, only lasted only for a day on Nov. 26. This suggests that the bulls aggressively purchased the dips as they expect the rally to extend further.
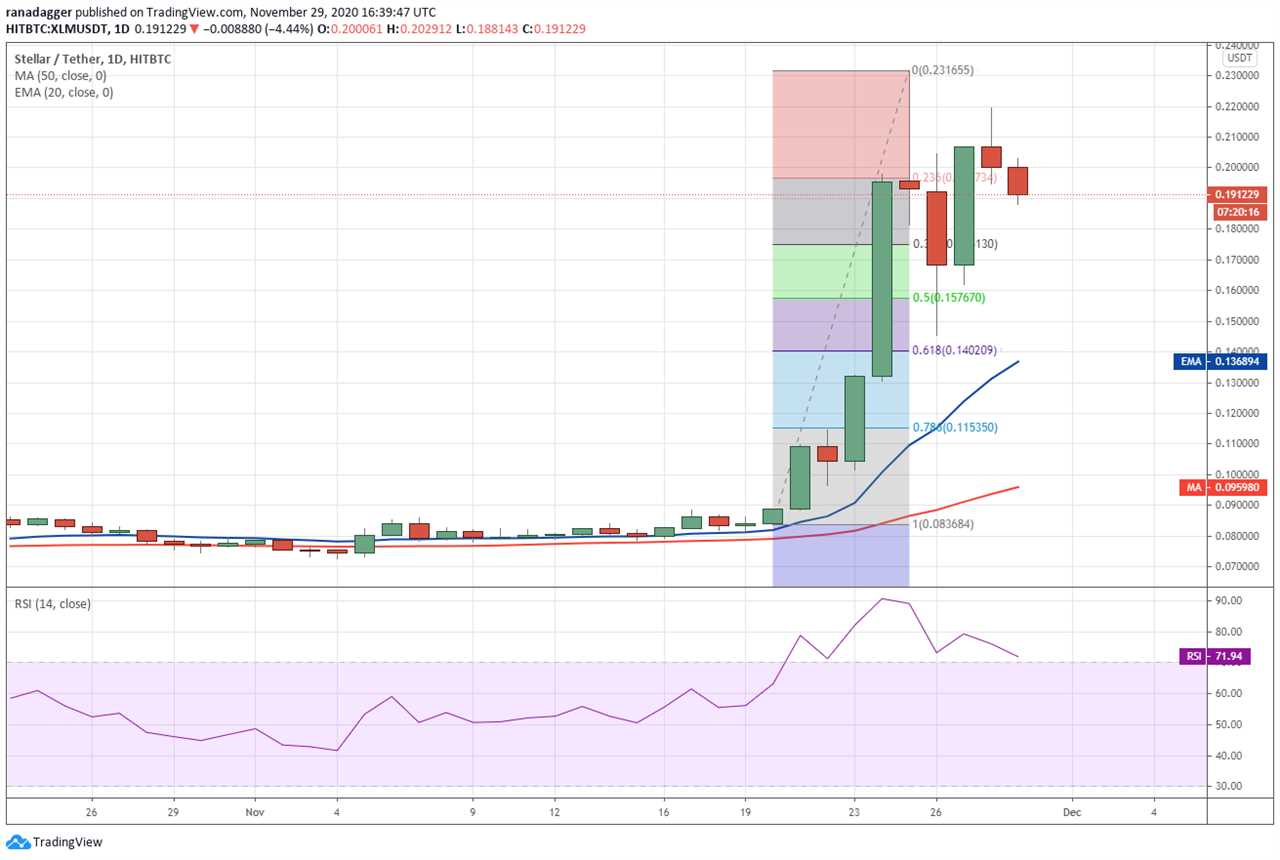
The upsloping moving averages and the RSI in the overbought territory suggest that bulls are in command. The buyers made their intention clear with the 22.83% rally on Nov. 27.
If the bulls can push the price above $0.231655, the next leg of the uptrend could begin. The next level to watch on the upside is $0.2933.
However, the bears have other plans as they are trying to stall the up-move in the $0.22 to $0.2316555 resistance zone.
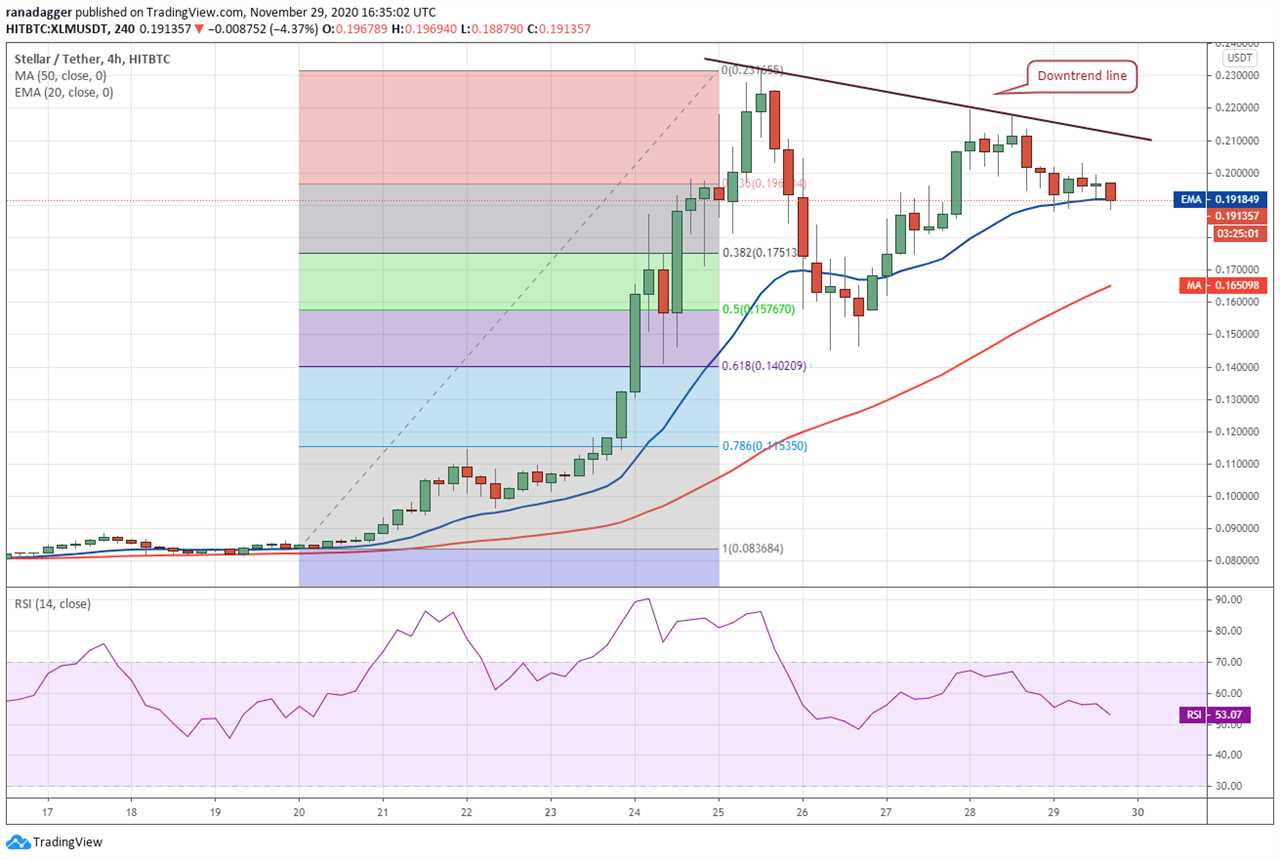
The bulls are attempting to defend the 20-EMA. If the price bounces off this support, the bulls will try to push it above the downtrend line. If they succeed, a retest of $0.231655 will be on the cards.
Contrary to this assumption, if the bears sink the price below the 20-EMA, the pair could drop to the 50-SMA. If that happens, the pair may consolidate in a large symmetrical triangle for a few days.
The advantage will shift in favor of the bears if the pair drops below the $0.145 to $0.140 support zone.
XEM/USD
NEM (XEM) broke out and closed above $0.1690655 on Nov. 25 but the long wick on the day’s candlestick showed that the bulls booked profits at higher levels. That was followed by a sharp decline on Nov. 26.
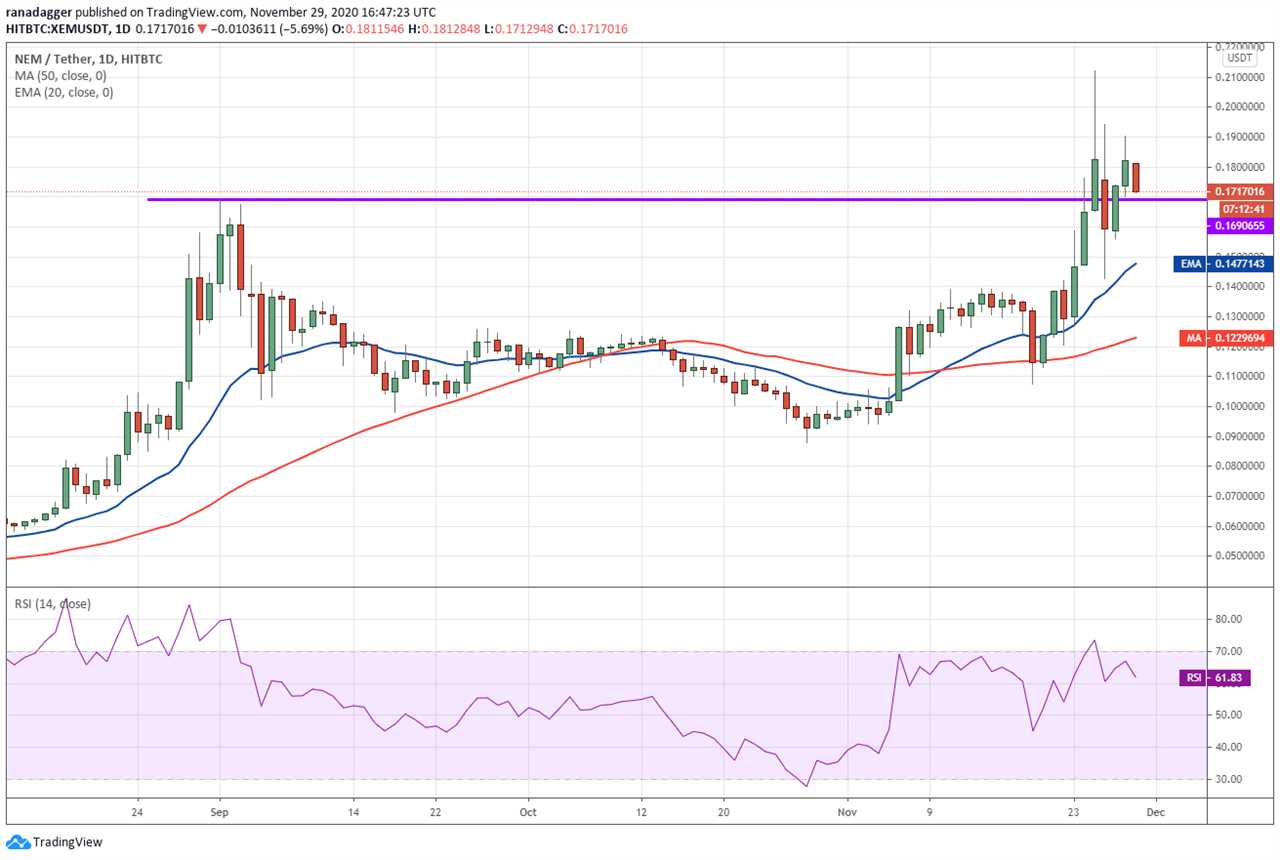
However, the bulls purchased the dip to the 20-day EMA ($0.147) as seen from the long tail on the Nov. 26 candlestick. The bulls pushed the price back above the overhead resistance on Nov. 27.
The price has sustained above $0.1690655 for the past two days but the bulls are facing resistance close to $0.190. The bears are currently attempting to sink the price back below $0.1690655. If they succeed, a drop to the 20-day EMA will be on the cards.
Conversely, if the bulls can push the price above the $0.190 to $0.2122 resistance zone, the next leg of the uptrend to $0.275 could begin.
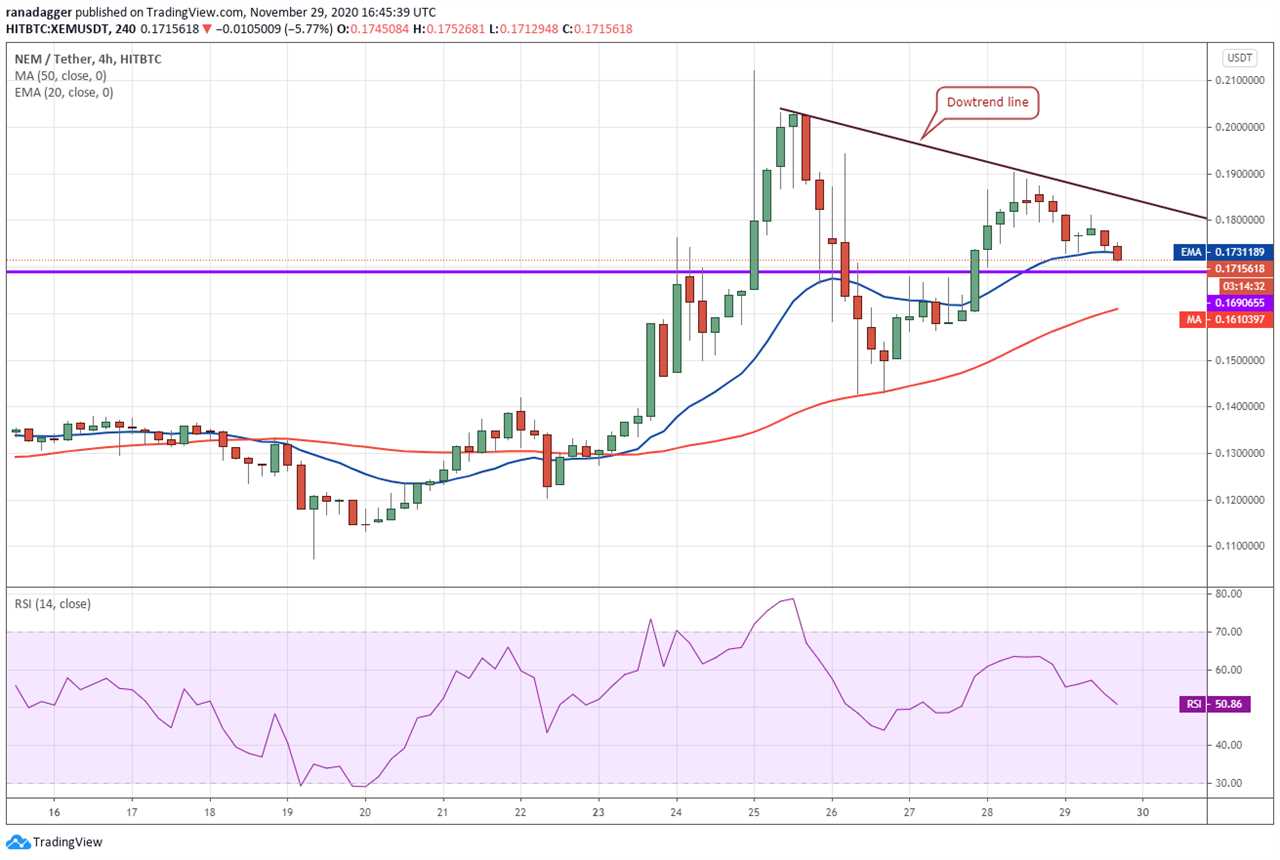
The bulls are currently attempting to defend the critical support at $0.1690655. If the pair rebounds off this support, the bulls will try to push the price above the downtrend line. If they succeed, the XEM/USD pair could rise to the $0.203 to $0.2122 resistance zone.
Contrary to this assumption, if the bears sink the price below $0.1690655, a drop to the 50-SMA is possible. A break below this level could result in a retest of the $0.1428512 support.
Title: Top 5 cryptocurrencies to watch this week: BTC, ETH, ADA, XLM, XEM
Sourced From: cointelegraph.com/news/top-5-cryptocurrencies-to-watch-this-week-btc-eth-ada-xlm-xem
Published Date: Sun, 29 Nov 2020 17:59:09 +0000


