
The United States equities markets have been under a firm bear grip for a large part of the year. The S&P 500 and the Nasdaq Composite have declined for three quarters in a row, a first since 2009. There was no respite in selling in September and the Dow Jones Industrial Average is on track to record its worst September since 2002. These figures outline the kind of carnage that exists in the equities market.
Compared to these disappointing figures, Bitcoin (BTC) and select altcoins have not given up much ground in September. This is the first sign that selling could be drying up at lower levels and long-term investors may have started bottom fishing.
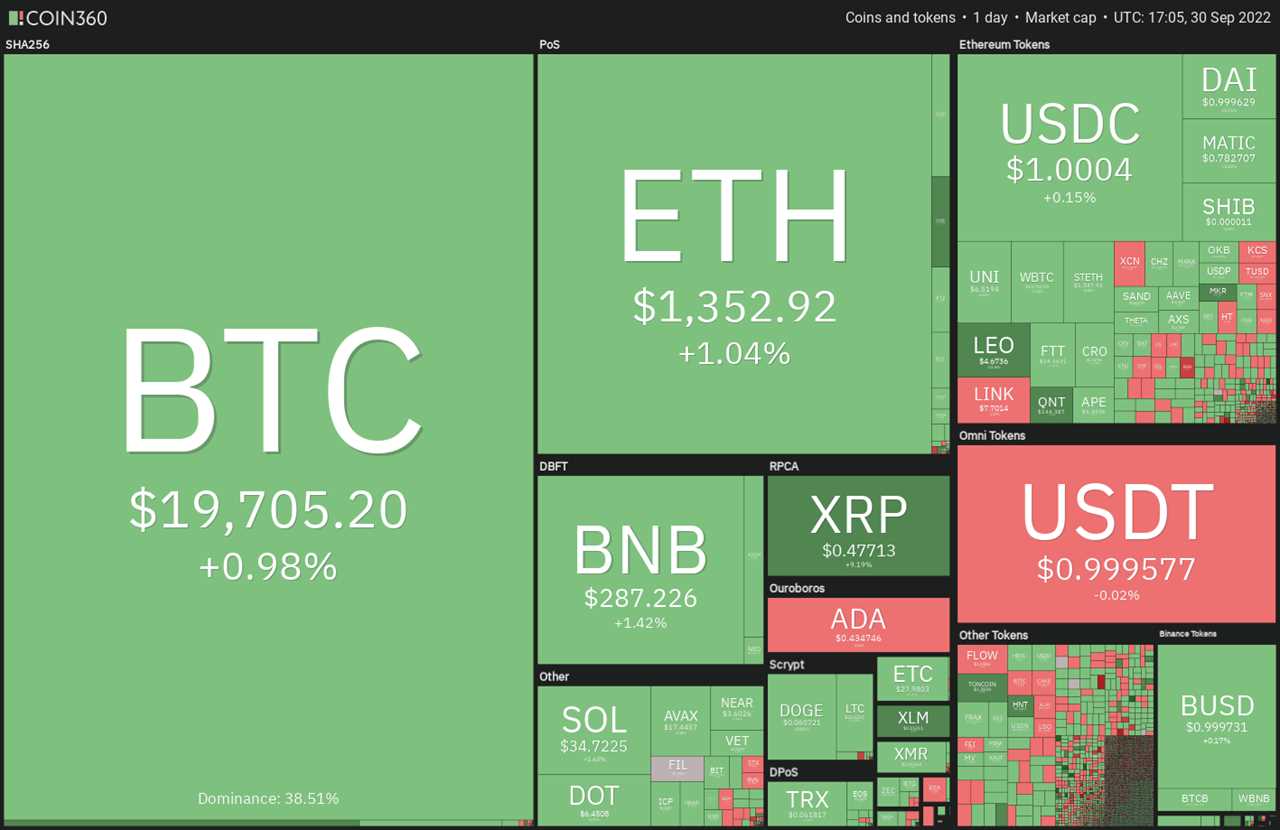
In the final quarter of the year, investors will continue to focus on the inflation data. Any indication of inflation topping could bring about a sharp recovery in risk assets, but if inflation remains stubbornly high, then a round of sell-offs could follow.
Let’s study the charts of the S&P 500 index, the U.S. dollar index (DXY) and the major cryptocurrencies to determine if a recovery is on the cards.
SPX
The S&P 500 index (SPX) has been under intense selling pressure for the past few days but the bulls have held their ground. This indicates that bulls are buying the dips near 3,636.
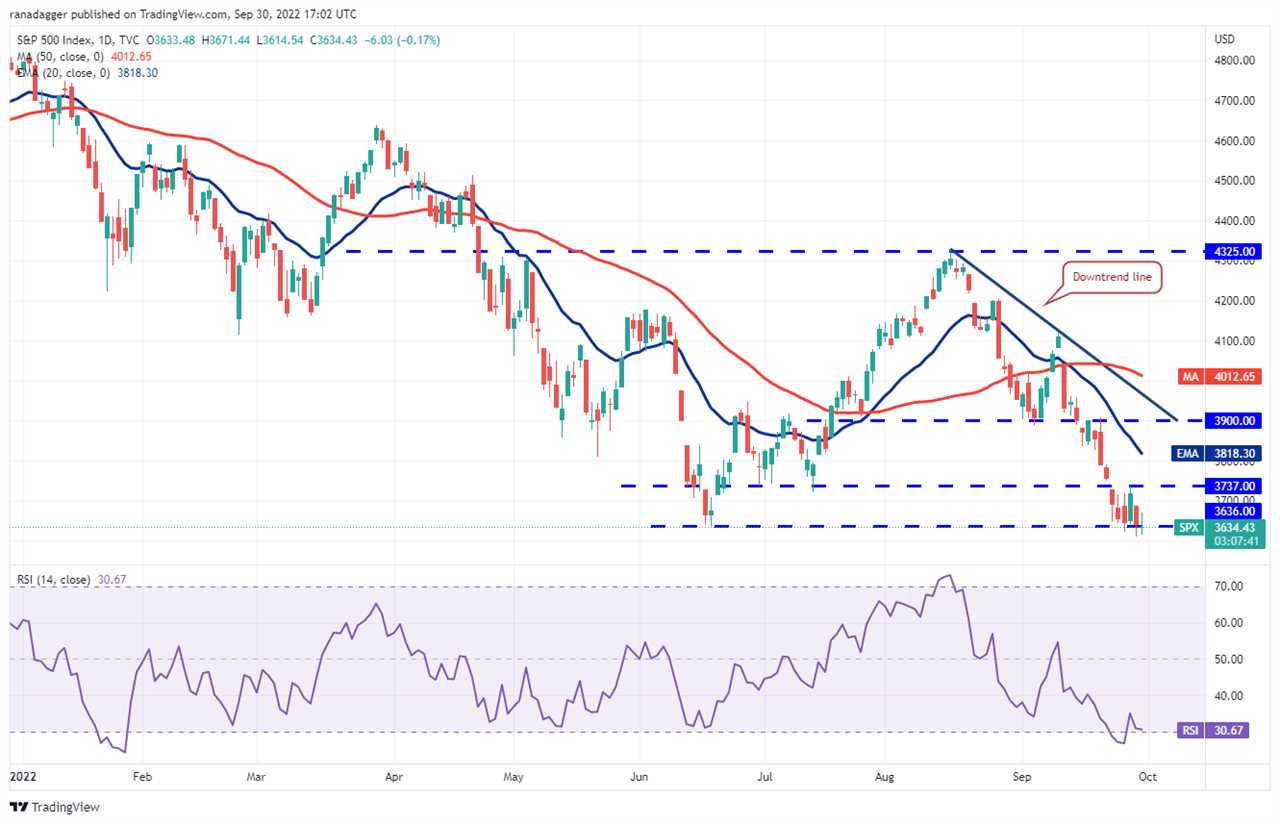
The first resistance on the upside is 3,737. If bulls thrust the price above this level, the index could rise to the 20-day exponential moving average (3,818). In a downtrend, this is the important level to keep an eye on because a break and close above it will suggest that the bears may be losing their grip.
Sharp declines are usually followed by strong rallies. That could carry the index to the downtrend line and then to the 50-day simple moving average (4,012).
The bears are likely to have other plans. They will try to extend the downtrend by sinking and sustaining the price below 3,636. If they manage to do that, the index could plummet to 3,500 and later to 3,325.
DXY
The U.S. dollar index surged to 114.77 on Sept. 28, which pushed the relative strength index (RSI) into deeply overbought territory. This may have attracted profit-booking by the short-term traders which pulled the price near the 20-day EMA (111).
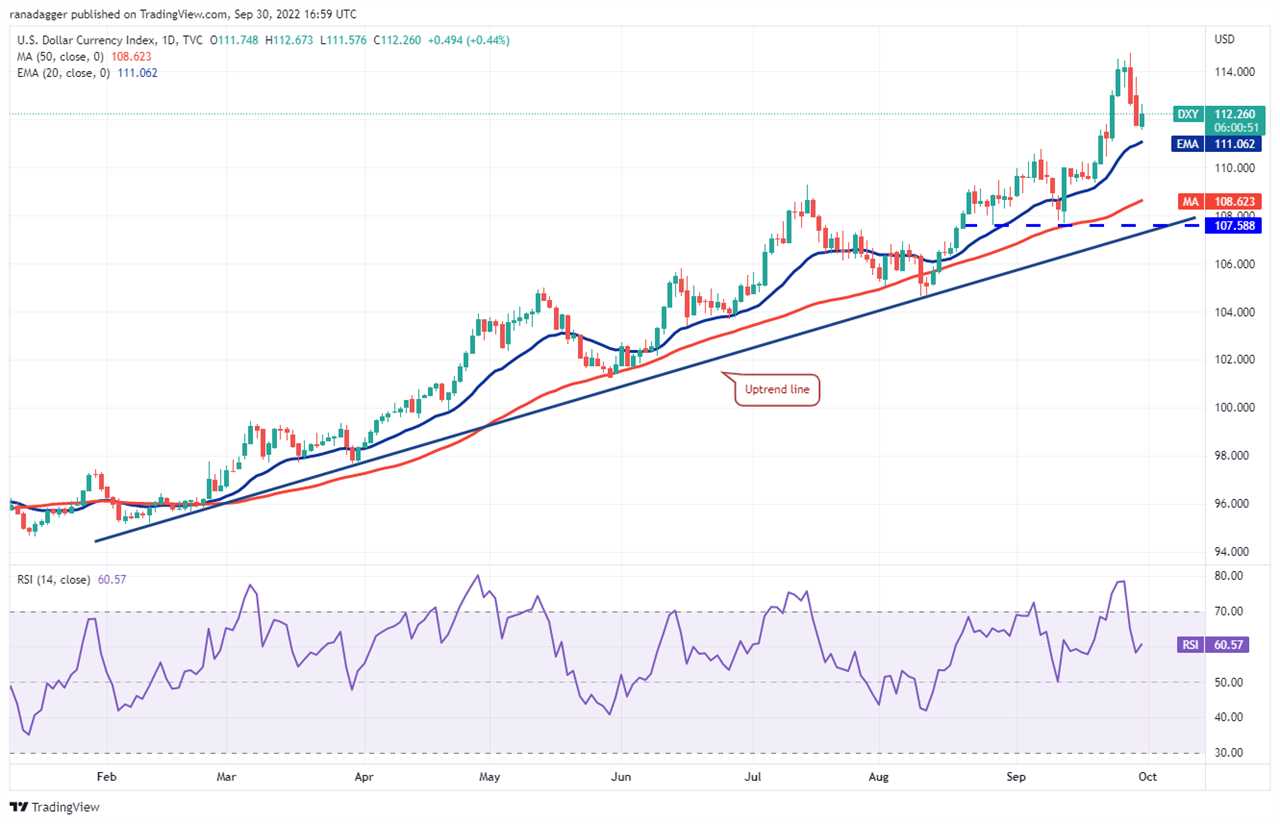
The bears will have to yank the price below the 20-day EMA to suggest that the bullish momentum could be weakening. That could clear the path for a possible drop to the 50-day SMA (108).
The zone between the 50-day SMA and the uptrend line is likely to witness aggressive buying by the bulls because if they fail to defend the zone, it will indicate that the index may have topped out.
On the other hand, if the price turns up from the current level or rebounds off the 20-day EMA, it will indicate that the bulls continue to buy on dips. Buyers will then again attempt to thrust the price above 114.77 and resume the uptrend. The next target objective on the upside is 118.
BTC/USDT
Bitcoin bounced off the strong support at $18,626 on Sept. 28, indicating that the bulls continue to fiercely defend this level. The long tail on the candlestick of the past two days shows that bulls are buying the intraday dips.
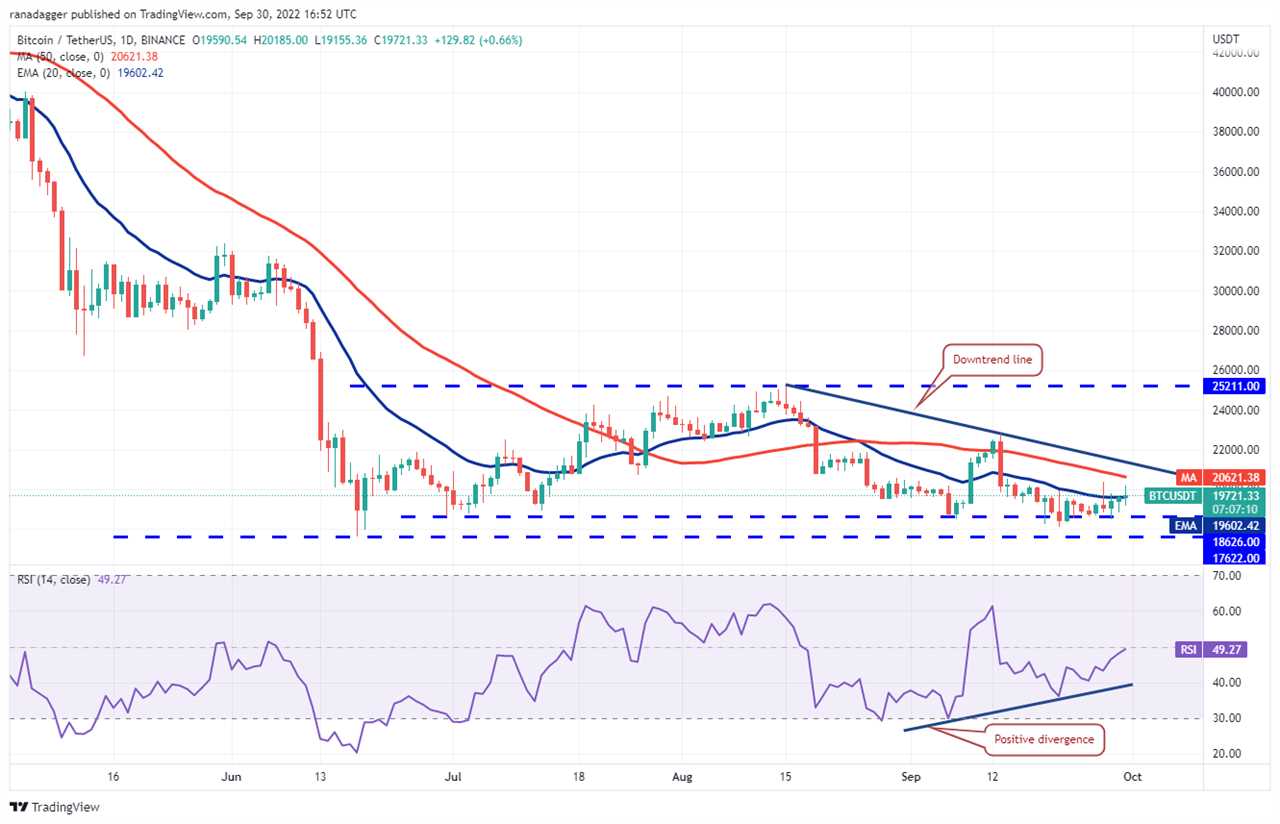
The bulls pushed the price above the 20-day EMA ($19,602) on Sept. 30 but are struggling to sustain the higher levels. This shows that bears are selling near the 50-day SMA ($20,621).
If bulls do not allow the price to drop below the 20-day EMA, the likelihood of a rally to the downtrend line increases. The bears are expected to mount a strong resistance at this level but if bulls clear this hurdle, the BTC/USDT pair could signal a short-term trend change. The pair could then rise to $22,799.
Contrary to this assumption, if the price turns down from the current level or the 50-day SMA ($20,625), the pair could again drop to the $18,626 to $17,622 support zone.
ETH/USDT
Ether (ETH) has been declining in a descending channel pattern for the past several days. In the short term, the price has been stuck between $1,250 and $1,410, indicating demand at lower levels but selling near the resistance.
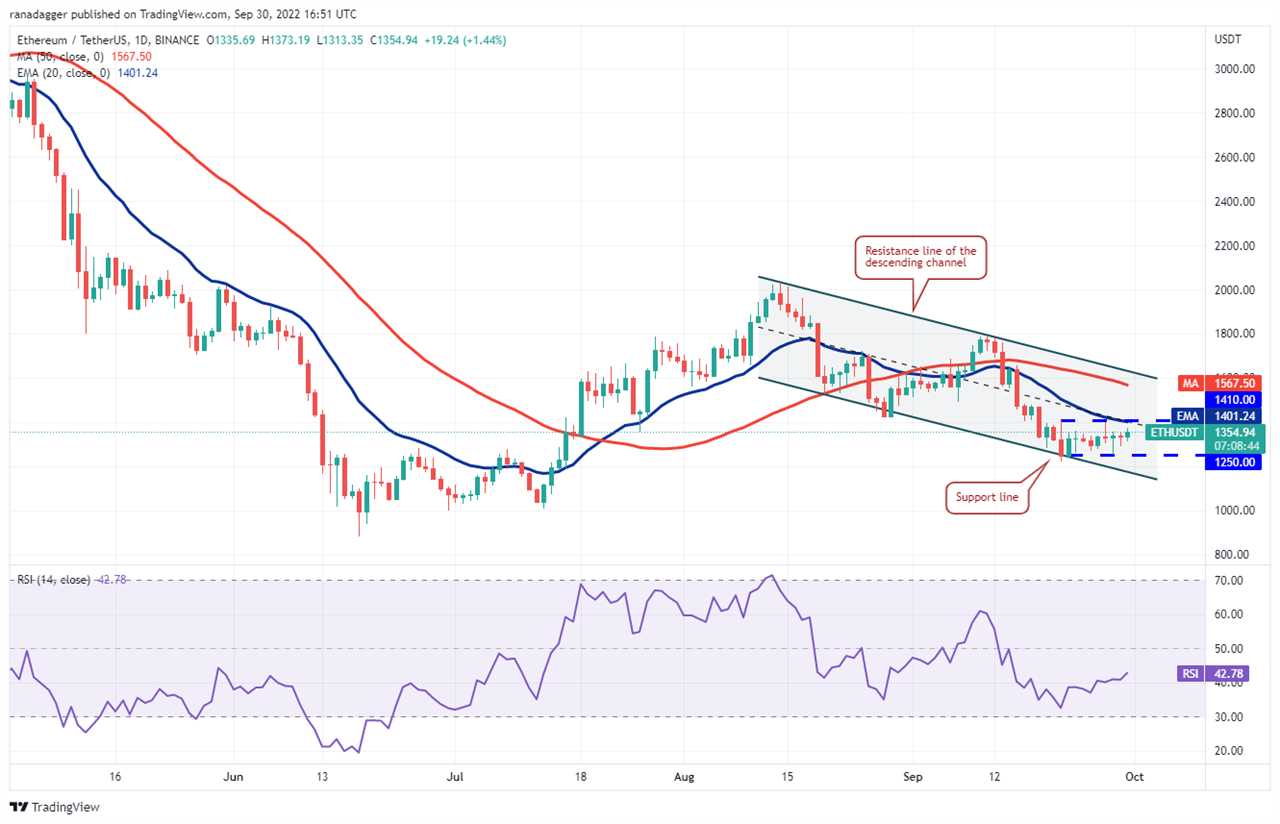
The price action inside the range is usually random and volatile. Hence, it is difficult to predict the direction of the breakout with certainty.
If the price breaks above $1,410, it will suggest that the bulls have absorbed the supply. That could propel the price to the resistance line of the channel. The bulls will have to overcome this barrier to suggest a potential trend change.
On the other hand, if the price turns down and breaks below $1,250, the bears will attempt to cement their advantage by pulling the ETH/USDT pair below the channel. If they succeed, the pair could drop to $1,000.
BNB/USDT
Binance Coin (BNB) turned up sharply from $266 and broke above the 20-day EMA ($278) on Sept. 28. This indicates that lower levels are attracting strong buying by the bulls.
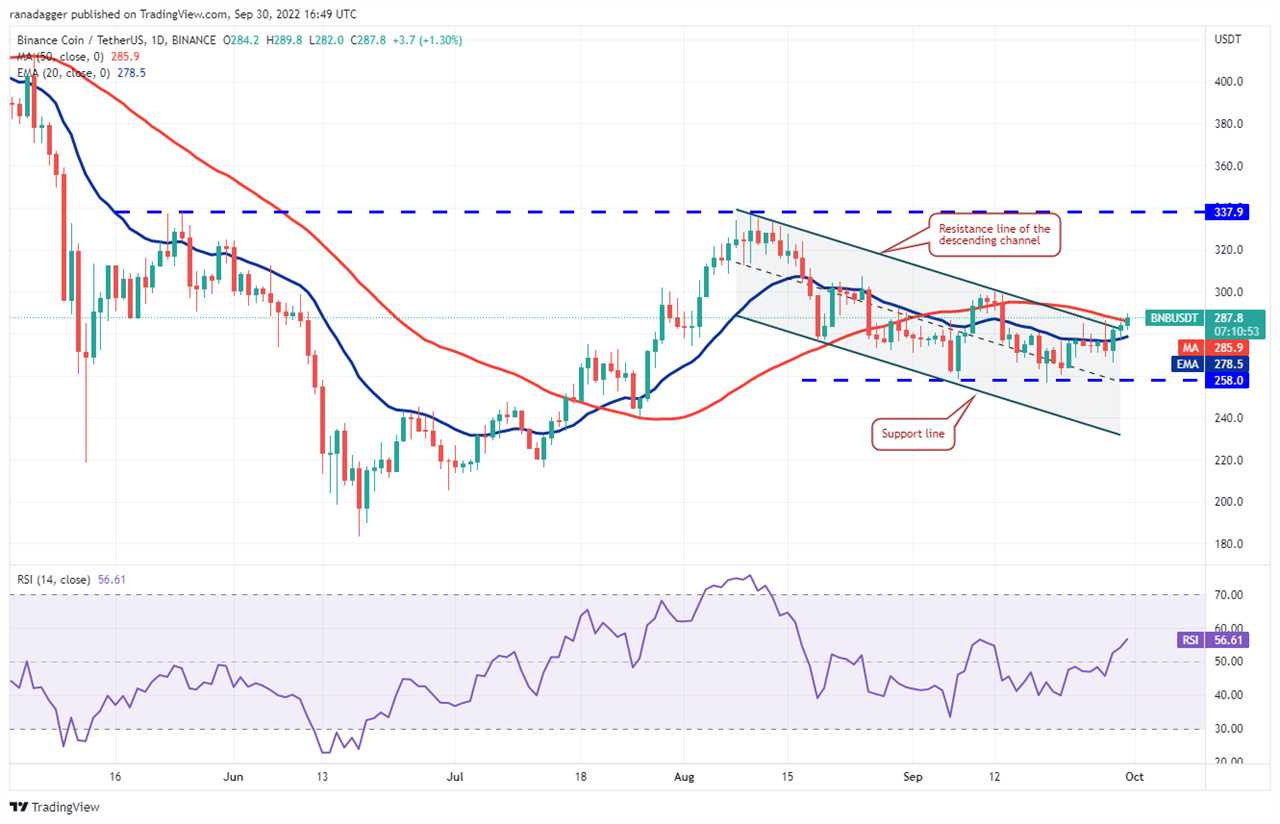
The bulls pushed the price above the resistance line of the descending channel on Sept. 29 but are facing resistance at the 50-day SMA ($288). If bulls do not allow the price to plummet back below the 20-day EMA, it will improve the prospects of a break above the 50-day SMA. The BNB/USDT pair could then rally to $300 and later to $338.
On the contrary, if the price turns down and breaks below the 20-day EMA, it will suggest that bears continue to sell at higher levels. The pair could then decline to the strong support at $258.
XRP/USDT
XRP rebounded off the 20-day EMA ($0.43) on Sept. 28, indicating a change in sentiment from selling on rallies to buying on dips. However, the bears are unlikely to give up as they will try to stall the recovery in the $0.52 to $0.56 zone.
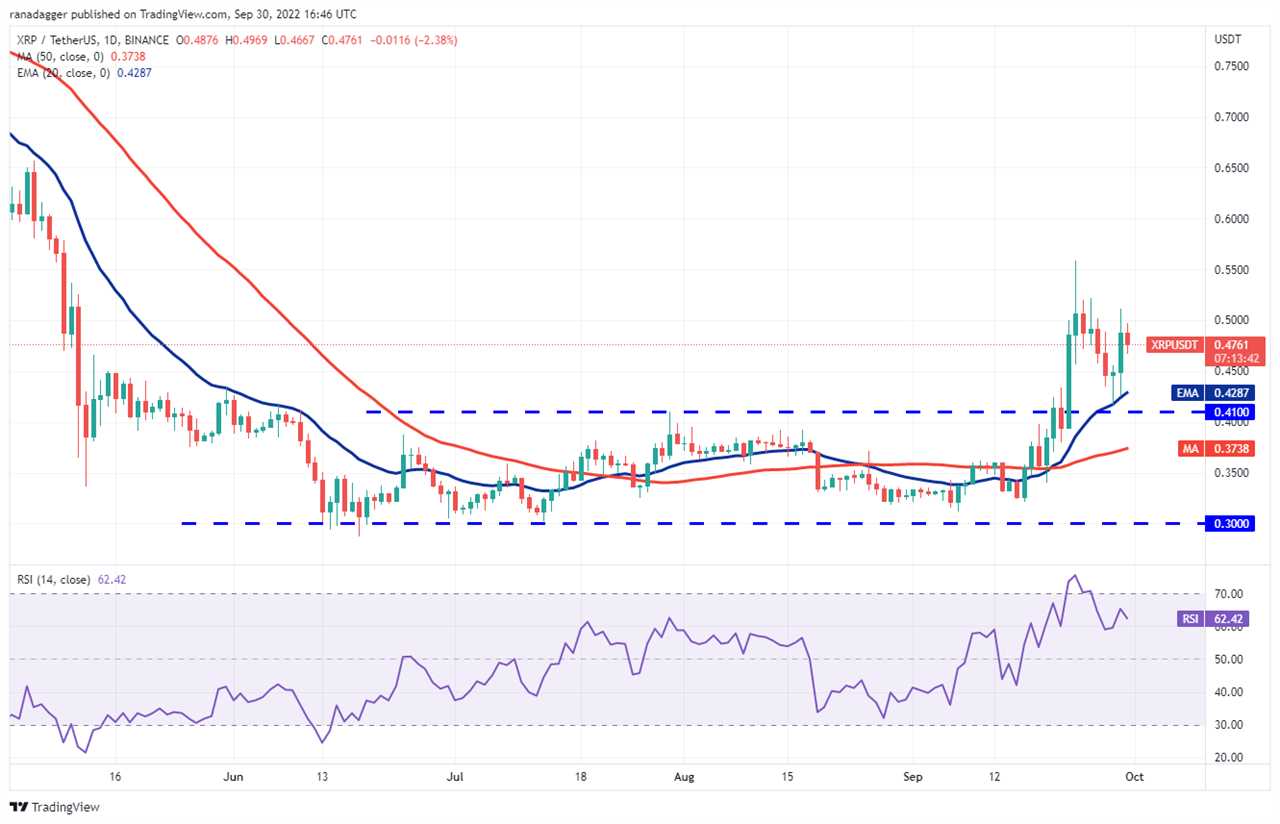
If buyers do not give up much ground from the current level, the possibility of a break above the overhead zone increases. A break above $0.56 will signal the resumption of the uptrend. The XRP/USDT pair could then rise to $0.66.
Conversely, if the price continues lower, the pair could drop to the breakout level of $0.41. The bulls are likely to defend this level vigorously. If the price rebounds off this level, the pair may enter a range-bound action for a few days.
ADA/USDT
The long tail on Cardano’s (ADA) Sept. 28 and 29 candlestick shows that the bulls bought at lower levels in an attempt to defend the uptrend line. Although the price rose above the uptrend line on Sept. 29, buyers could not sustain the recovery.
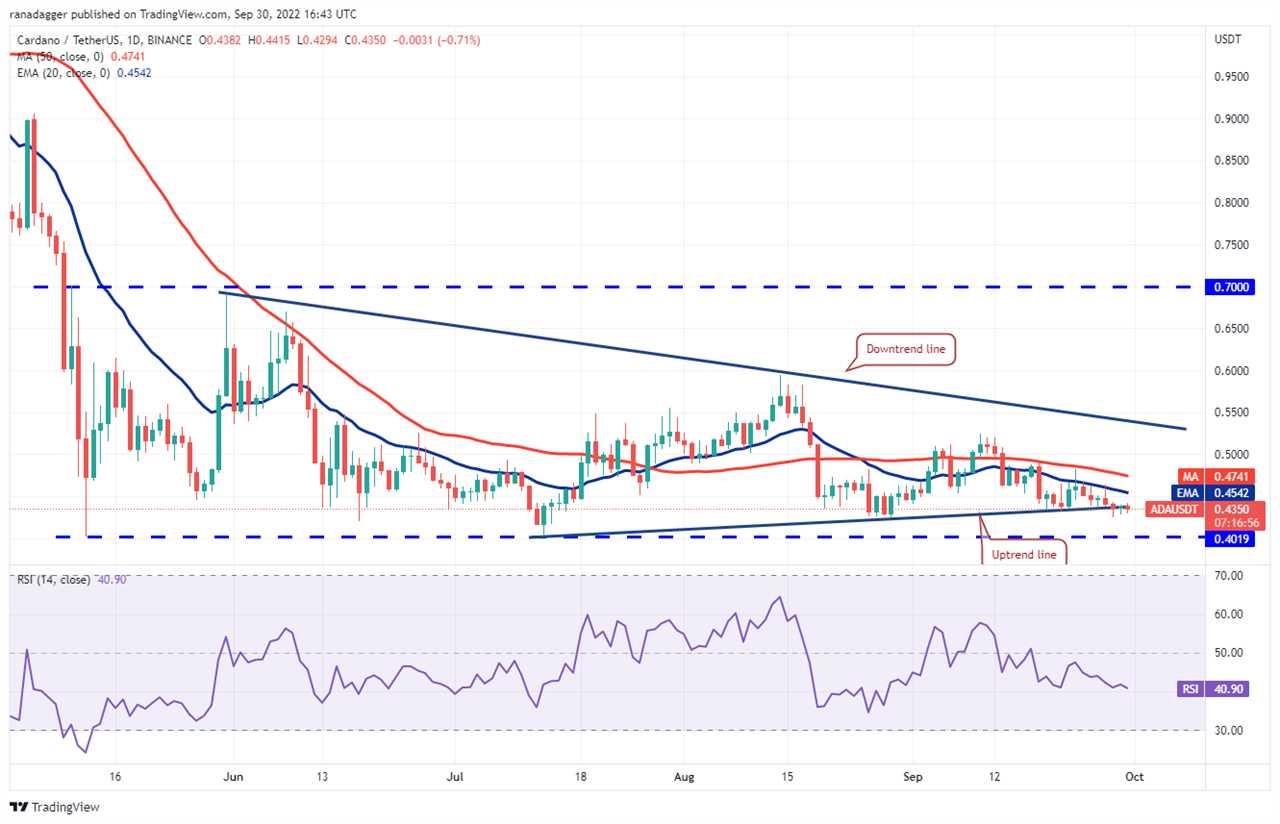
The price has again tumbled below the uptrend line on Sept. 30. The downsloping moving averages and the RSI in the negative territory suggest that the path of least resistance is to the downside. If the price breaks below $0.42, the ADA/USDT pair could decline to the crucial support at $0.40. The bulls are expected to defend this level with vigor.
Contrarily, if the price turns up from the current level and closes above the uptrend line, it will suggest strong buying at lower levels. The bulls will then again try to push the price above the 20-day EMA ($0.45) and challenge the resistance at the 50-day SMA ($0.47).
Related: Bitcoin surges above $20K after 6% BTC rally gains steam ahead of the monthly close
SOL/USDT
Buyers are attempting to form a higher low in Solana (SOL). The price rebounded off $31.65 on Sept. 28 and reached the 50-day SMA ($34.70) on Sept. 30.
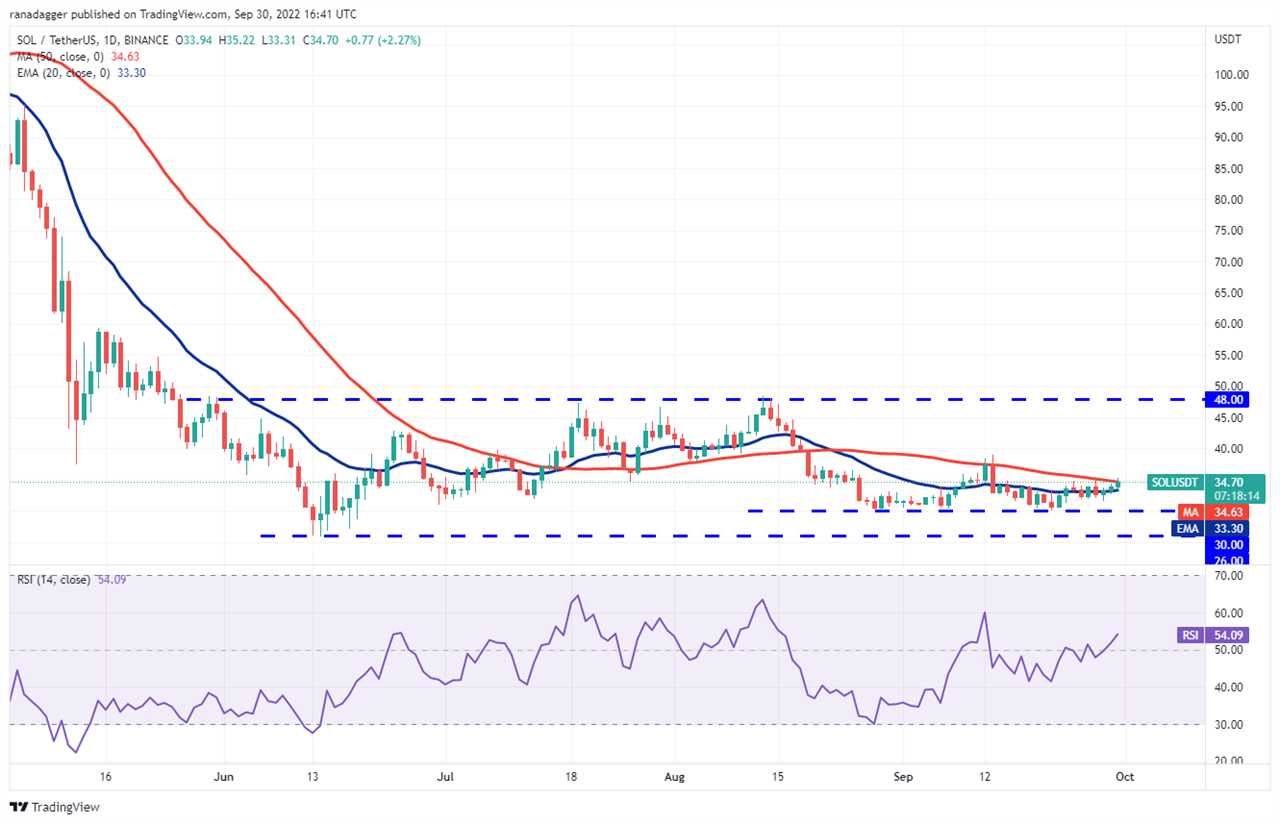
The 20-day EMA ($33.30) is trying to turn up and the RSI is just above the midpoint, suggesting that the bulls are attempting a comeback. If the price breaks and sustains above the 50-day SMA, the bullish momentum could pick up and the SOL/USDT pair could rally to $39. The bears are expected to mount a strong resistance at this level.
Alternatively, if the price turns down from the 50-day SMA, the pair could drop to $31.65. A break below this support could sink the pair to $30.
DOGE/USDT
Dogecoin (DOGE) dipped below the 20-day EMA ($0.06) on Sept. 25 and the bears thwarted attempts by the bulls to resume the recovery on Sept. 27.
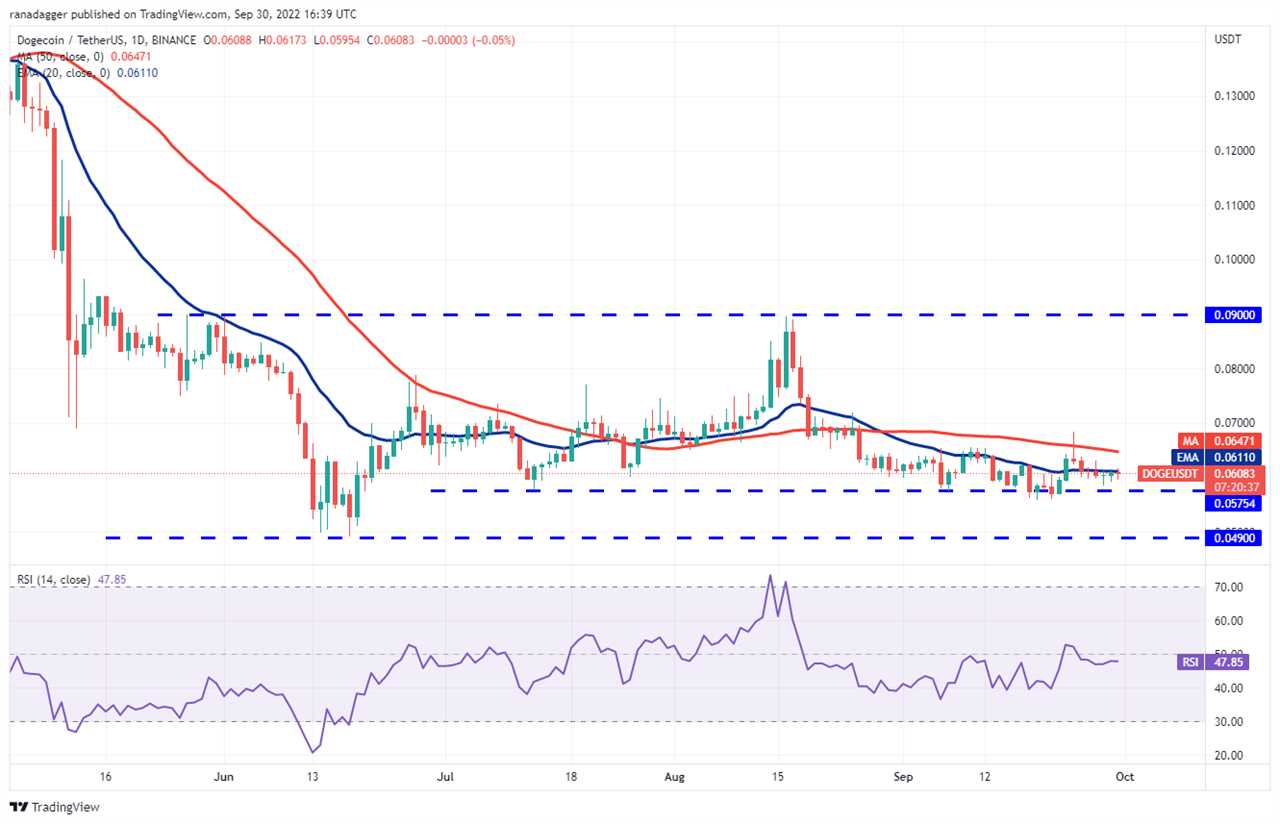
The 20-day EMA is flattish and the RSI is just below the midpoint, indicating a balance between supply and demand. This balance could tilt in favor of the bears if they sink the price below the support near $0.06. The price could then plunge to $0.05.
The bulls will gain the upper hand if they drive and sustain the price above the 50-day SMA ($0.06). The DOGE/USDT pair could then attempt a rally to $0.07 where the bears may again mount a stiff resistance.
DOT/USDT
Polkadot (DOT) has been trading in a tight range between $6 and $6.64 for the past few days. This indicates a tough battle between the bulls and the bears.
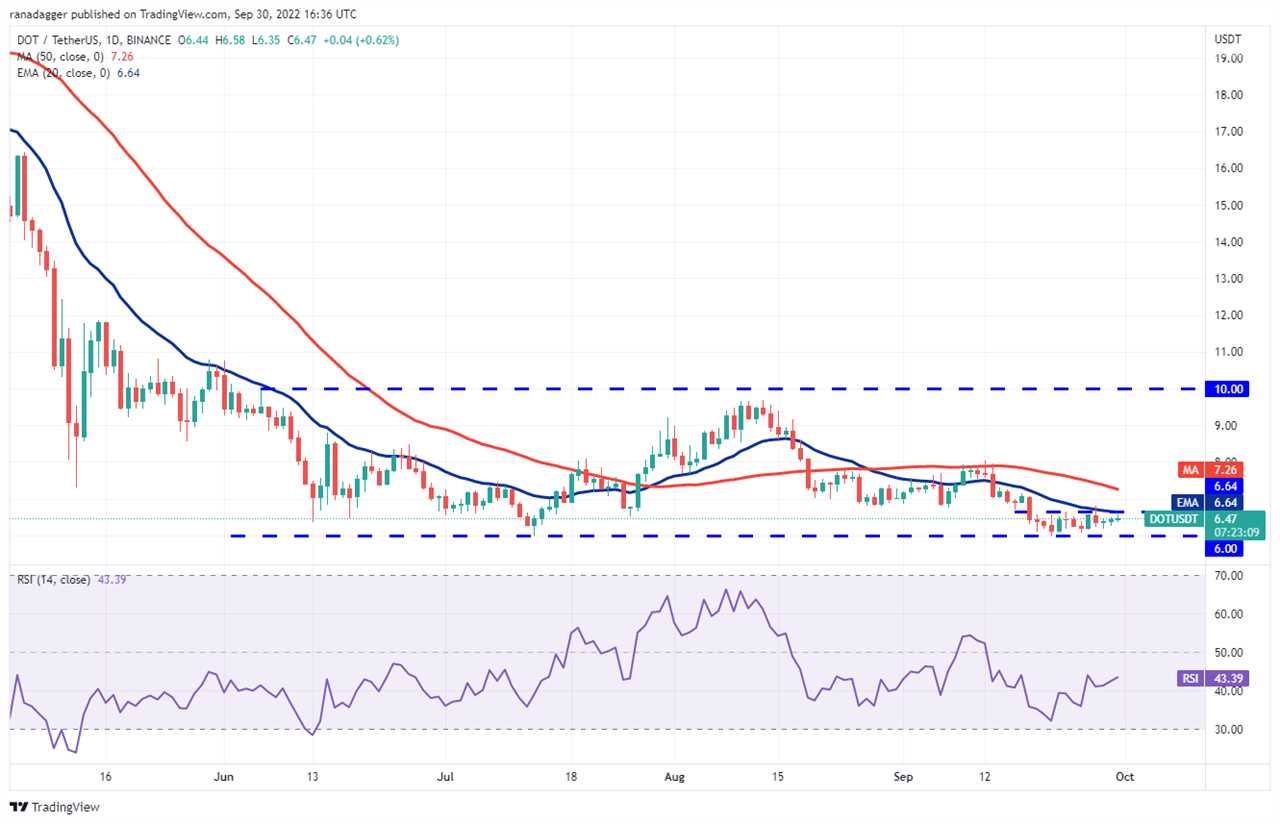
The gradually downsloping moving averages and the RSI in the negative territory suggest that bears have a slight edge. If the price drops below $6, the DOT/USDT pair could start the next leg of the downtrend. The pair could then slide to $4.
To invalidate this negative bias, bulls will have to push and sustain the price above the 20-day EMA ($6.64). If they do that, it will suggest that the consolidation near the support may have been an accumulation phase. The pair could then rise to the 50-day SMA ($7.26) and later to $8.
Market data is provided by HitBTC exchange.
Title: Price analysis 9/30: SPX, DXY, BTC, ETH, BNB, XRP, ADA, SOL, DOGE, DOT
Sourced From: cointelegraph.com/news/price-analysis-9-30-spx-dxy-btc-eth-bnb-xrp-ada-sol-doge-dot
Published Date: Fri, 30 Sep 2022 20:09:59 +0100


