
The United States equities markets and the crypto markets are likely to remain volatile in the near term because traders remain nervous about the size of the next Federal Reserve rate hike on Sept. 20 and Sept. 21. While the majority favors a 75 basis point rate hike, according to the CME FedWatch Tool, some analysts expect the Fed to hike rates by 100 basis points, the first such instance since the early 1980s.
Many expect Bitcoin (BTC) to continue its slide and drop below the June low in the future. Although anything is possible in the markets, many times, the markets do not oblige the majority. If the Fed does not surprise the markets, traders who may be cautious and sitting on the sidelines could jump right back in, resulting in a brief relief recovery.
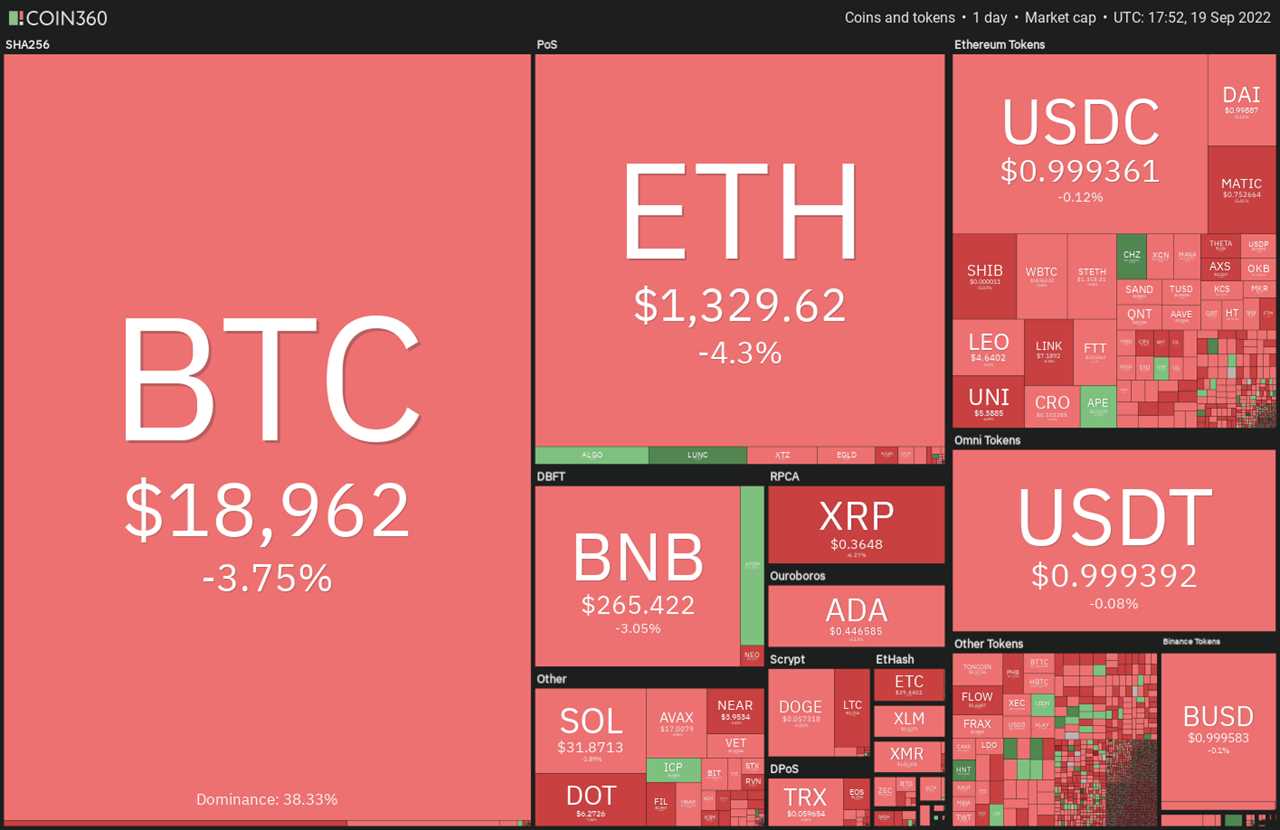
Bear markets offer an opportunity for investors to accumulate for the long term. It is futile to catch the bottom, hence traders may be on the lookout to start accumulating during periods of extreme pessimism. A strong stomach is needed to tide over the volatility but the ones who do that are likely to benefit when the next bull run begins.
Could Bitcoin and altcoins stage a turnaround or is a deeper decline possible? Let’s study the charts of the top-10 cryptocurrencies to find out.
BTC/USDT
Bitcoin has been in a strong downtrend for several months. Buyers started a recovery from the June low at $17,622 and pushed the price above the 200-week simple moving average (SMA) but they could not sustain the higher levels.
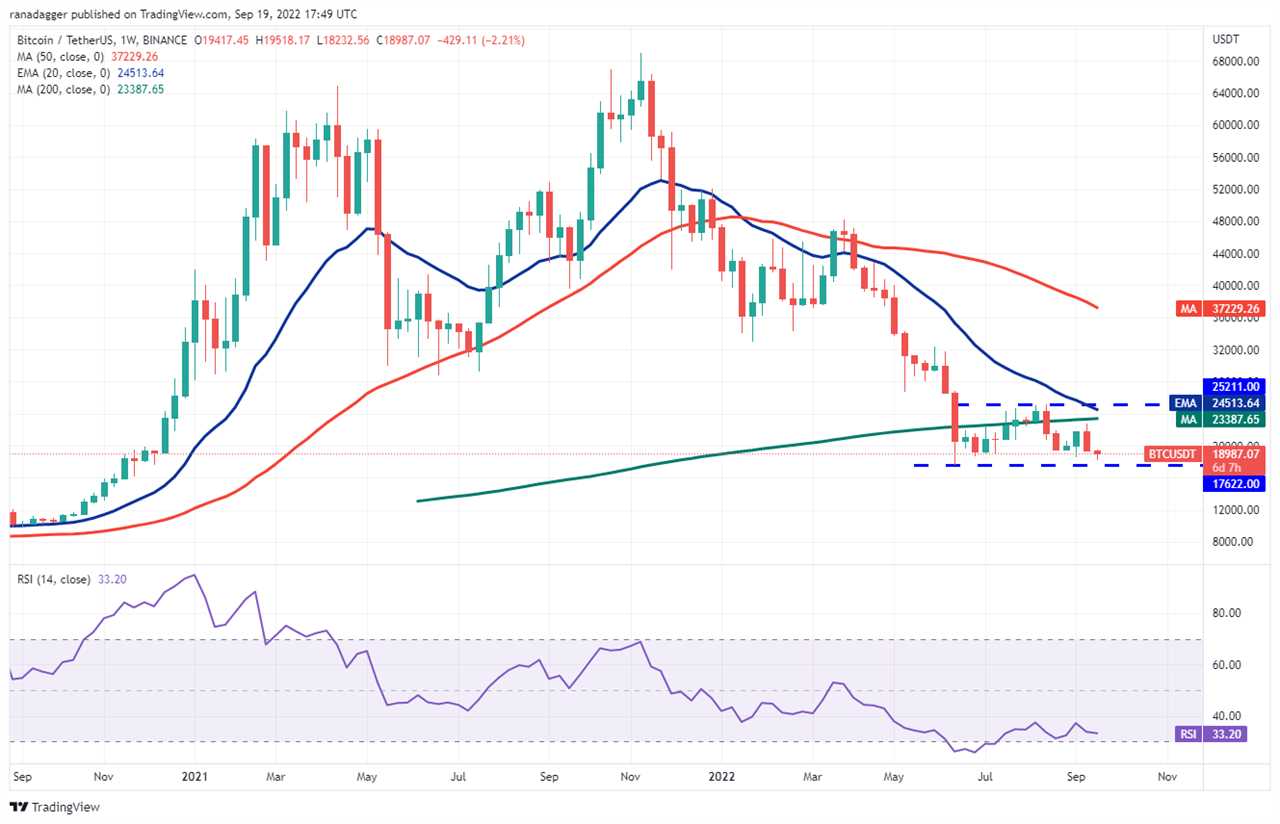
The bulls again tried to push the price above the 200-week SMA last week but the bears held their ground. This shows that bears are defending the 200-week SMA with vigor. Hence, this level becomes a key resistance to watch for on the upside.
On the downside, the bulls are expected to aggressively defend the support at $17,622. The first sign of strength will be a break and close above $20,000. That will suggest a range-bound action for the BTC/USDT pair between $17,622 and $25,211.
A trend change will be signaled after buyers propel the price above $25,211. The pair could then rally to $32,000.
Conversely, if bears sink and sustain the price below $17,622, it could signal the resumption of the downtrend. The pair could then decline to $14,000.
ETH/USDT
The bears have been defending the 20-week exponential moving average ($1,732) for the past few weeks. This suggests that the sentiment in Ether (ETH) remains bearish and traders are selling on rallies.
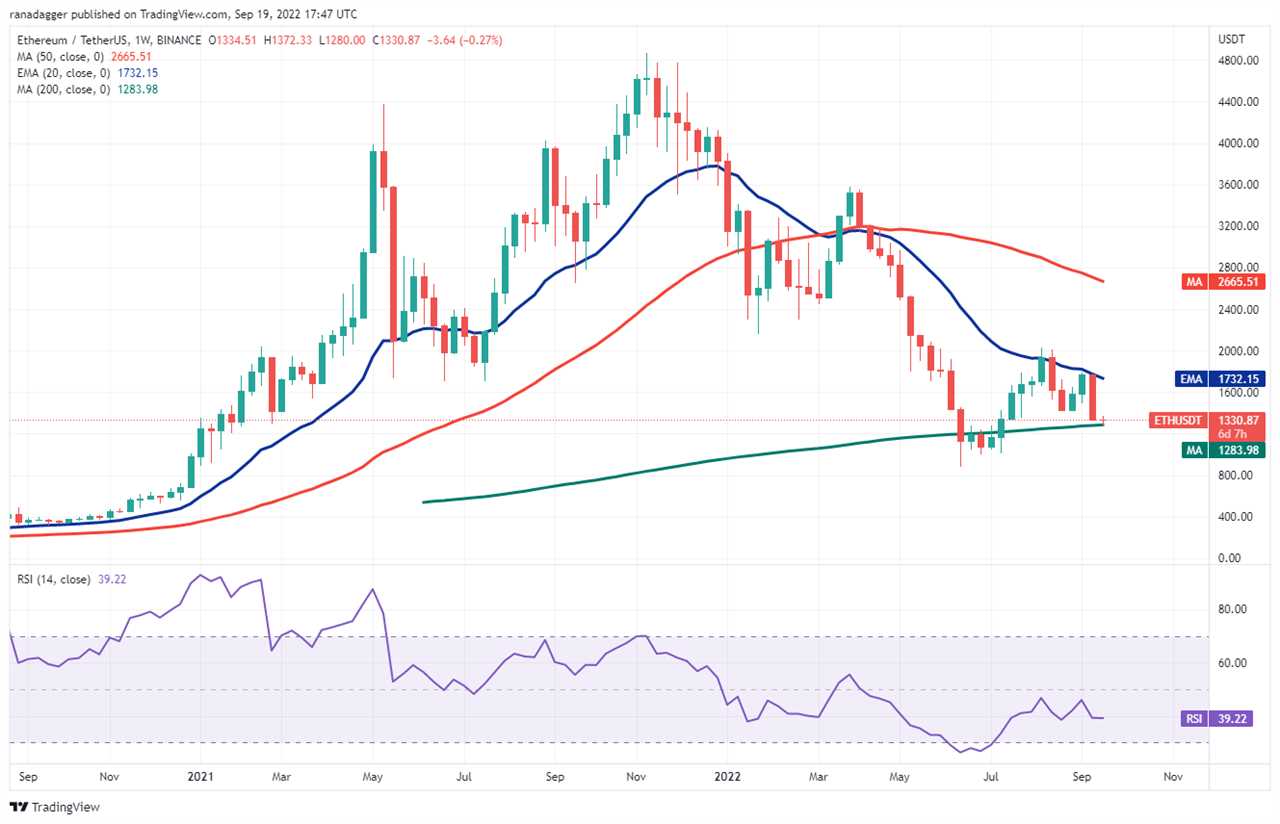
The ETH/USDT pair turned down sharply from the 20-week EMA last week and has reached the 200-week SMA ($1,283). Buyers are expected to defend this level vigorously.
The bulls will have to push and sustain the price above the 20-week EMA to indicate that the bears may be losing their grip. A potential trend change could be signaled on a break above $2,030. Until then, the bears are likely to sell on every rally.
If the price breaks below the 200-week SMA, the selling could intensify and the bears will try to pull the price to the June low of $881. This is an important level for the bulls to defend because a break below it could result in panic selling.
BNB/USDT
BNB is one of the outperformers among the major cryptocurrencies as it is trading well above its 200-week SMA ($175). Buyers pushed the price above the 20-week EMA ($295) but they could not build upon this strength. The bears stalled the recovery at $338 and pulled the price back below the 20-week EMA.
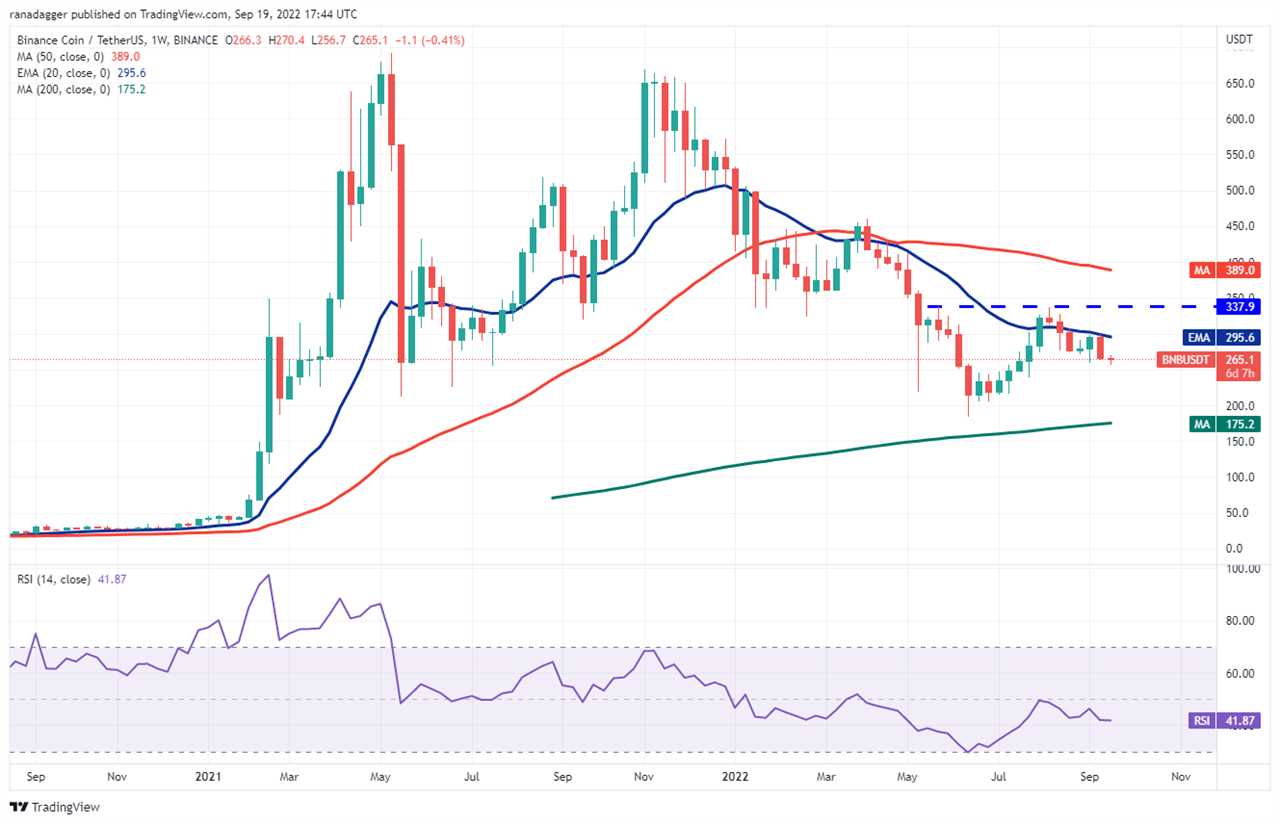
Since then, the bears have thwarted several attempts by the bulls to drive the price back above the 20-week EMA. This indicates that bears are selling the rallies to the 20-week EMA. The bears will attempt to sink the BNB/USDT pair to the 200-week SMA, which is likely to attract strong buying by the bulls.
The first sign of strength will be a break above the 20-week EMA. That could clear the path for a retest of $338. The bulls will have to clear this overhead hurdle to suggest the start of a new up-move.
XRP/USDT
XRP has been consolidating in a downtrend for the past few weeks. Buyers attempted to push the price above the resistance of the range at $0.41 last week but the bears successfully defended the level.
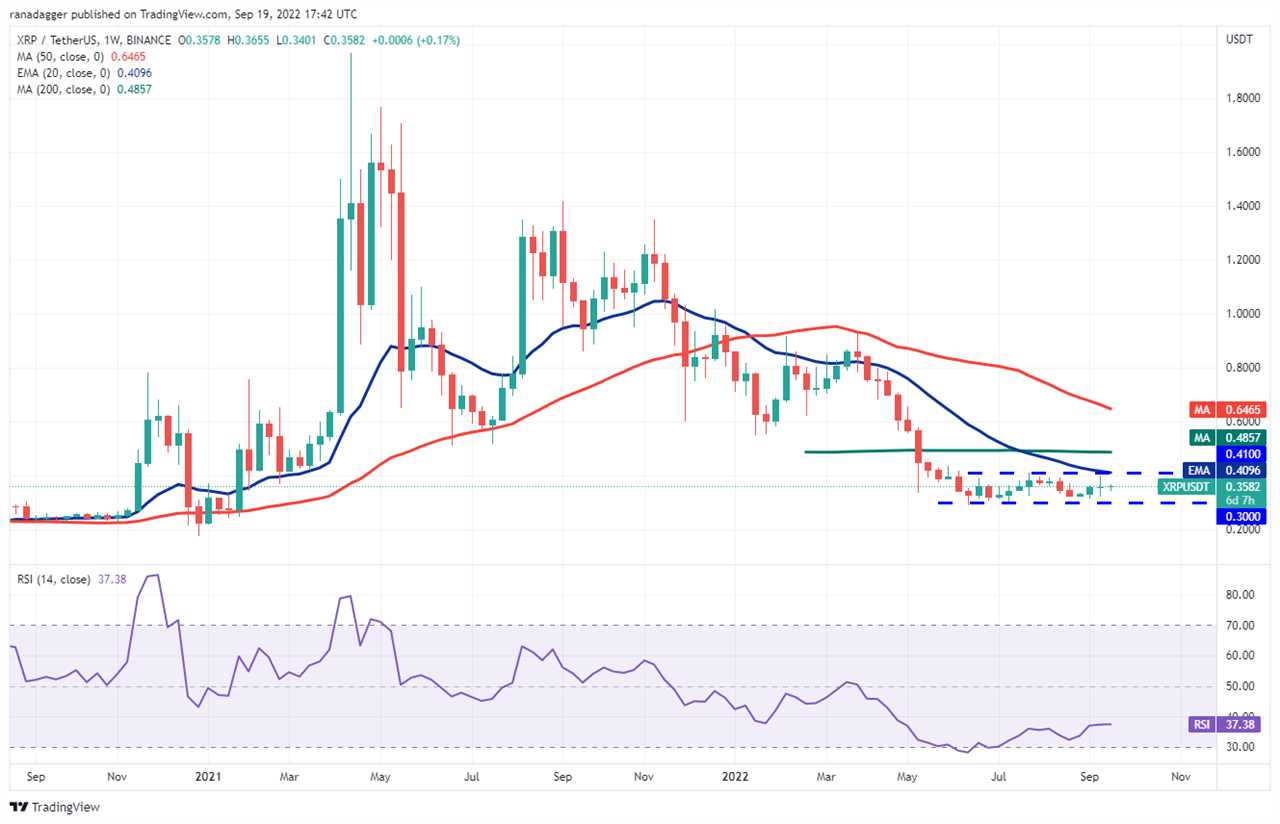
The sellers will try to pull the price to the support at $0.30. This remains the important level to keep an eye on because if bears sink the price below $0.30, the XRP/USDT pair could begin the next leg of the downtrend. The pair could then decline to $0.24 and later to $0.17.
The 20-week EMA is flattening out, indicating that the selling pressure could be weakening. If the price rebounds off $0.30, the pair could extend its stay inside the range for a few more days. Buyers will have to push and sustain the price above the 200-week SMA ($0.48) to indicate that the pair may have bottomed out.
ADA/USDT
Cardano (ADA) has been trading below the moving averages for the past few weeks. Attempts by the bulls to push the price above the 200-week SMA ($0.57) were met with strong selling by the bears.
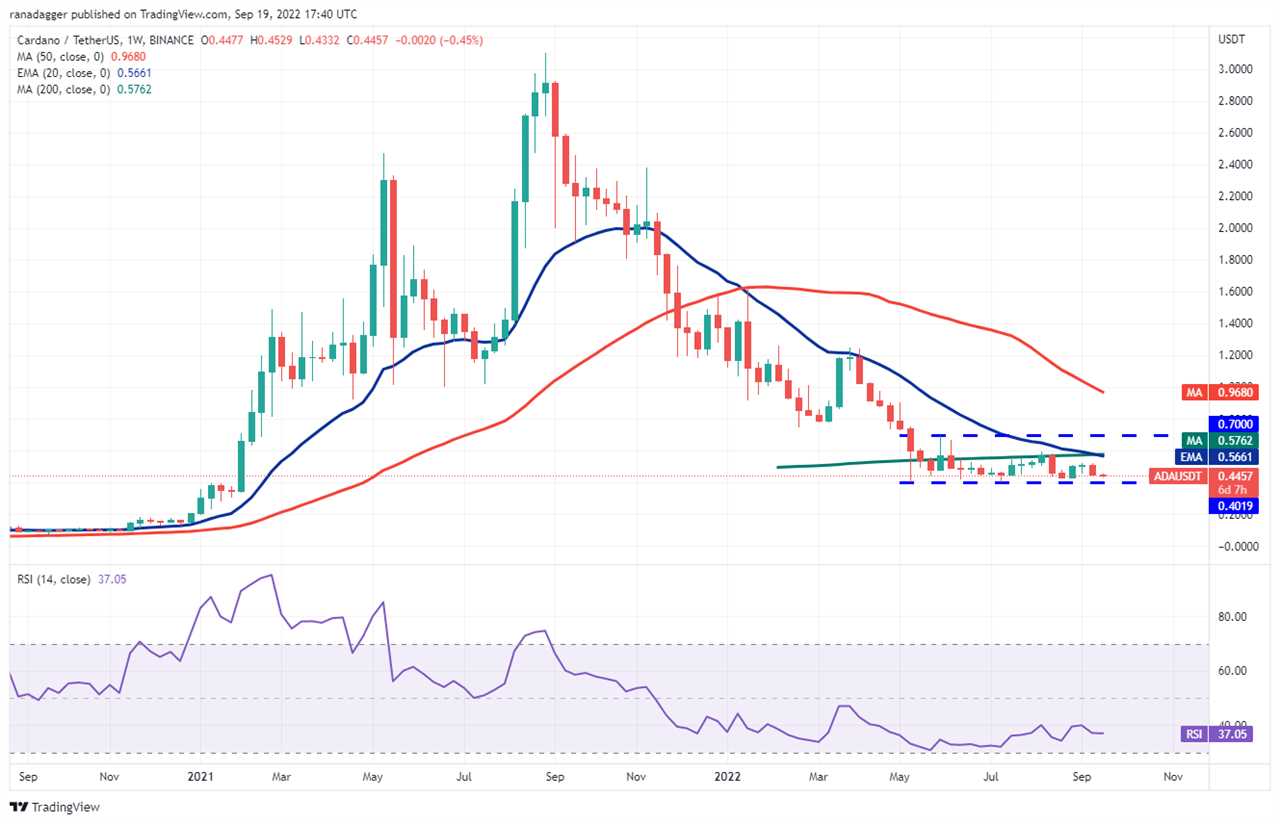
Although the bulls have held the $0.40 support for the past several weeks, the failure to push the price above the 200-week SMA indicates that bears are selling on rallies. The bears will try to sink the price below the support at $0.40. If they succeed, the ADA/USDT pair could resume its downtrend. The next support on the downside is $0.33 and then $0.28.
If bulls want to avert this catastrophe, they will have to quickly push the price above the 200-week SMA. The bears may again attempt to pose a strong challenge at $0.70 but if bulls overcome this barrier, the pair may indicate the start of a new uptrend. The pair could first rise to the 50-week SMA ($0.96) and thereafter to $1.25.
SOL/USDT
Solana (SOL) rallied from the June low of $26 but the recovery fizzled out near $48. The failure of the bulls to push the price to the 20-week EMA ($46) suggests that bears are selling on minor rallies.
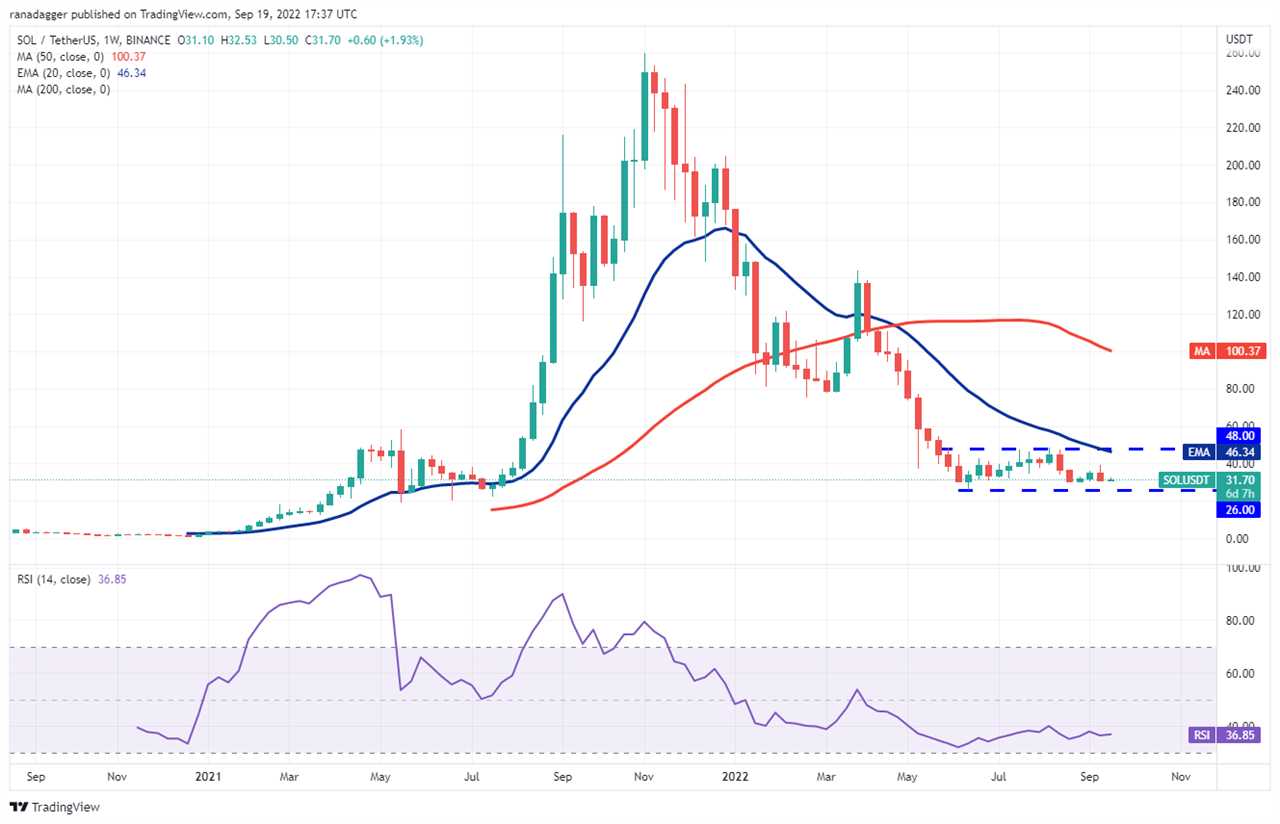
The bears will try to pull the price to the crucial support of $26, which has not been tested since June. If this support cracks, the selling could pick up momentum and the SOL/USDT pair could drop to $20. The bulls are likely to defend this level aggressively.
Alternatively, if the price turns up from the current level or rebounds off $26, the bulls will again try to drive the pair to the overhead resistance at $48. Buyers will have to clear this obstacle to indicate the start of a new uptrend. The pair could then attempt a rally to $78.
DOGE/USDT
Dogecoin (DOGE) recovered from $0.05 in June and reached the 20-week EMA ($0.08) in August but the bulls could not push the price above this resistance. The bears aggressively defended the level and are trying to sink the price back to $0.05.
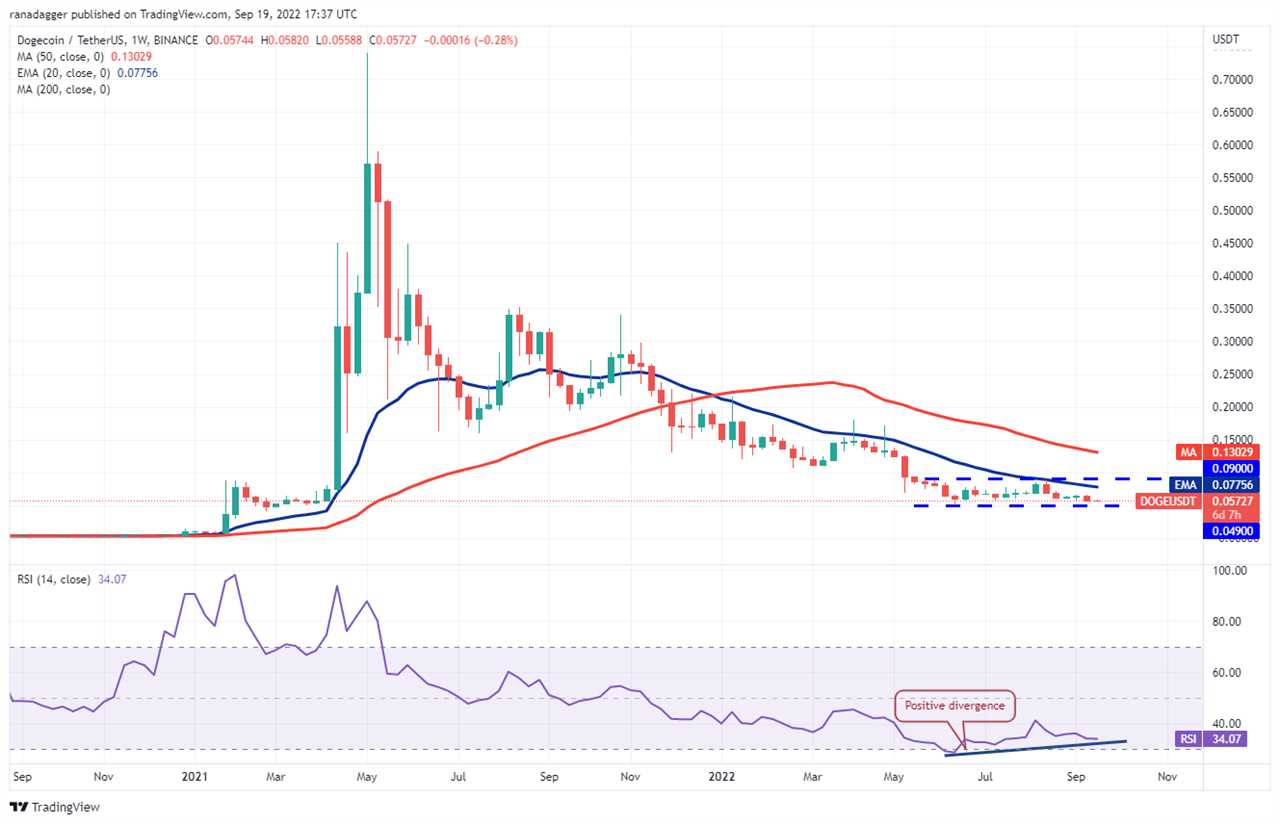
If the $0.05 support gives way, the DOGE/USDT pair could resume its downtrend. The next support on the downside is at $0.04 but if bulls fail to defend this level, the selling could intensify and the pair could collapse below $0.01.
There is a small ray of hope for the bulls because the RSI is attempting to form a positive divergence. This suggests that the selling pressure could be reducing. If the price rebounds off $0.05, the bulls will again try to propel the pair above $0.09. If that happens, the pair could rise to the 50-week SMA ($0.13).
Related: XRP price risks 30% decline despite Ripple's legal win prospects
DOT/USDT
Polkadot (DOT) has been consolidating between $6 and $10 for the past few weeks. Usually in a range, traders buy the dips to the support and sell near the overhead resistance.
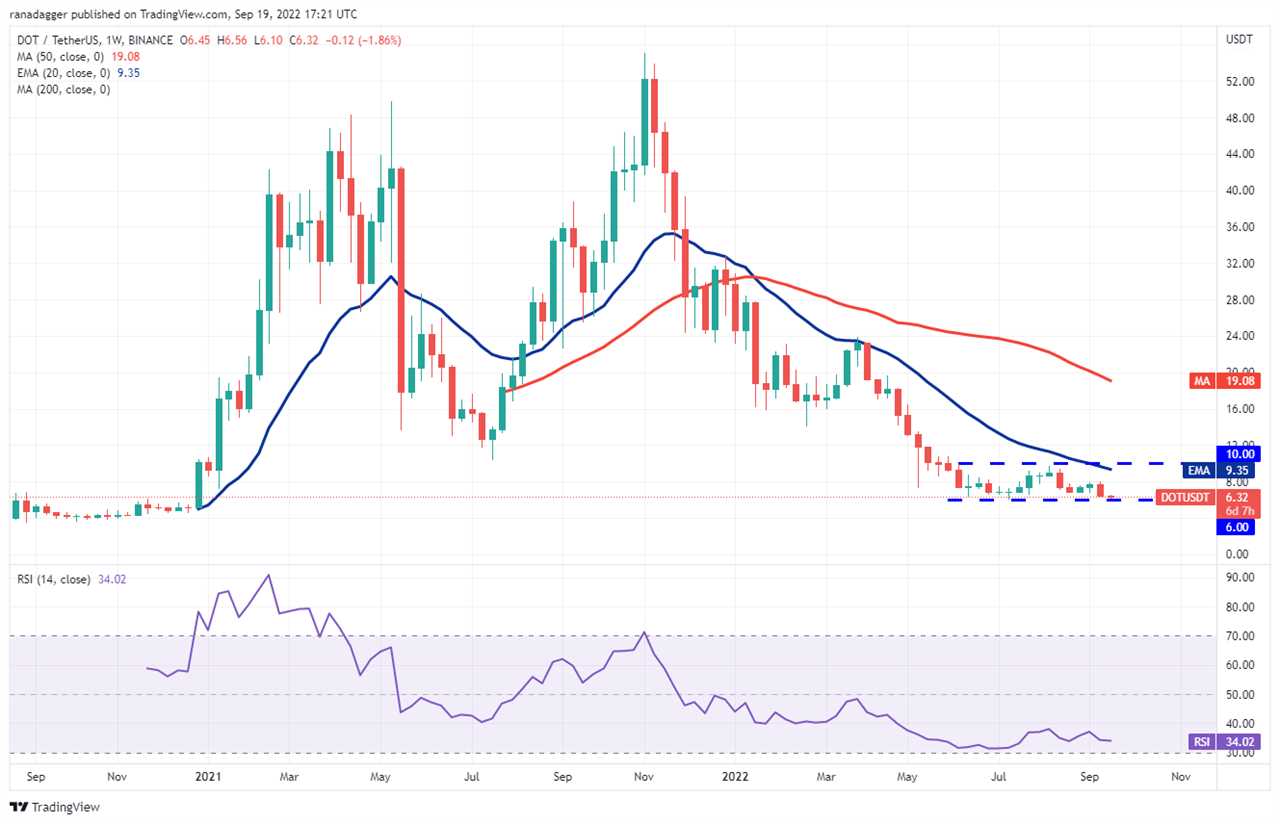
If the price rebounds off the $6 support with strength, it will suggest that buyers are accumulating on dips. That could keep the DOT/USDT pair stuck inside the range for some more time. The longer the price trades inside a range, the stronger will be the eventual breakout from it.
If buyers propel the price above $10, it will suggest that the downtrend could be ending. That could clear the path for a possible rally to the 50-week SMA ($19).
Contrarily, if the price slips below the $6 support, the pair could start the next leg of the downtrend. The pair could then drop to the $3.50 to $4 support zone.
MATIC/USDT
Polygon (MATIC) moved up sharply from $0.31 in June and broke above the 20-week EMA ($0.87) but the buyers could not extend the recovery. The bears stalled the relief rally at $1.05 and pulled the price back below the 20-week EMA.
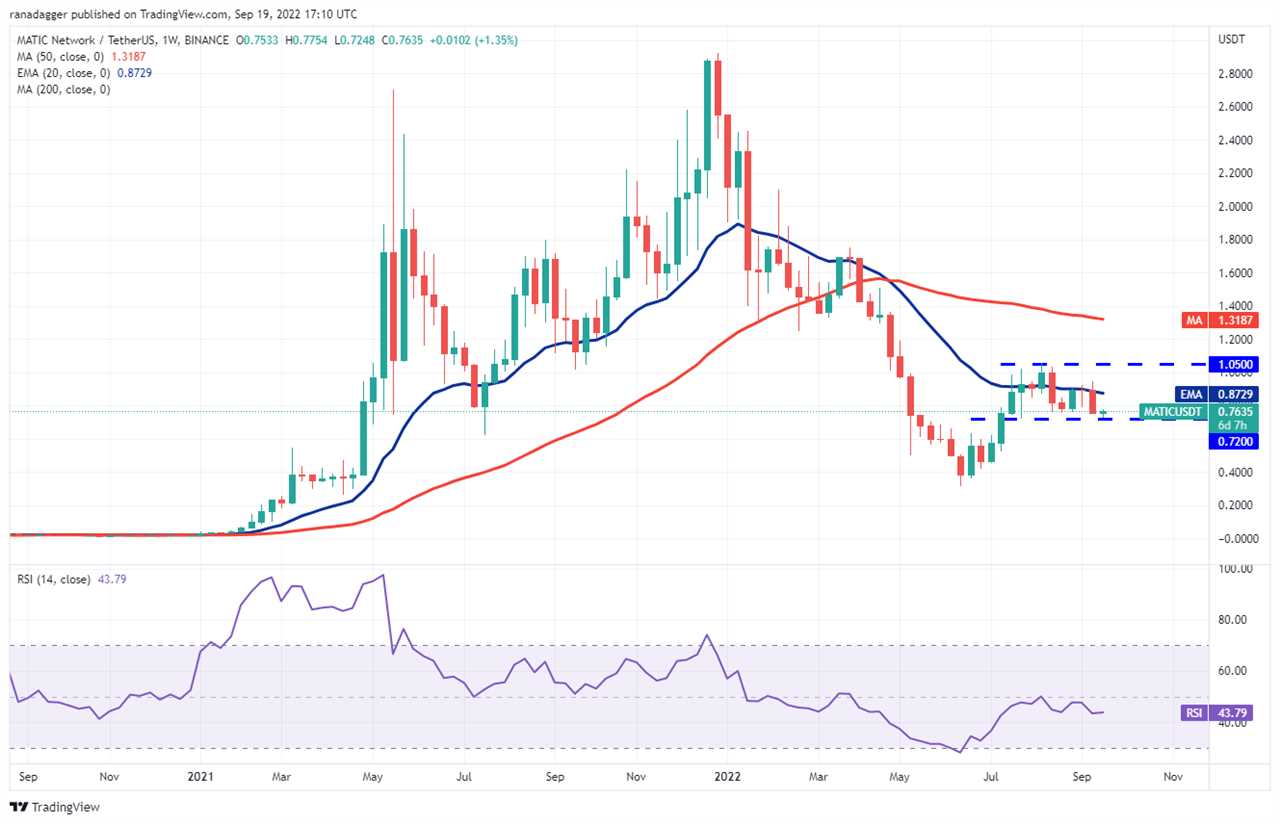
The bulls again tried to thrust and sustain the price above the 20-week EMA last week but the bears did not relent. They sold aggressively and have pulled the price to the immediate support of $0.72. If this support breaks down, the MATIC/USDT pair could slide to $0.45 and then to $0.31.
On the contrary, if the price rises from the current level and breaks above the 20-week EMA, the pair could challenge the overhead resistance at $1.05. A break and close above this level will suggest that the downtrend may be over. The price could then rally to the 50-week SMA ($1.31) and after that to $1.75.
SHIB/USDT
Shiba Inu (SHIB) rallied sharply from its June low and rose above the 20-week EMA ($0.000013) in August. However, the breakout proved to be a bear trap as the price turned down from $0.000018 and slipped back below the 20-week EMA.
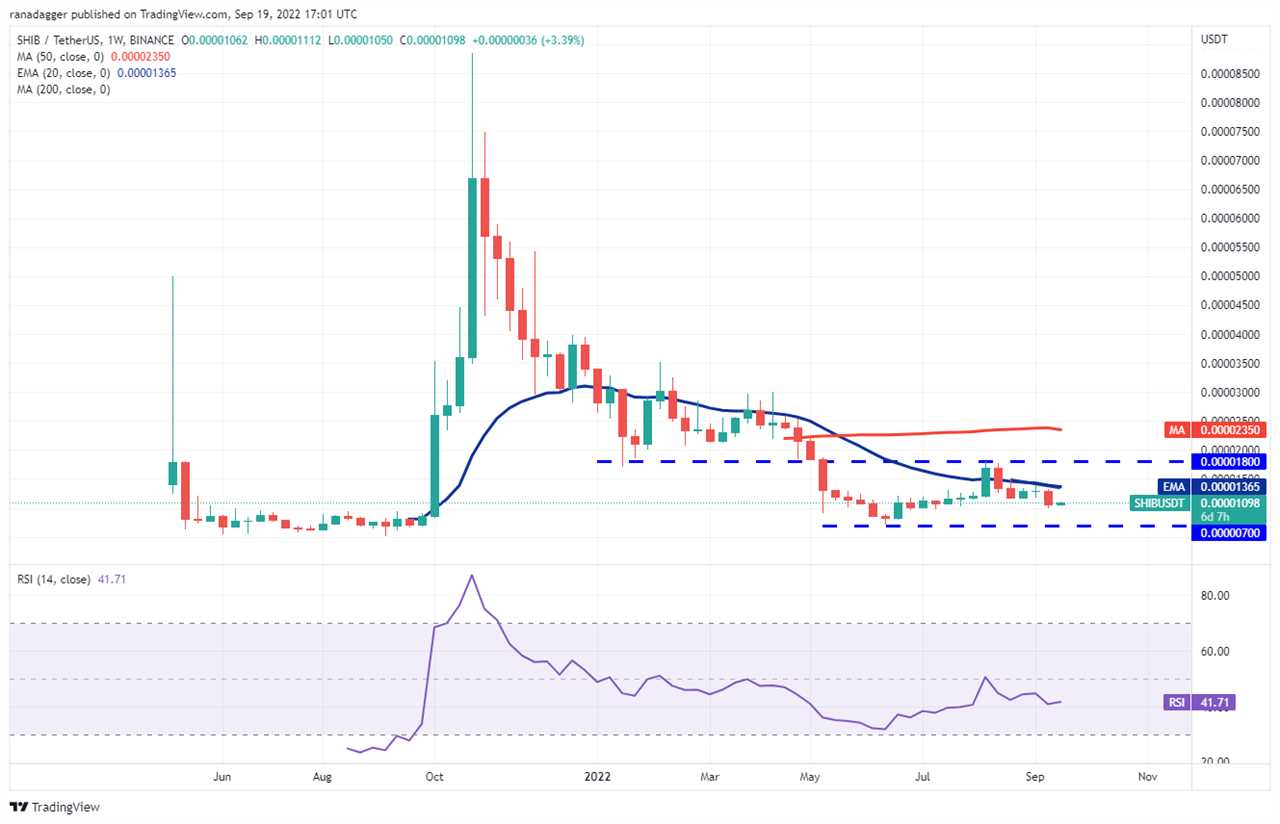
Even though the price has been trading below the 20-week EMA, the bulls have not allowed the SHIB/USDT pair to retest the June low at $0.000007. This indicates that buyers are attempting to form a higher low.
The first sign of strength will be a break and close above the 20-week EMA. The pair could then rally to $0.000018. If bulls drive the price above this resistance, it will suggest a potential trend change. The pair could then surge to $0.000030.
This positive view could invalidate if the price continues lower and breaks below $0.000007. That could sink the pair to $0.000005.
Market data is provided by HitBTC exchange.
Title: Price analysis 9/19: BTC, ETH, BNB, XRP, ADA, SOL, DOGE, DOT, MATIC, SHIB
Sourced From: cointelegraph.com/news/price-analysis-9-19-btc-eth-bnb-xrp-ada-sol-doge-dot-matic-shib
Published Date: Mon, 19 Sep 2022 19:50:57 +0100