
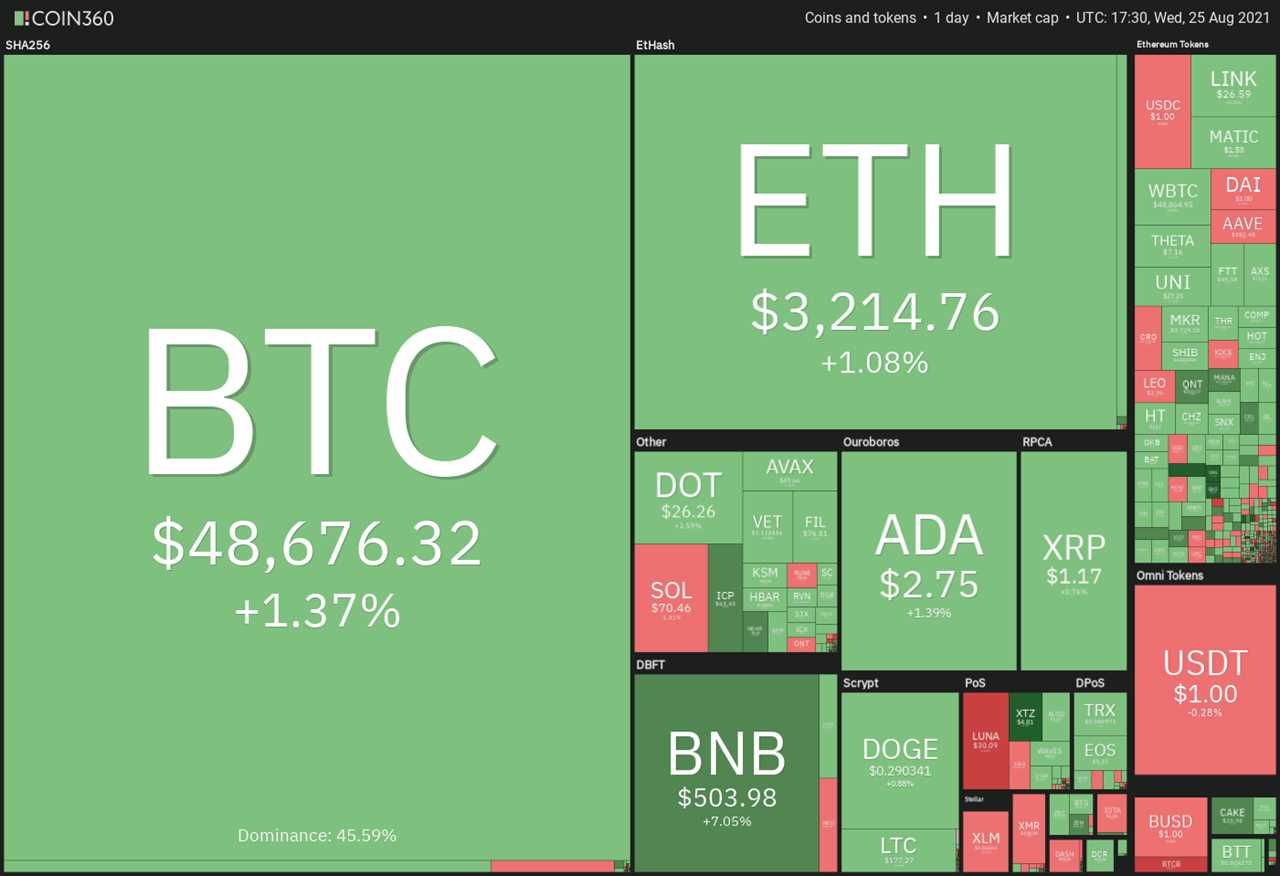
Bitcoin (BTC) remains on a strong footing after bears failed to capitalize on the rejection near the psychological mark at $50,000.
The recent price rise in Bitcoin has not enticed longer-term investors to part with their holdings and Glassnode data shows that the Bitcoin supply held by long-term holders has hit a new all-time high of 12.69 million BTC. This tops the previous record achieved in October 2020.
MicroStrategy’s recent Form 8-K filing with the United States Securities and Exchange Commission shows that the company bolstered its Bitcoin holdings by 3,907 BTC between July 1 and Aug. 23. The company bought at an average price of $45,294. This brings MicroStrategy's total holdings to 108,992 BTC with an average price of $26,769.
However, not everyone is bullish in the short term. John Bollinger, the creator of the popular technical analysis Bollinger Bands indicator, sounded a note of caution to traders and suggested that they “take some profits or hedge a bit.” He said there was no confirmation of a fall yet, but if it happened, hodlers could use the lower levels to buy more.
After today's minor correction, could Bitcoin and altcoins resume their up-move? Let’s analyze the charts of the top-10 cryptocurrencies to find out.
BTC/USDT
Bitcoin broke above the psychological barrier at $50,000 on Aug. 23, but the long wick on the day’s candlestick showed profit-booking at higher levels. The selling continued on Aug. 24 and today, which pulled the price down to the support line of the rising wedge pattern.
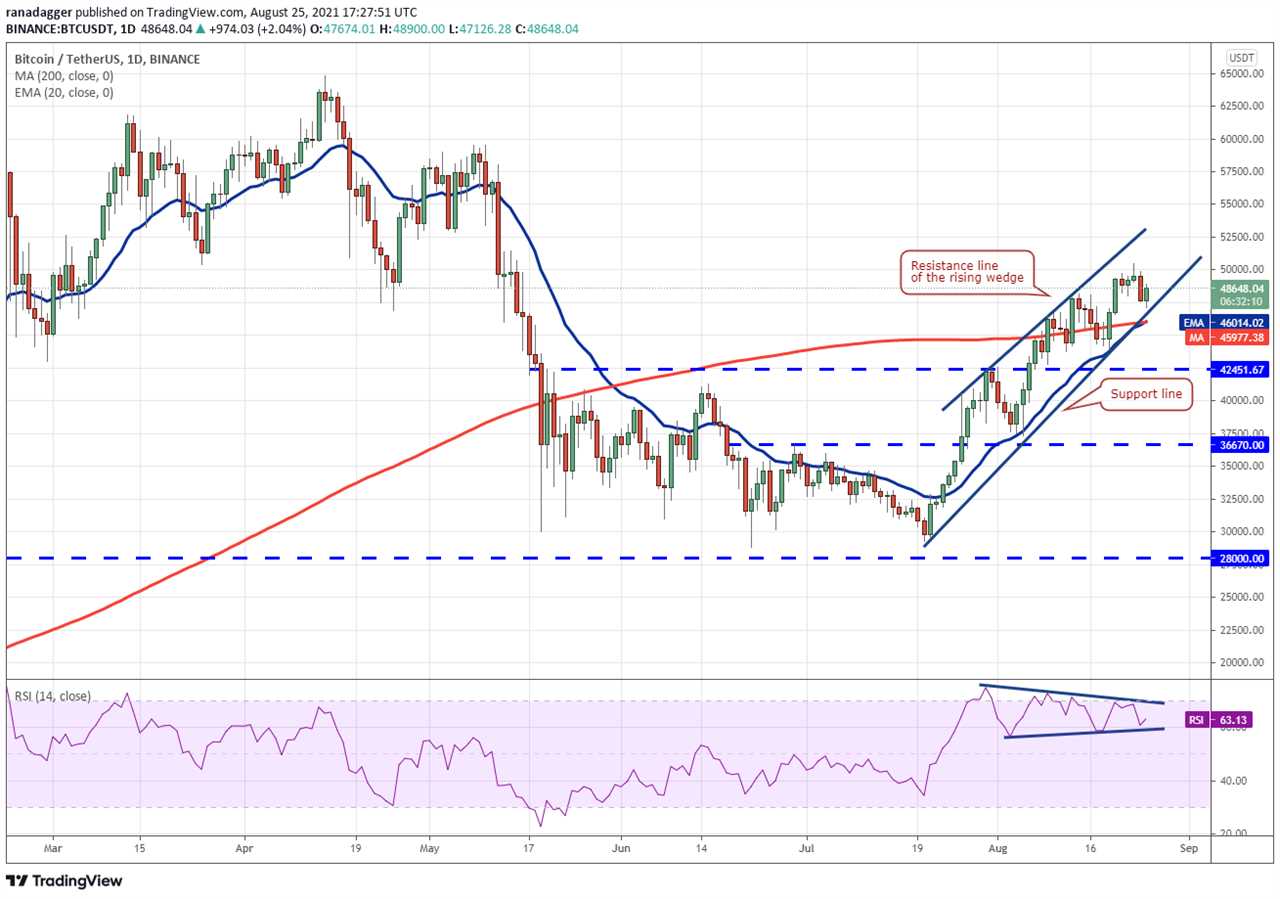
The bulls are currently defending the support line. If the rebound sustains, the bulls will have another go at the overhead resistance zone of $50,000 to $50,500. If they clear this hurdle, the BTC/USDT pair may rally to the resistance line of the wedge.
A breakout and close above the wedge will suggest strength and could attract further buying. That may clear the path for a rally to $60,000. The rising 20-day exponential moving average (EMA) ($46,014) and the relative strength index (RSI) in the positive zone indicate an advantage to buyers.
This positive view will invalidate if bears sink the price below the 200-day simple moving average ($45,977). That may result in a decline to $42,451.67.
ETH/USDT
The bulls pushed Ether (ETH) above the overhead resistance at $3,335 on Aug. 23 and Aug. 24, but they could not sustain the higher levels. This suggests that bears are defending the level aggressively.
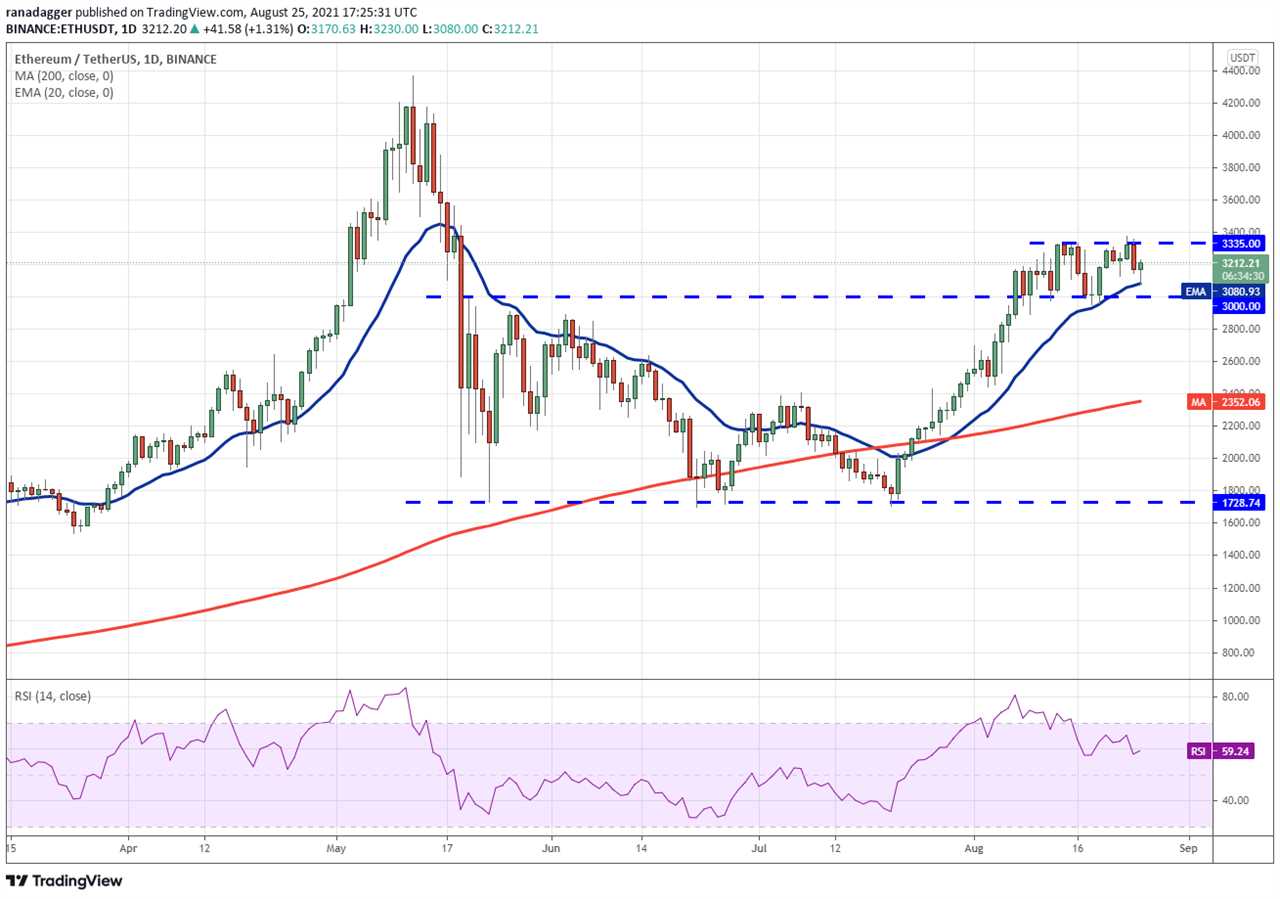
The ETH/USDT pair dropped to the 20-day EMA ($3,080) today, but the long tail on the candlestick shows buying at lower levels. If the price sustains above the 20-day EMA, the buyers will take another shot at pushing the pair above $3,335.
If they can pull it off, the pair may resume its uptrend, which could reach $3,670 and then $4,000. On the contrary, if the price again turns down from $3,335, a few days of consolidation is possible. The first sign of weakness will be a break and a close below $3,000. If bears sustain the price below this level, the pair could drop to the 200-day SMA ($2,352).
ADA/USDT
Cardano (ADA) witnessed profit-booking near the psychological level at $3 on Aug. 24, but a positive sign is that bulls are not giving up much ground. The long tail on Aug. 24 and today’s candlestick suggests accumulation at lower levels.
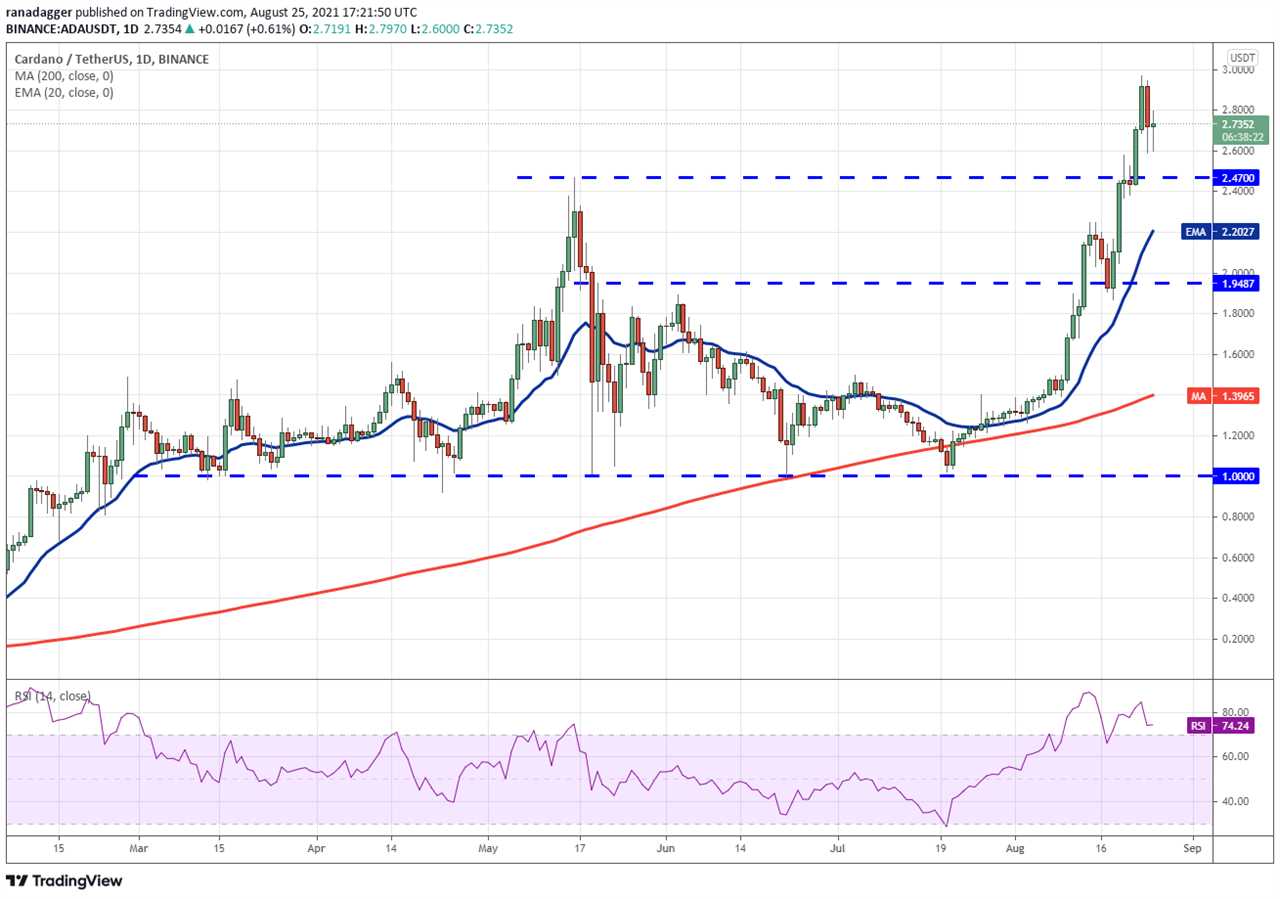
If the price rebounds off the current level or the breakout level at $2.47, it will indicate that the sentiment remains positive and bulls are buying on dips. The bulls will then try to resume the uptrend by pushing the price above $3. If they manage to do that, the ADA/USDT pair may rise to $3.50.
On the other hand, if the price once again turns down from the overhead resistance, the pair may consolidate between $3 and $2.47 for a few days. A break and close below $2.47 could pull the price down to the 20-day EMA ($2.20). The bears will have to sink the price below this support to gain the upper hand.
BNB/USDT
After the strong up-move on Aug. 23, Binance Coin (BNB) made an inside-day candlestick pattern on Aug. 24. This suggests indecision among the bulls and the bears. Currently, the buyers are attempting to resolve the uncertainty in their favor.
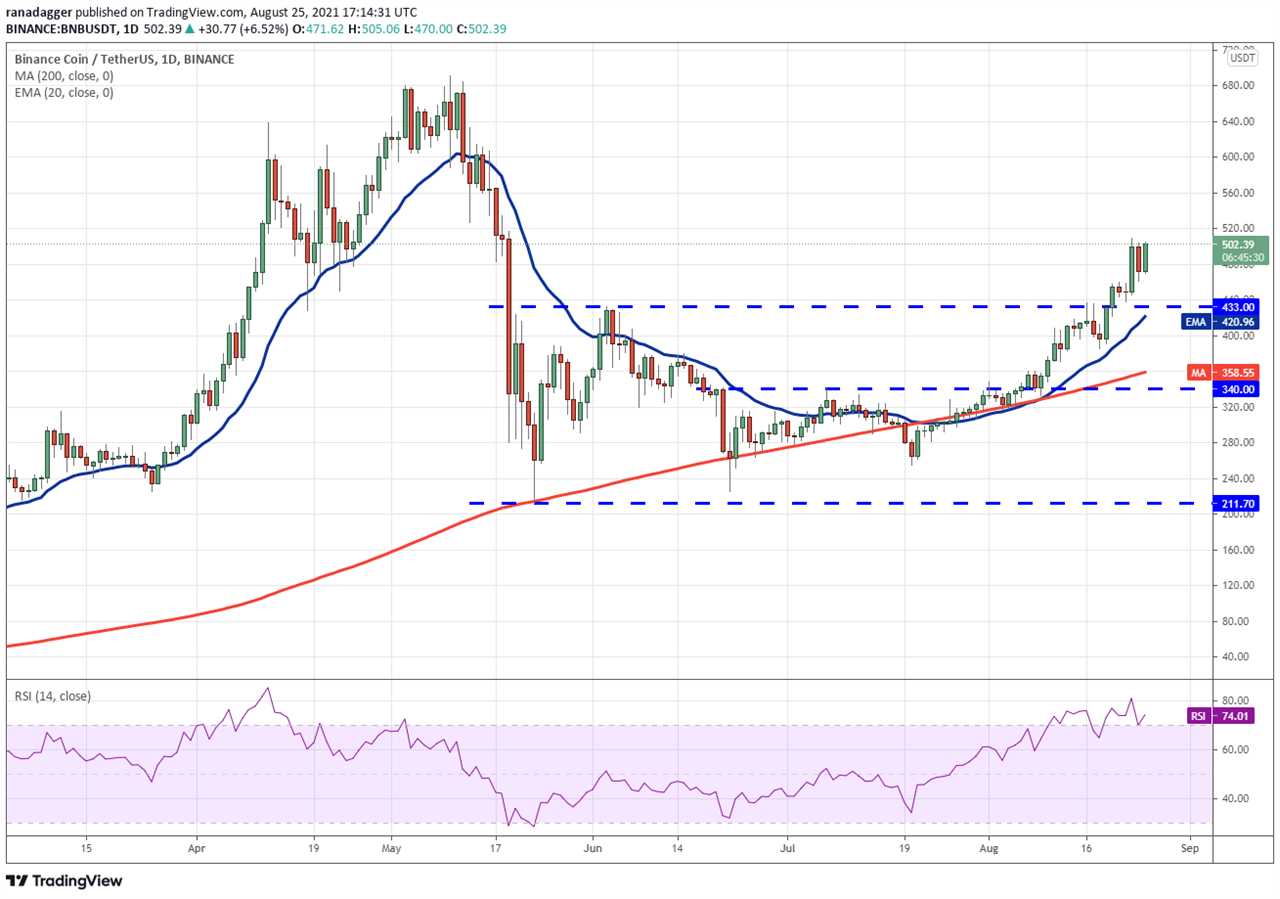
If bulls push and sustain the price above $509.72, the BNB/USDT pair could start its northward journey toward $600. The rising 20-day EMA ($420) and the RSI in the overbought zone suggest that buyers have the upper hand.
Contrary to this assumption, if the price turns down from $509.72, the pair may drop to the breakout level at $433 and consolidate between these two levels for a few days. A break and close below the 20-day EMA could result in a decline to $385.47 and then to the 200-day SMA ($358).
XRP/USDT
The long wick on XRP’s Aug. 23 candlestick shows that bears are attempting to stall the recovery in the $1.30 to $1.35 zone. This may have led to profit-booking from short-term traders, resulting in a drop to the 20-day EMA ($1.08).
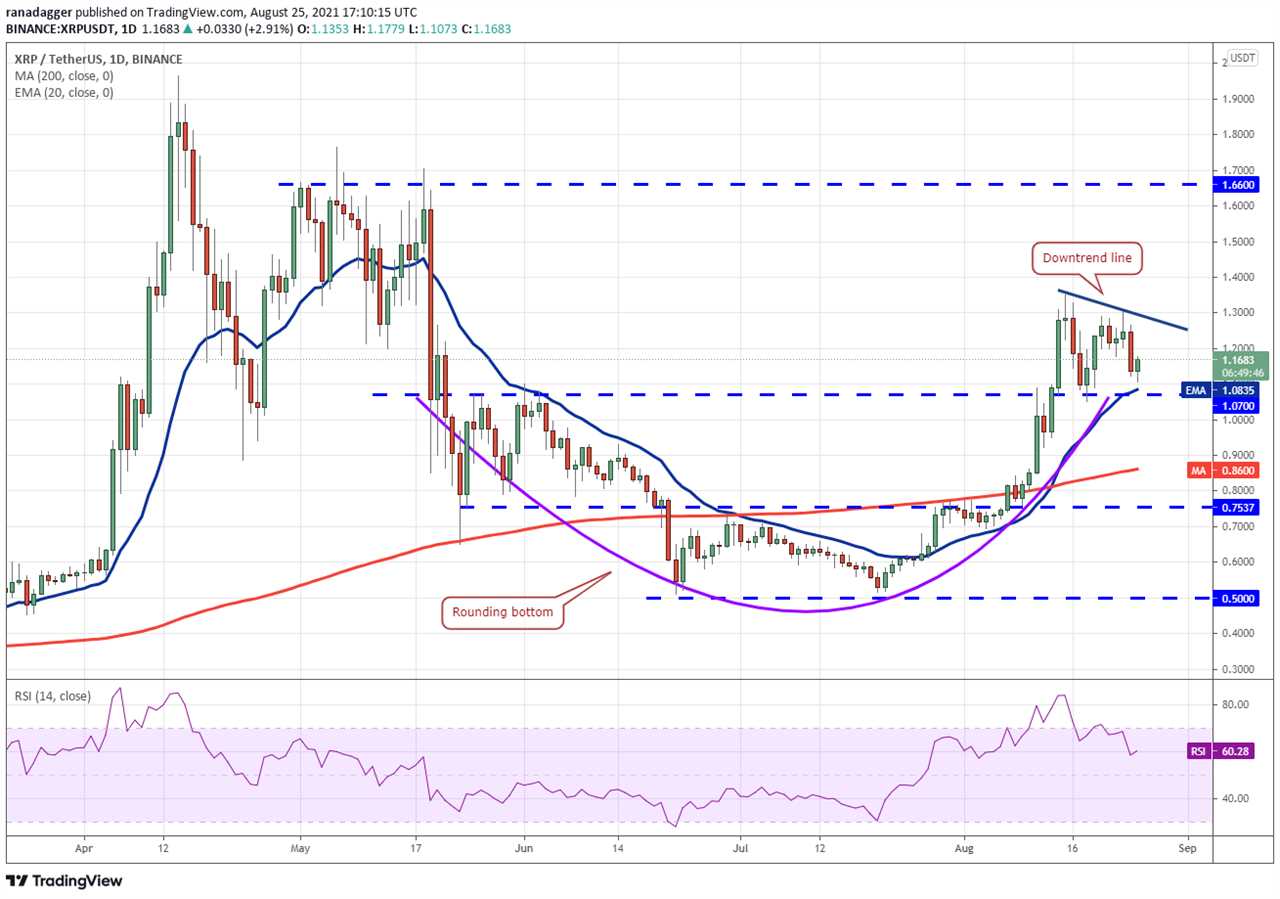
The bulls are likely to defend the breakout level at $1.07 aggressively. If the price rebounds off this support, the XRP/USDT pair could rise to the downtrend line and above it to $1.35. A breakout and close above this resistance will signal the resumption of the uptrend.
Contrary to this assumption, if the bears sink the price below $1.07, the pair could drop to the 200-day SMA ($0.86). Such a move will suggest that the bullish momentum has weakened and the pair may trade in a range for a few days.
DOGE/USDT
Dogecoin (DOGE) turned down from the downtrend line on Aug. 24 and dropped to the 20-day EMA ($0.28). Although bulls have defended the support, the failure to achieve a strong rebound suggests a lack of aggressive buying.
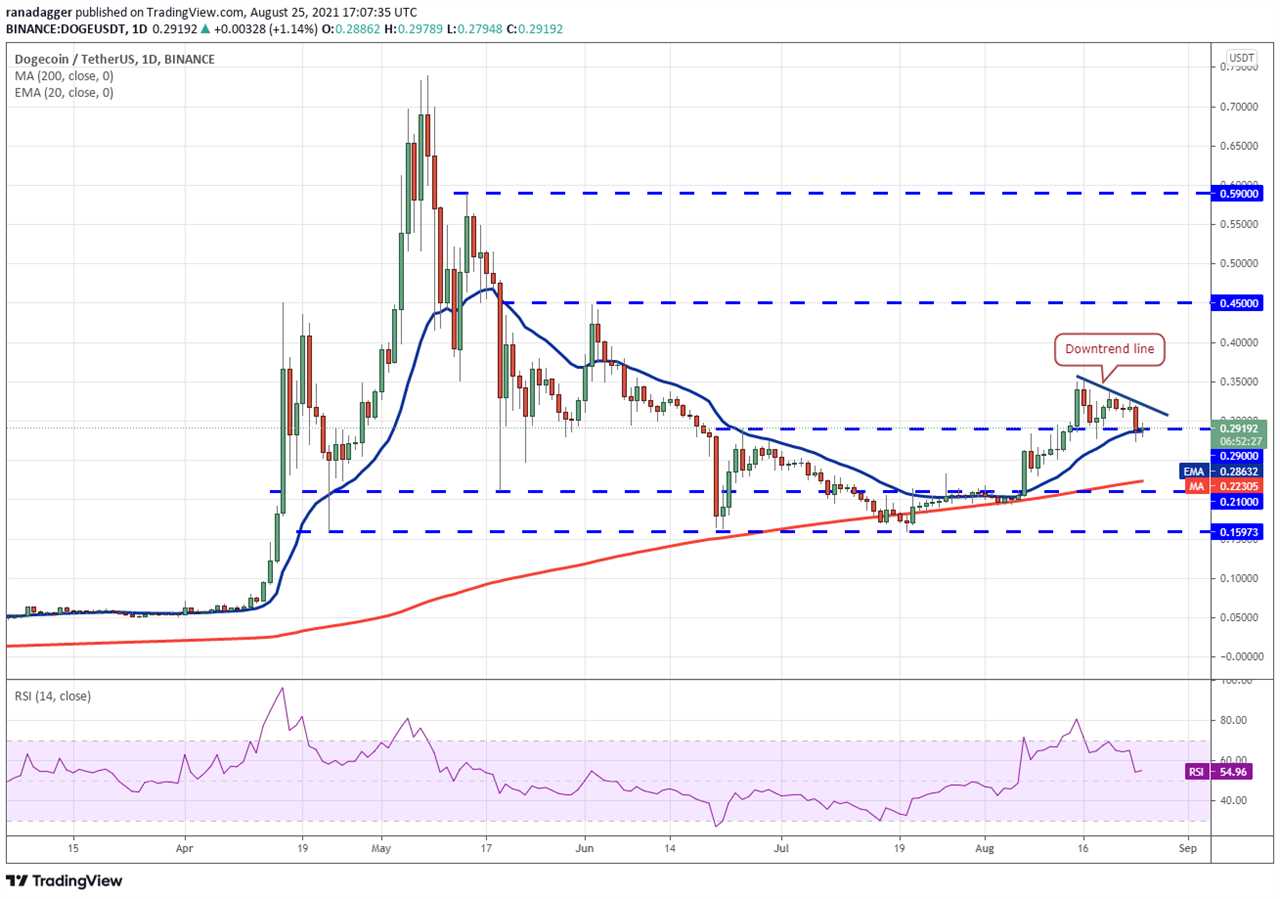
If bears sink the price below the 20-day EMA, the DOGE/USDT pair could drop to the next support at $0.21. Such a move will suggest that the recent breakout above $0.29 was a bull trap. The pair could then remain range-bound between $0.21 and $0.29 for a few days.
The flattening 20-day EMA and the RSI just above the midpoint also suggest a consolidation in the short term. Conversely, if the price turns up from the current level and rises above the downtrend line, the pair may rally to $0.35. A breakout and close above this resistance could open the gates for an up-move to $0.45.
DOT/USDT
The failure of the bulls to push Polkadot (DOT) above the overhead resistance at $28.60 for the past few days attracted profit-booking on Aug. 24. The price dropped close to the 20-day EMA ($23.84), but the buyers are attempting a rebound.
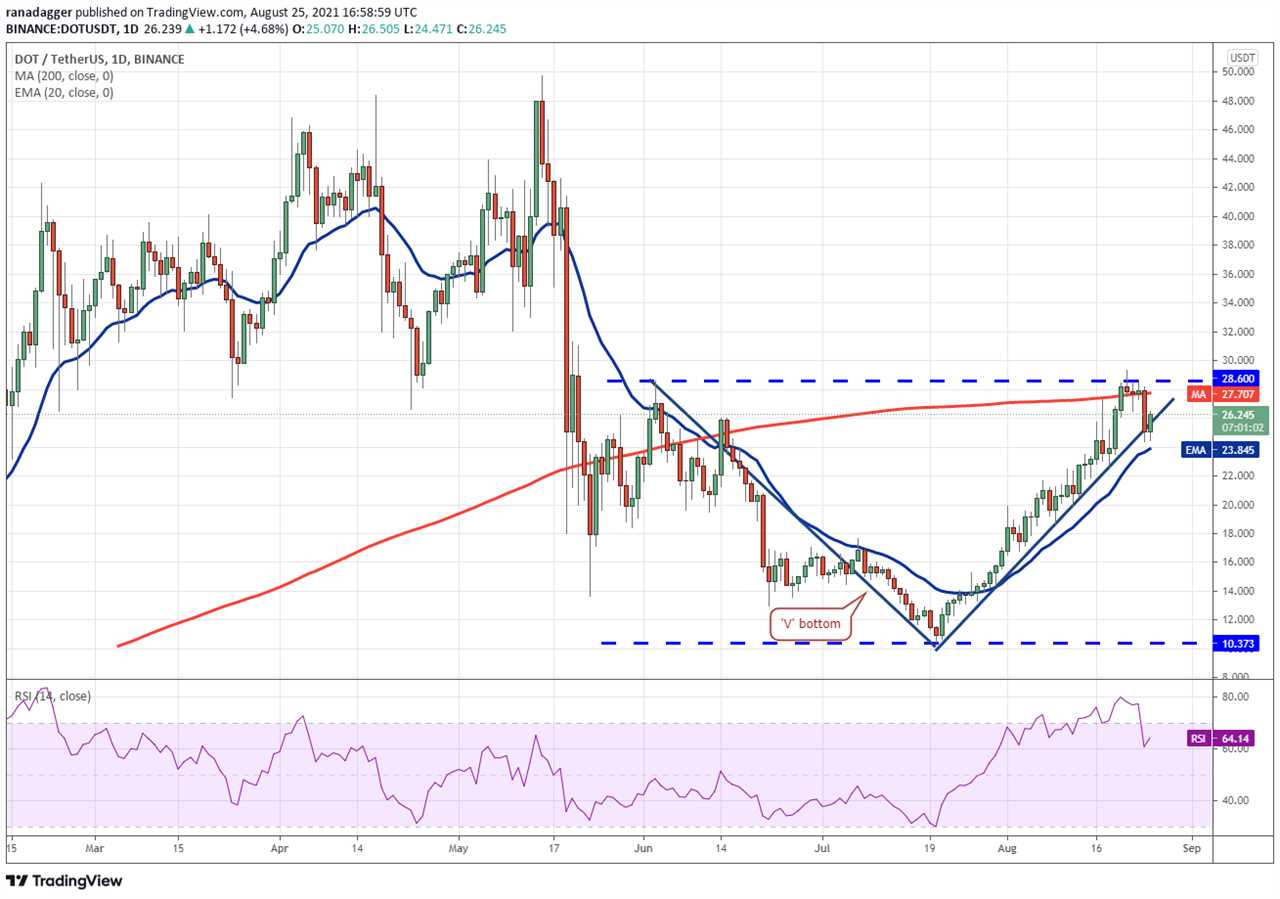
The bulls will now make one more attempt to thrust and sustain the price above the overhead resistance. If they manage to do that, the DOT/USDT pair will complete a V-bottom, which has a pattern target at $46.83.
On the contrary, if the bounce fizzles out and bears sink the price below the 20-day EMA, it will suggest that the bullish momentum has weakened. The pair could then drop to $18 and remain range-bound action for a few more days.
SOL/USDT
Solana (SOL) is currently correcting the sharp up-move of the past few days. This suggests that traders are booking profits. The critical support to watch on the downside is the breakout level at $58.38.
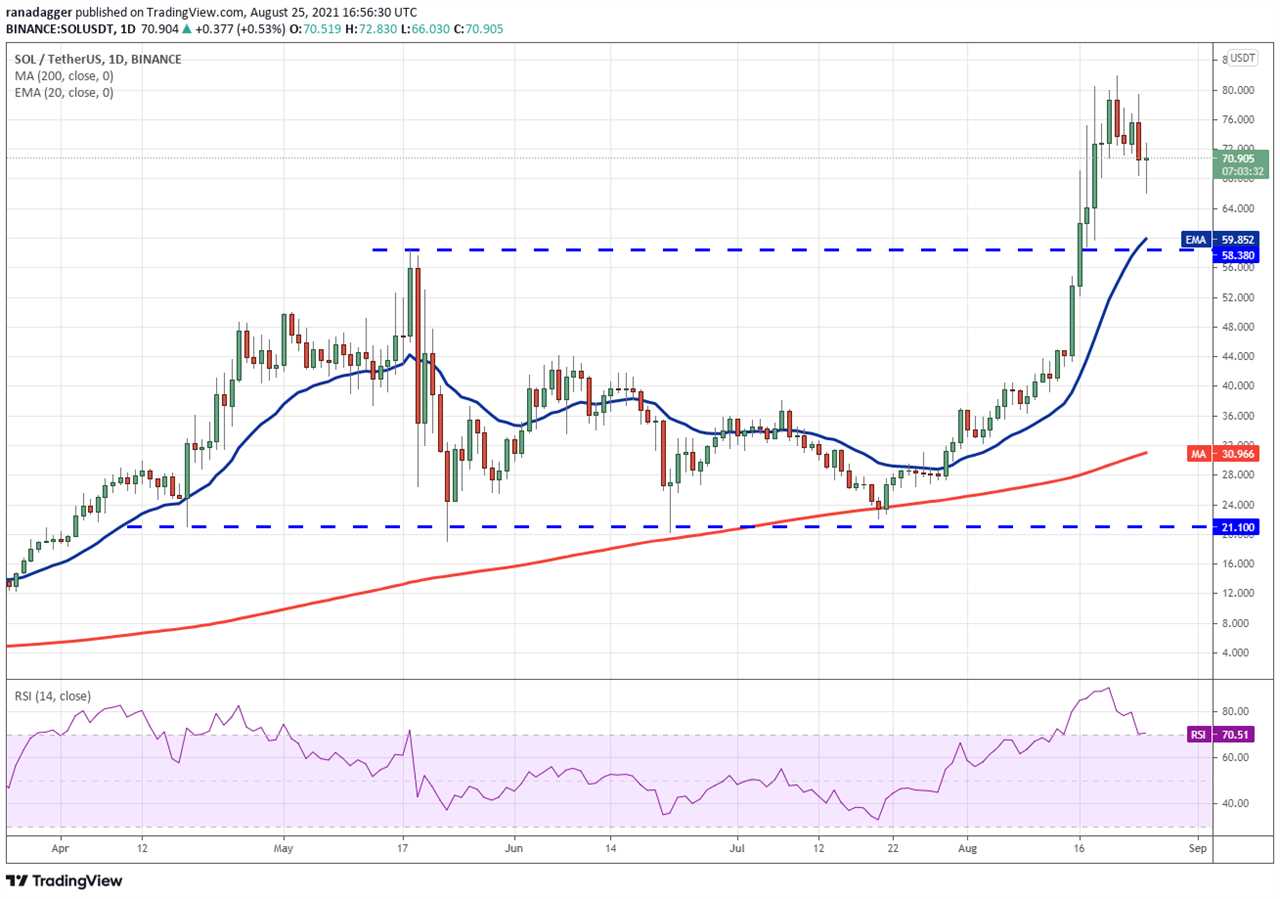
The upsloping 20-day EMA ($59) and the RSI in the overbought territory indicate that bulls have the upper hand. If the price rebounds off $58.38, it will suggest that traders continue to accumulate on dips. The bulls will then make one more attempt to resume the uptrend.
A breakout and close above $82 may start the next leg of the up-move. On the other hand, if the price turns down from $82, the SOL/USDT pair could remain range-bound for a few days. A break and close below $58.38 will suggest that bears are making a strong comeback.
Related: Bitcoin erases BTC price dip but $48.2K is now key to avoid bull trap
UNI/USDT
The long wick on the Uniswap (UNI) candlestick showed that bears continue to defend the overhead resistance at $30 on Aug. 23. That may have attracted profit-booking from short-term traders on Aug. 24, which pulled the price below the moving averages.
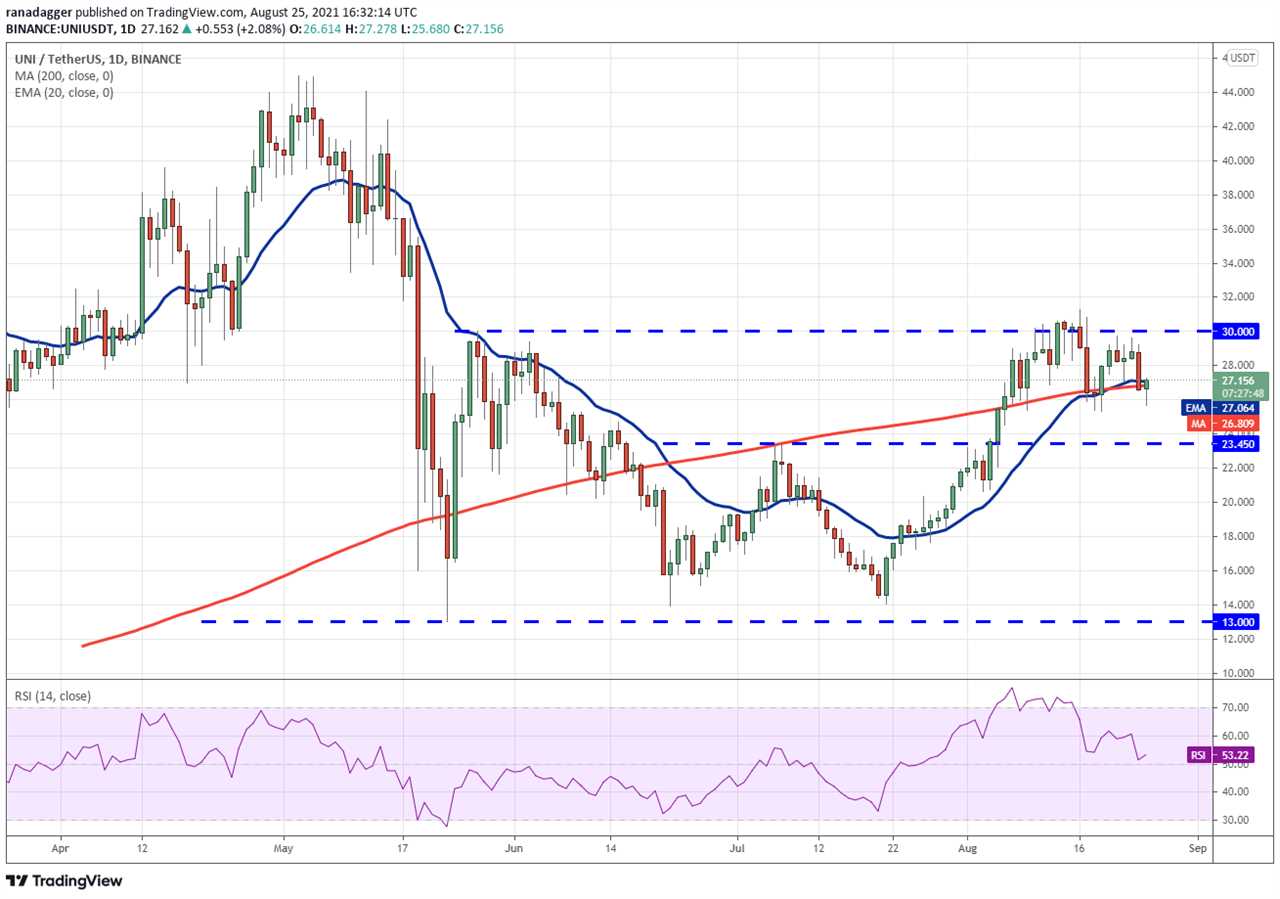
If bulls fail to sustain the price above the moving averages, the UNI/USDT pair could drop to $23.45. A strong bounce off this level will suggest that traders are buying on dips. That could keep the pair range-bound between $23.45 and $30 for a few more days.
The flat moving averages and the RSI near the midpoint suggest a few days of consolidation. A breakout and close above the $30 to $31.25 overhead resistance zone will signal the start of a new uptrend.
BCH/USDT
Bitcoin Cash (BCH) turned down from the $700 to $714.76 overhead resistance and slipped below the 200-day SMA ($657) on Aug. 24. The bulls are currently attempting to defend the 20-day EMA ($632), which is a positive sign.
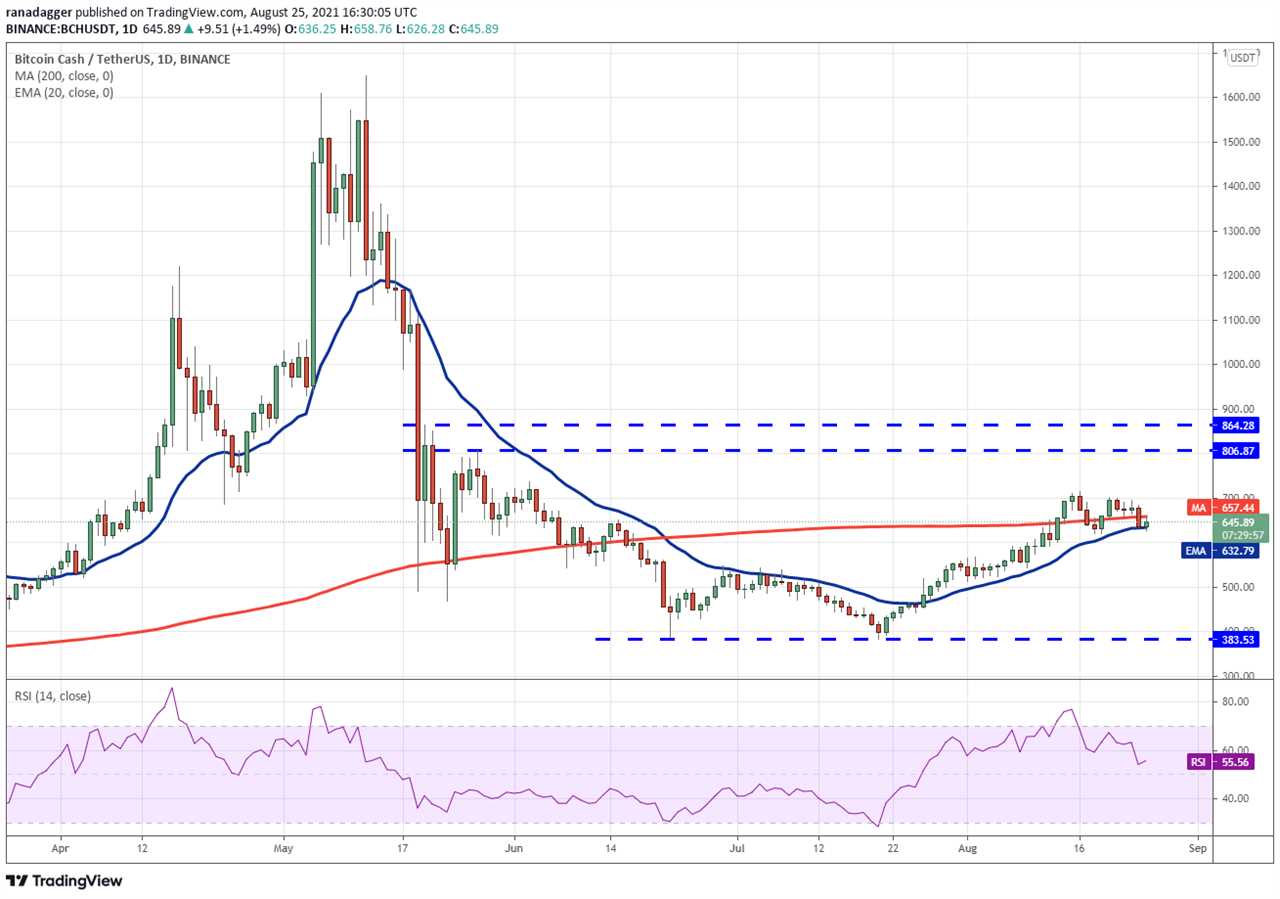
If the price rebounds off the current level and rises above the 200-day SMA, the BCH/USDT pair could rise to the overhead resistance zone. A breakout and close above this zone could open the doors for a rally to $806.87.
Conversely, if bears sink the price below the 20-day EMA and the $619 support, the pair could witness a deeper correction to $588 and then $550. Such a move will point to a few days of consolidation.
Market data is provided by HitBTC exchange.
Title: Price analysis 8/25: BTC, ETH, ADA, BNB, XRP, DOGE, DOT, SOL, UNI, BCH
Sourced From: cointelegraph.com/news/price-analysis-8-25-btc-eth-ada-bnb-xrp-doge-dot-sol-uni-bch
Published Date: Wed, 25 Aug 2021 21:15:00 +0100
Did you miss our previous article...
https://trendinginthenews.com/crypto-currency/kyrgyzstan-reportedly-introduces-regulations-for-crypto-exchanges