
Earlier this week, Fan Yifei, the deputy governor of the People’s Bank of China has warned that stablecoins like Tether (USDT) pose “risks and challenges to the international monetary system, and payments and settlement system”. Fan did not even spare Bitcoin (BTC) and called it a tool for speculation and a possible threat to “financial security and social stability.”
Other than the FUD from China, several traders have been focusing on the unlocking of a large amount of Bitcoin at the Grayscale Bitcoin Trust as a possible bearish sign. However, market analysis by crypto trading firm QCP Capital said the event won’t have any “significant impact on the overall market outside of GBTC itself.”
On a more positive front, analyst William Clemente said that more than 50,000 new Bitcoin entities are coming on-chain a day and it is not only retail that has been buying. According to Clemente, whales have started accumulating and their overall holdings have increased by 65,429 BTC.
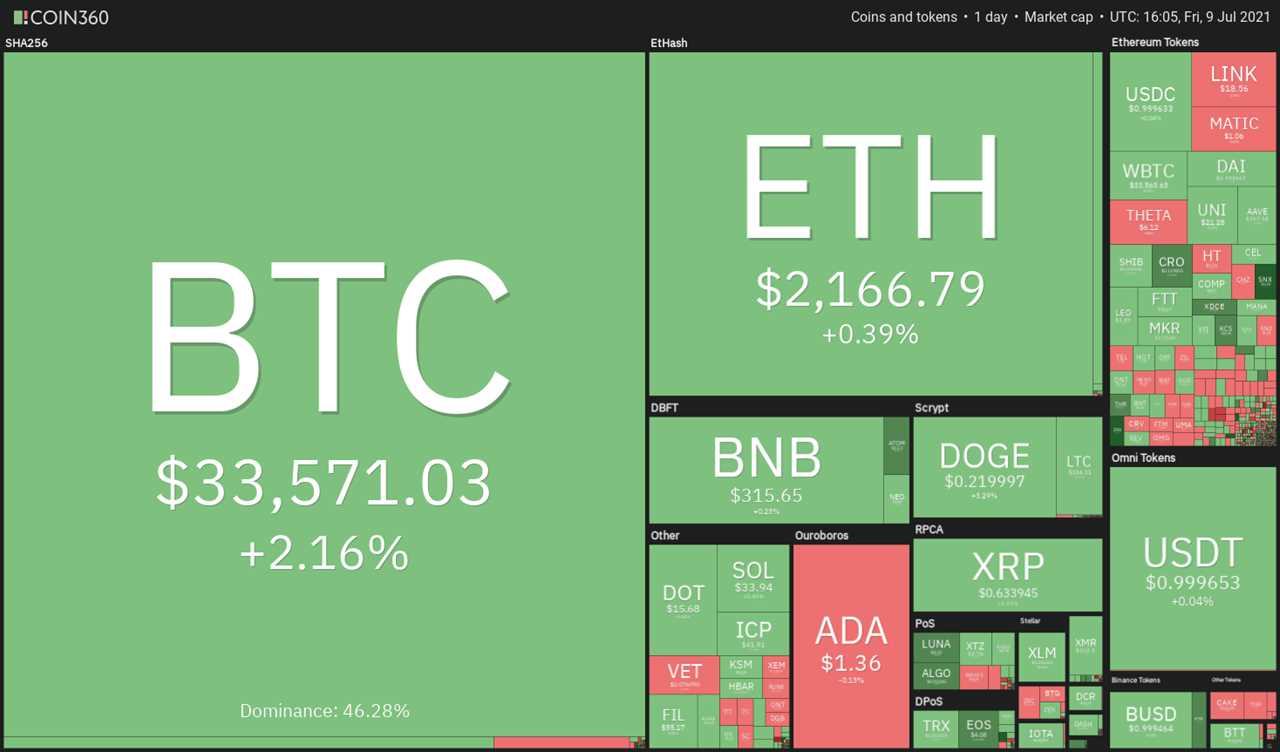
The big question for traders remains whether to buy in the current zone or wait for a further fall. Let’s study the charts of the top-10 cryptocurrencies to identify the possible path of least resistance.
BTC/USDT
Bitcoin has been trading in the lower half of the $31,000 to $42,451.67 rectangle for the past few days. This is a negative sign as it shows that demand dries up at higher levels and bears are not waiting for a sharp rally to initiate short positions.
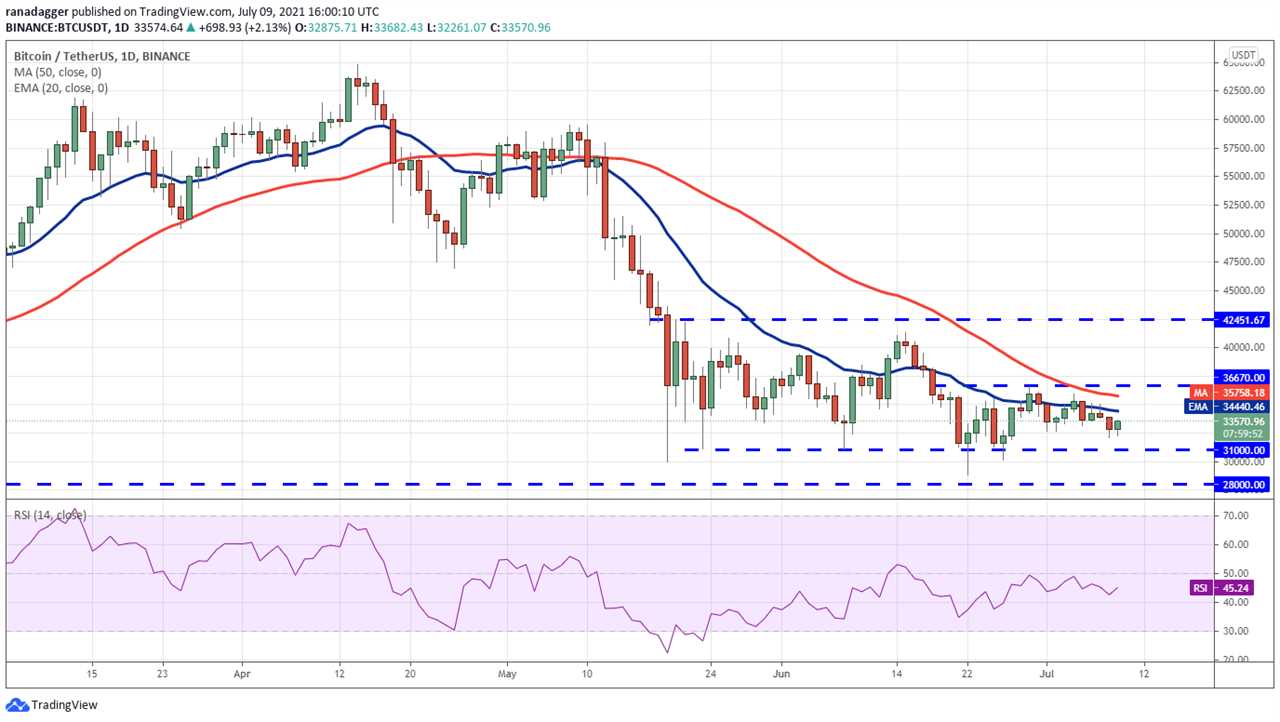
The 20-day exponential moving average ($34,440) has started to turn down again and the relative strength index (RSI) has dropped below 46, suggesting that bears have a slight advantage.
The sellers will now try to sink the BTC/USDT pair below the $31,000 to $28,000 support zone. However, it is unlikely to be easy because the bulls will mount a strong defense at the zone.
If the price rises from the current level or rebounds off $31,000, the buyers will again try to push the price to $36,670. A breakout of this resistance will be the first indication of strength. That will clear the path for an up-move to $42,451.67.
But if the $28,000 support collapses, panic selling may ensue as stops of traders who have been accumulating above $31,000 may hit. The next support on the downside is $20,000.
ETH/USDT
Ether (ETH) rose above the 50-day simple moving average ($2,350) on July 7 but the bulls could not sustain the higher levels. That may have attracted profit-booking by short-term traders and shorting by aggressive bears.
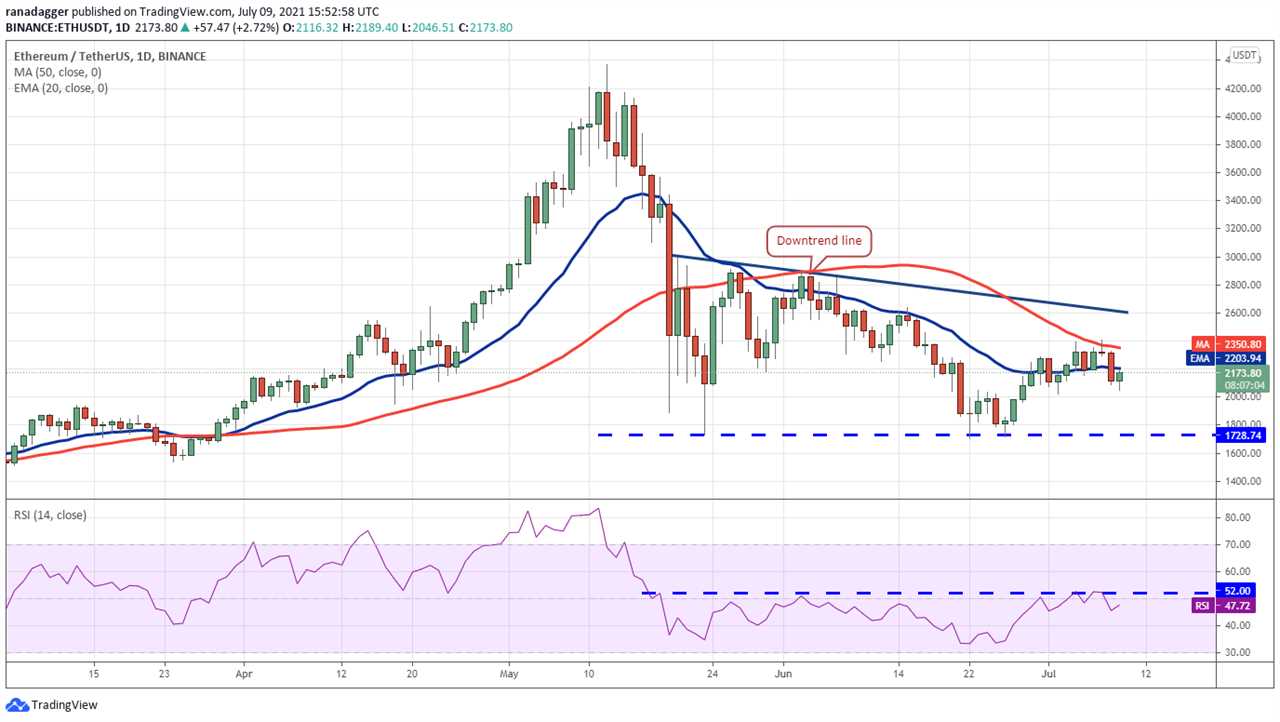
The ETH/USDT pair dropped below the 20-day EMA ($2,203) on July 8 but the positive sign is that the bulls are aggressively defending the support at $2,000. If buyers thrust the price above the moving averages, the pair could rise to the downtrend line. A break above this level will be the first indication that the correction may be ending.
Alternatively, if the price turns down from the moving averages, the bears will again try to sink the pair below $2,000. If they succeed, the pair could drop to the next critical support at $1,728.74. This is an important support to watch out for because if it cracks, the bearish momentum may pick up and the decline could extend to $1,536.92.
BNB/USDT
The relief rally in Binance Coin (BNB) hit a wall at the 50-day SMA ($231), which suggests that bears continue to sell at higher levels. The sellers will now try to pull the price below the 20-day EMA ($312).
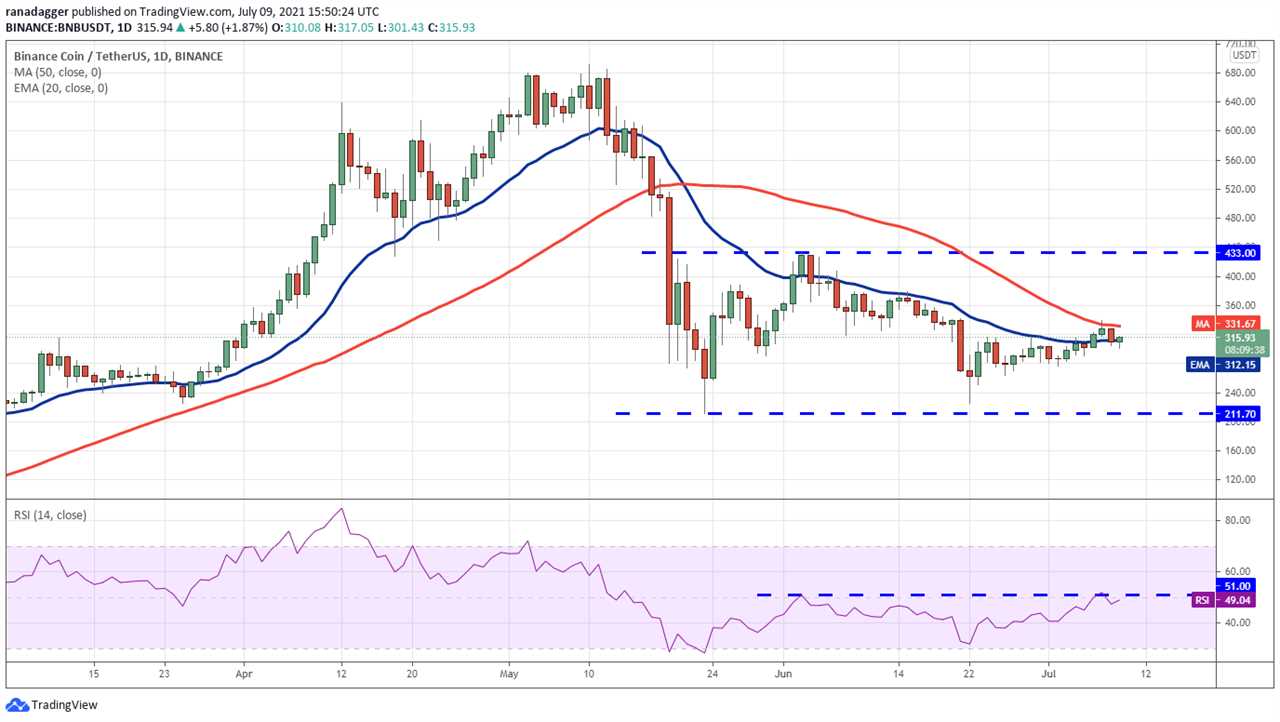
If they succeed, the BNB/USDT pair could drop to the $276.40 to $264.26 support zone. The flat moving averages and the RSI just below the midpoint suggest a balance between supply and demand.
If the pair rises from the current level or rebounds off the support zone, the bulls will again try to push and sustain the price above the 50-day SMA. If they manage to do that, the pair could rise to $379.58 and then to $433.
Alternatively, if the bears sink the price below $264.26, the next stop could be $211.70. A break below this level will signal the resumption of the downtrend.
ADA/USDT
The failure to rebound off the 20-day EMA ($1.38) between July 5 to July 7 indicated a lack of buying in Cardano (ADA). Due to this, the short-term traders may have booked profits on July 8, which pulled the price below the 20-day EMA.
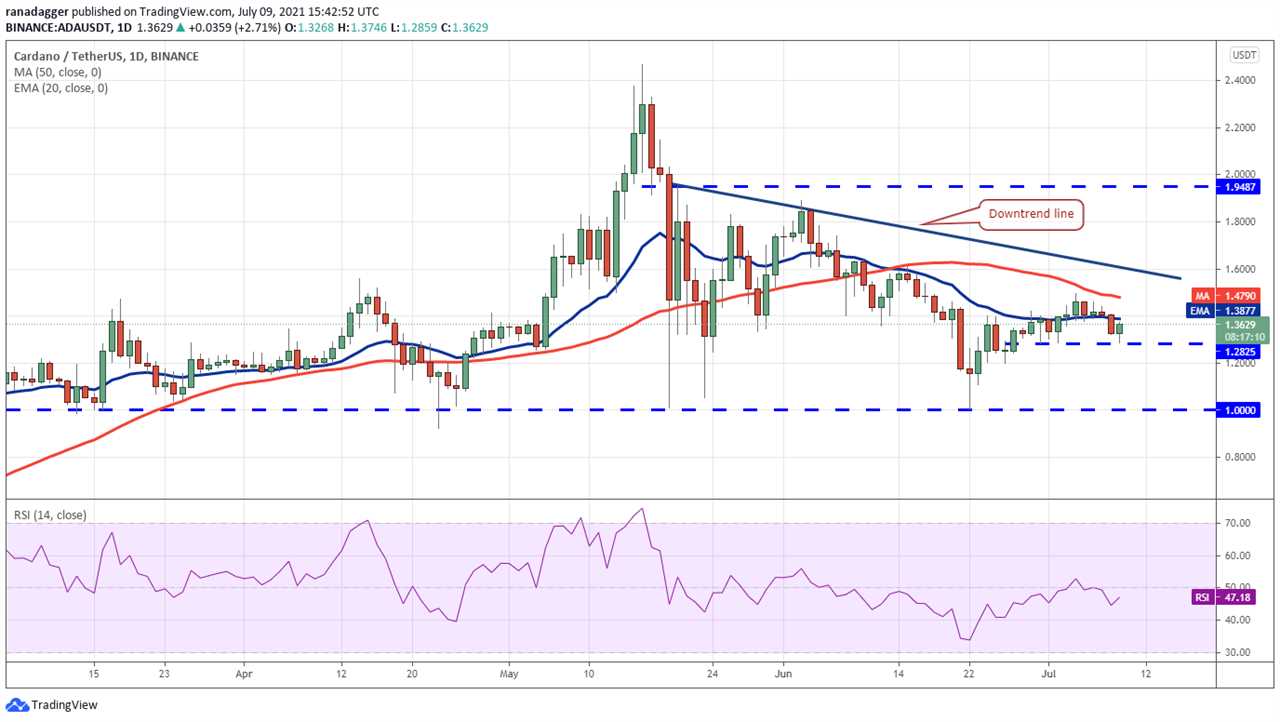
The price has rebounded off the $1.28 support today. The bulls will now try to push the ADA/USDT pair above the 20-day EMA. If they succeed, the buyers will make one more attempt to clear the hurdle at the 50-day SMA ($1.47) and drive the pair to the downtrend line.
On the other hand, if the price turns down from the 20-day EMA, the bears will try to sink the pair below $1.28. If that happens, the pair may drop to the critical support at $1. This remains the level to watch on the downside because a break below it could result in long liquidation. If that happens, the pair may drop to $0.68.
DOGE/USDT
Dogecoin (DOGE) slipped below the $0.21 support on July 8. However, the positive sign is that the bulls did not dump their positions on the break but bought the dip. This indicates accumulation at lower levels.
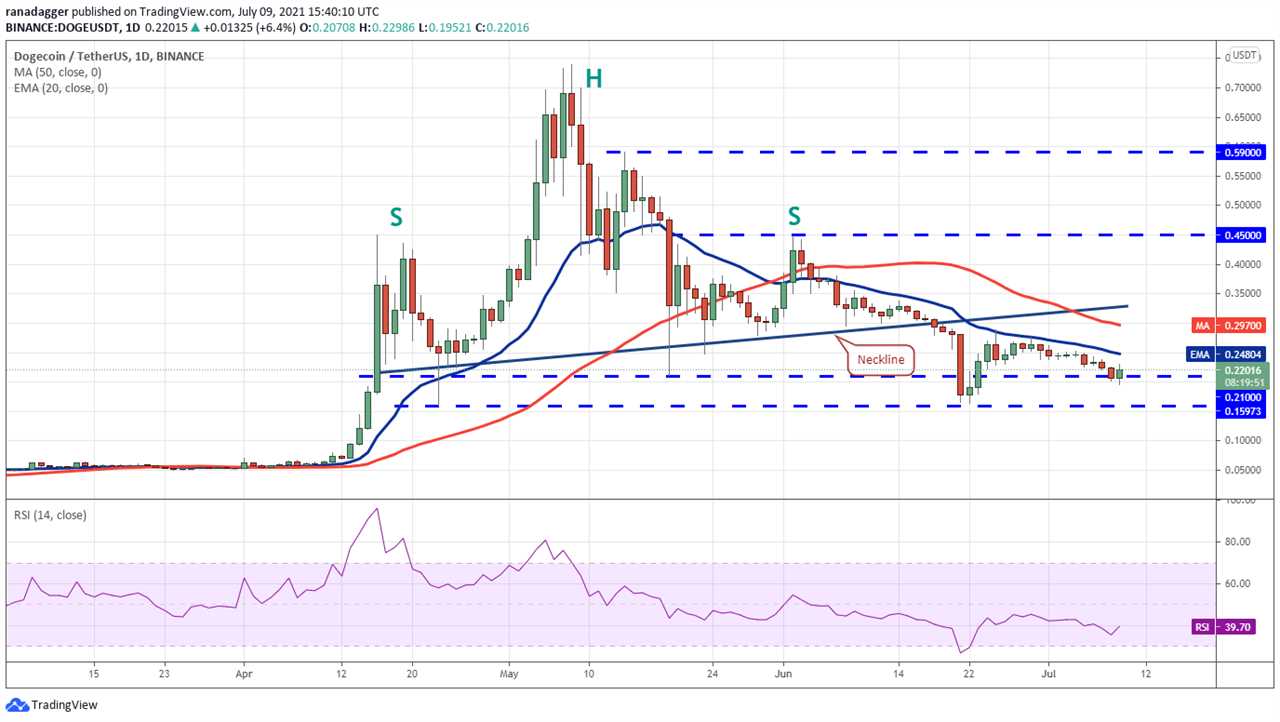
The bulls will now try to push the price above the 20-day EMA ($0.24). Such a move will be the first indication that buyers are attempting to a comeback. Above the 20-day EMA, the DOGE/USDT pair could rally to the 50-day SMA ($0.29) and then to the neckline of the head and shoulders pattern.
However, the downsloping moving averages and the RSI in the negative zone indicate that bears have the upper hand. If the price again turns down from the 20-day EMA, it will indicate that buying dries up at higher levels. The bears will then make one more attempt to sink the price to the critical support at $0.15.
XRP/USDT
The failure of the bulls to propel XRP above the 20-day EMA ($0.68) in the past few days shows that demand dries up at higher levels. Traders who were anticipating a break above the 20-day EMA seem to be liquidating their positions, resulting in a break below the $0.63 support.
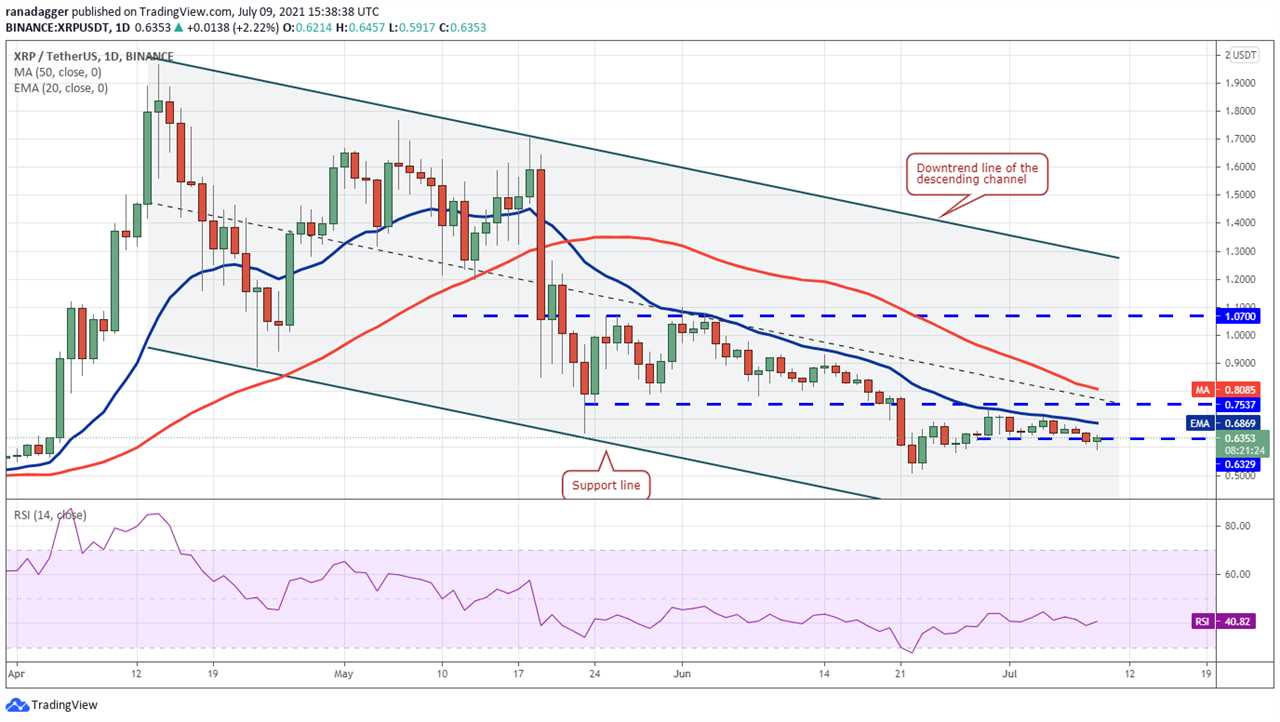
If bulls do not push and sustain the price above $0.63 quickly, the bears will try to capitalize on the advantage and pull the price below $0.58. If they manage to do that, the XRP/USDT pair could drop to psychological support at $0.50.
A break below this level may result in panic selling. The next support on the downside is at the support line of the descending channel. This negative view will be nullified if the price turns up and breaks above $0.75.
DOT/USDT
The bulls nudged Polkadot (DOT) above the overhead resistance at $16.93 on July 7 but they could not sustain the higher levels. The bears dragged the price back into the $13 to $16.93 range on July 8. This suggests that bears are not willing to let go of their advantage.
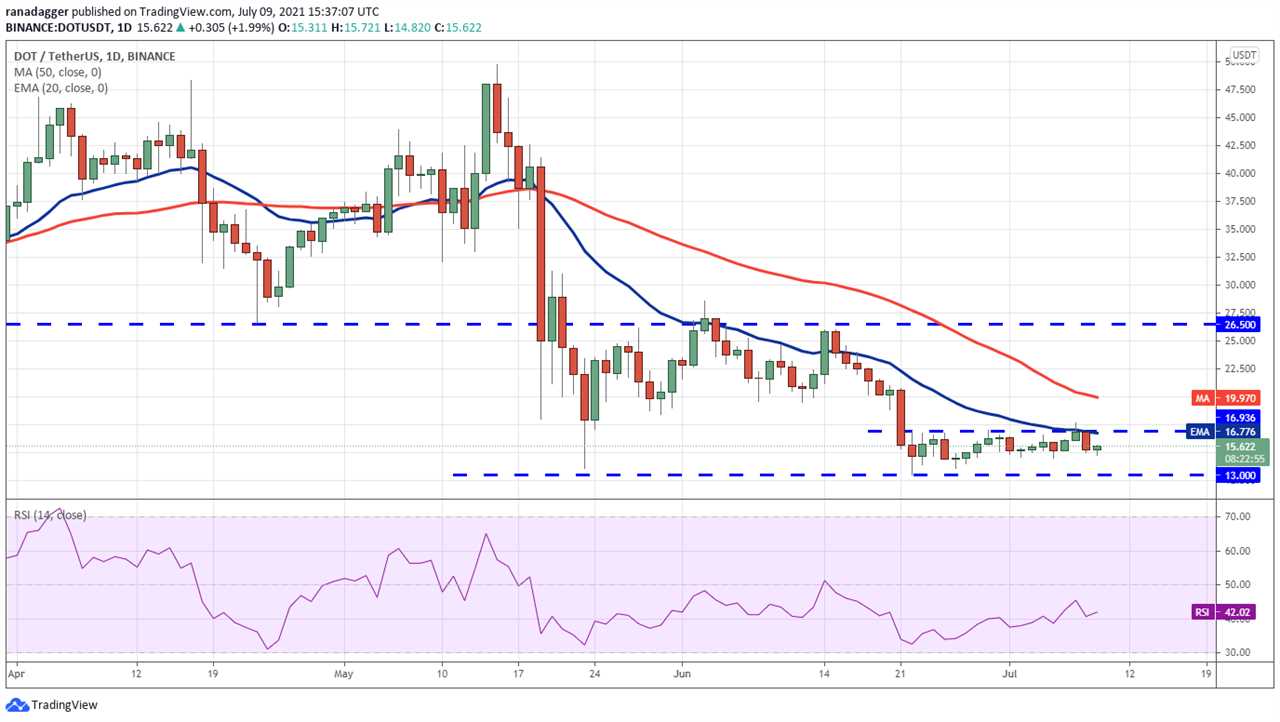
The bears will now try to break the immediate support at $14.50 and pull the price down to $13. Both moving averages are sloping down and the RSI is in the negative territory, indicating the path of least resistance is to the downside.
If bears sink the price below $13, the downtrend could resume and the DOT/USDT pair could drop to the psychological support at $10. This negative view will invalidate if the price turns up from the current level and breaks above $17.66.
UNI/USDT
The bulls pushed Uniswap (UNI) above the 50-day SMA ($22.03) on July 6 and 7 but they could not sustain the breakout. This suggests the bears sold at higher levels and tried to trap the bulls.
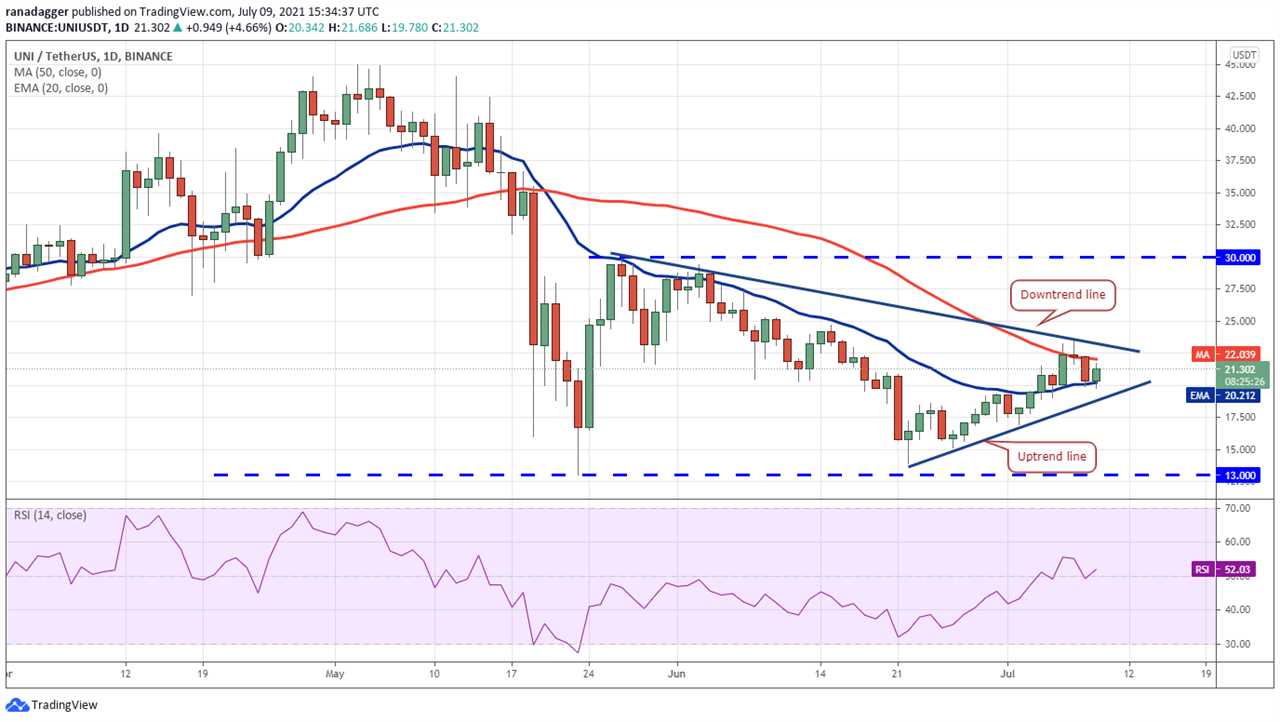
Both moving averages have flattened out and the RSI is near the midpoint, indicating a balance between supply and demand. The price has rebounded off the 20-day EMA ($20.21) today but the bulls will have to push and sustain the price above the downtrend line to gain the upper hand.
If they manage to do that, the UNI/USDT pair could start its northward march to $30. On the other hand, if the pair drops below the uptrend line, it will signal that bears have the upper hand. The pair could then slide down to $15 and then $13.
Related: Bitcoin is a miracle and better than gold, says Apple co-founder Wozniak
BCH/USDT
Bitcoin Cash (BCH) has been trading in a tight range between $475.69 and $538.11 for the past few days. Usually, such a tight consolidation near the resistance results in a breakout to the upside but that has not yet happened.
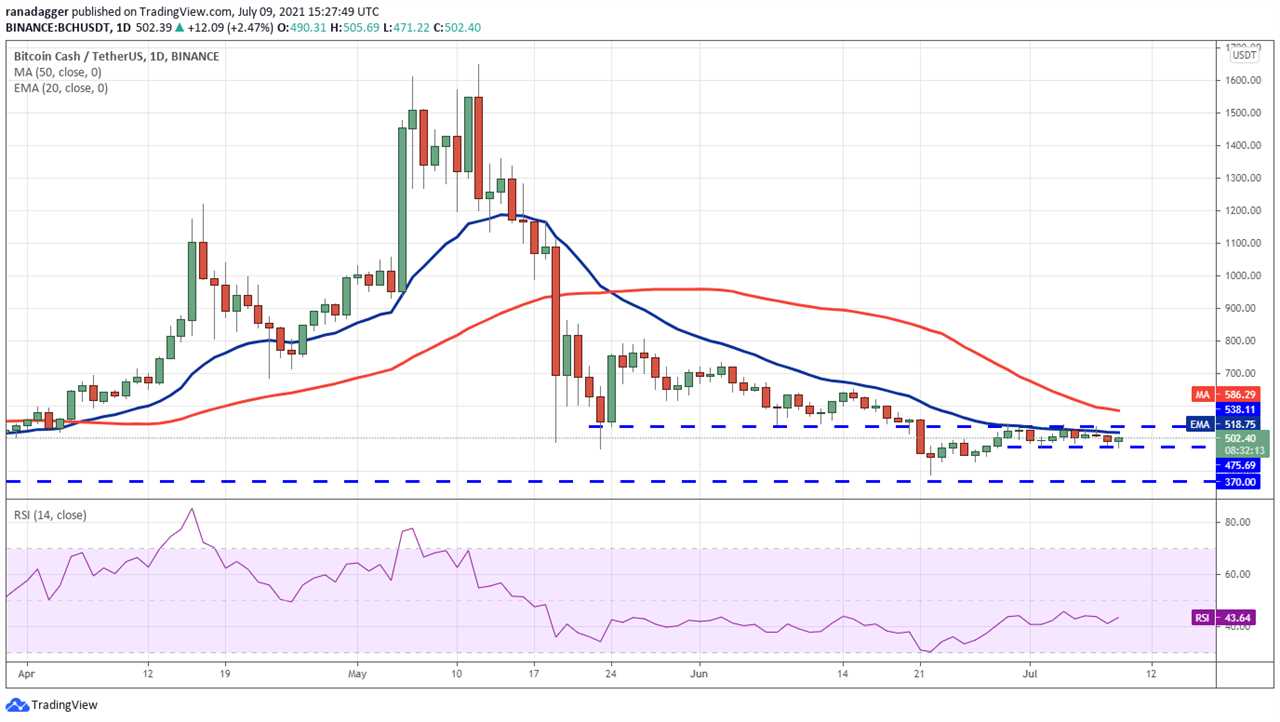
The failure to rise above the overhead resistance may attract profit-booking from short-term traders. That could result in a break below the tight range. If that happens, the BCH/USDT pair could decline to $428.43 and later to $370.
The 20-day EMA ($518) is sloping down marginally and the RSI is below 44, which suggests the bears are trying to gain the upper hand. This negative view will invalidate if the price turns up from the current level and breaks above $538.11. That could open the doors for a rally to $650.35.
SOL/USDT
Solana (SOL) broke above the 50-day SMA ($34.43) on July 7 but the bulls could not clear the hurdle at the downtrend line. The bears sold at this resistance and pulled the price back below the moving averages on July 8.
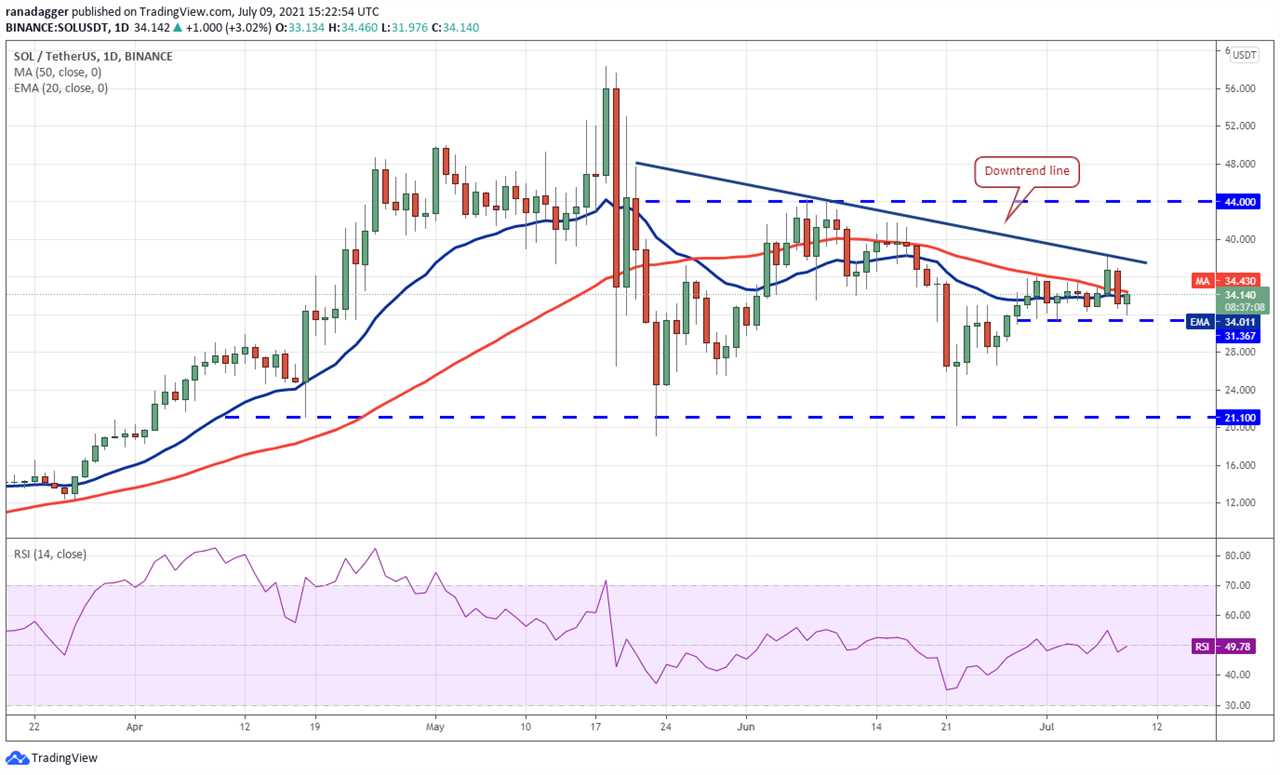
The bulls are currently attempting to defend the support at $31.36. If buyers push the price above the moving averages, the SOL/USDT pair could reach the downtrend line. A breakout of this resistance may result in a rally to $44.
However, if the price turns down from the current level or the downtrend line, the pair may trade between $31.36 and the downtrend line for a few days.
The flat moving averages and the RSI just below the midpoint suggest a balance between buyers and sellers. The bears may gain the upper hand if the $31.36 support cracks. That could result in a decline to $26.65.
Market data is provided by HitBTC exchange.
Title: Price analysis 7/9: BTC, ETH, BNB, ADA, DOGE, XRP, DOT, UNI, BCH, SOL
Sourced From: cointelegraph.com/news/price-analysis-7-9-btc-eth-bnb-ada-doge-xrp-dot-uni-bch-sol
Published Date: Fri, 09 Jul 2021 18:44:50 +0100


