
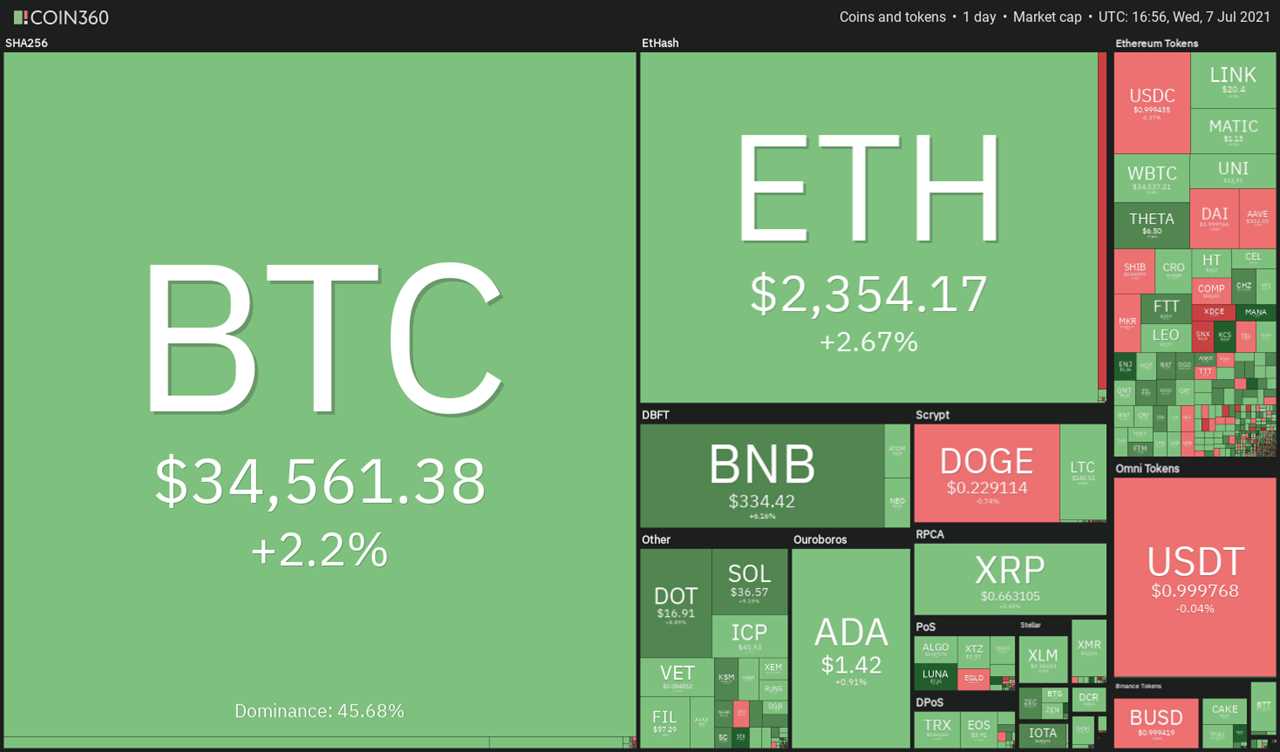
Bitcoin’s (BTC) range-bound action seems to be increasing the confidence of institutional investors looking to resume investing in cryptocurrencies. Proof of this comes as Marshall Wace, a London-based hedge fund, announced plans to invest in the digital asset space, according to sources at the Financial Times.
A survey of wealth managers and institutional investors already holding crypto, from the U.S., U.K., France, Germany, and the UAE shows that 82% of the respondents expect to increase their investments in digital assets by 2023.
The research shared with Cointelegraph claims that only 7% of the participants plan to reduce their exposure to crypto, while 40% plan to “dramatically increase their holdings.”
More evidence of institutional interest was highlighted in a report from CoinShares which revealed a total institutional inflow of $63 million into digital asset funds. The buying was broad-based as all individual digital assets with dedicated funds witnessed inflows for the first time in nine weeks.
However, the arrival of institutional investors is unlikely to result in a sharp upswing in crypto prices in the short term. This is because institutions gradually accumulate their desired exposure before boosting prices higher.
Let’s analyze the charts of the top-10 cryptocurrencies to identify the levels that will suggest the start of a possible uptrend.
BTC/USDT
The bulls have been holding Bitcoin above the trendline for the past few days. A breakout and close above $36,670 will complete an ascending triangle pattern that could result in a move to the overhead resistance at $42,451.67.
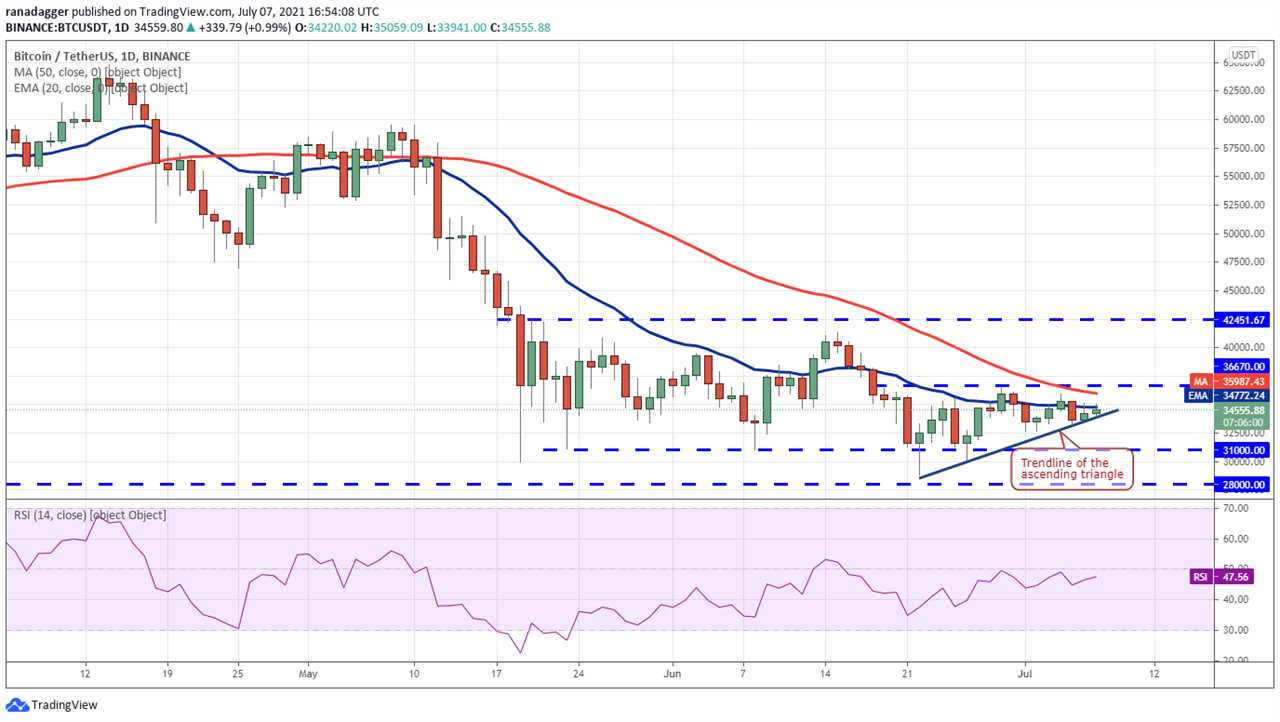
The bears are likely to mount a stiff resistance at $42,451.67. If the price turns down from this level, the BTC/USDT pair could drop to $36,670. If buyers can flip this level into support, it will suggest that the sentiment has turned positive and traders are buying on dips.
That will increase the possibility of a break above $42,451.67. Such a move will suggest that the correction has ended and the pair is ready to start a new uptrend.
Conversely, if the price turns down from the current level or the overhead resistance and breaks below the trendline, the pair may drop to $31,000. This is an important level to watch out for because the bears have not been able to manage a close below it.
If that happens, it will indicate that the bears have absorbed the demand. A break below $28,000 could result in panic selling, opening the gates for a drop to $20,000.
ETH/USDT
The bulls have sustained Ether (ETH) above the 20-day exponential moving average ($2,219) for the past three days, which indicates that the sentiment is turning positive. The buyers are currently attempting to push and sustain the price above the 50-day simple moving average ($2,369).
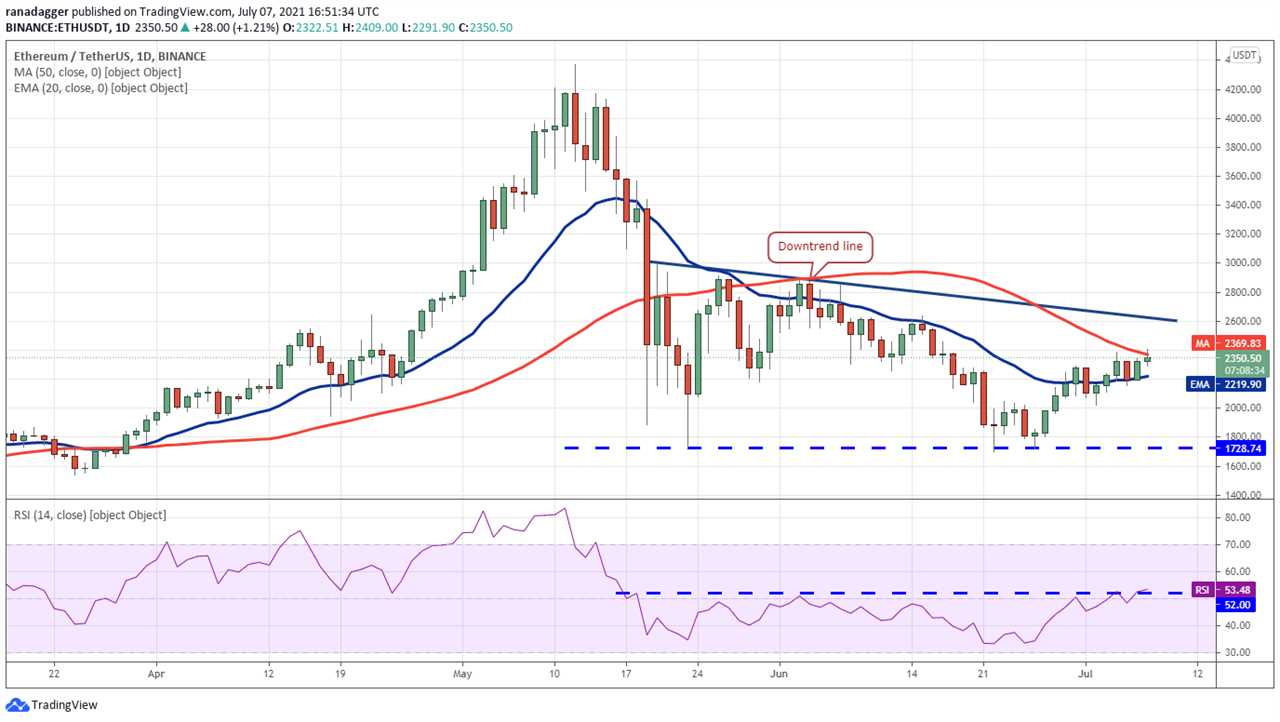
If they succeed, the ETH/USDT pair could rally to the downtrend line where the bears may again mount a stiff resistance. If the price turns down from it but rebounds off the 20-day EMA, then the possibility of a break above the downtrend line increases.
Such a move could open the gates for a move to $2,990.05. A break above this resistance will suggest that the correction is over.
Conversely, if the price turns down from the current level or the overhead resistance and breaks below the 20-day EMA, it will indicate that bears are selling on rallies. The pair could then drop to $2,000 and then $1,728.74.
BNB/USDT
Binance Coin (BNB) broke above the 20-day EMA ($312) on July 6, which suggests that the demand is picking up. The bears may now try to defend the 50-day SMA ($333) aggressively.
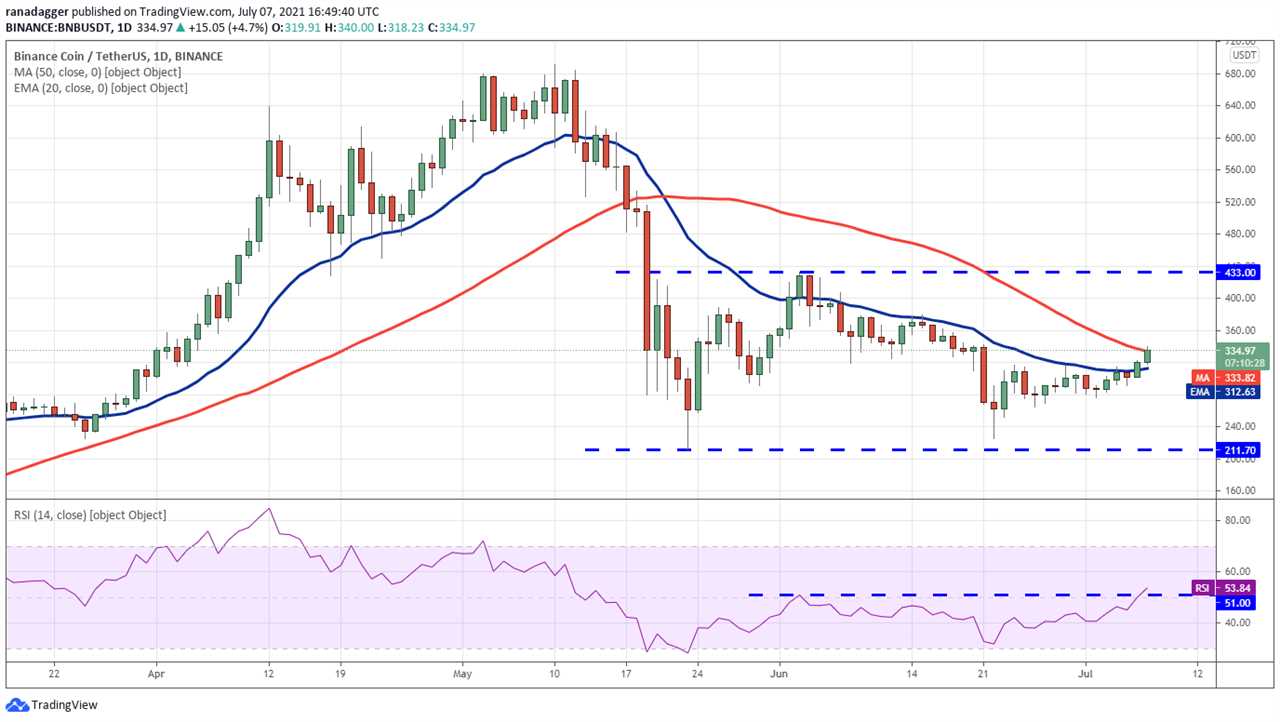
However, the flat 20-day EMA and the relative strength index (RSI) above 53 indicate the bulls are back in the game. If buyers push and sustain the price above the 50-day SMA, the BNB/USDT pair could rally to $379.58 and then $433.
Contrary to this assumption, if the price turns down from the 50-day SMA and plummets below $264.26, it will suggest that bears have overpowered the bulls and are back in the driver’s seat. The pair could then drop to $211.70.
ADA/USDT
Cardano (ADA) has been trading above the 20-day EMA ($1.39) for the past three days but the bulls have not been able to challenge the 50-day SMA ($1.49). The flat 20-day EMA and the relative strength index (RSI) near the midpoint suggest a balance between supply and demand.
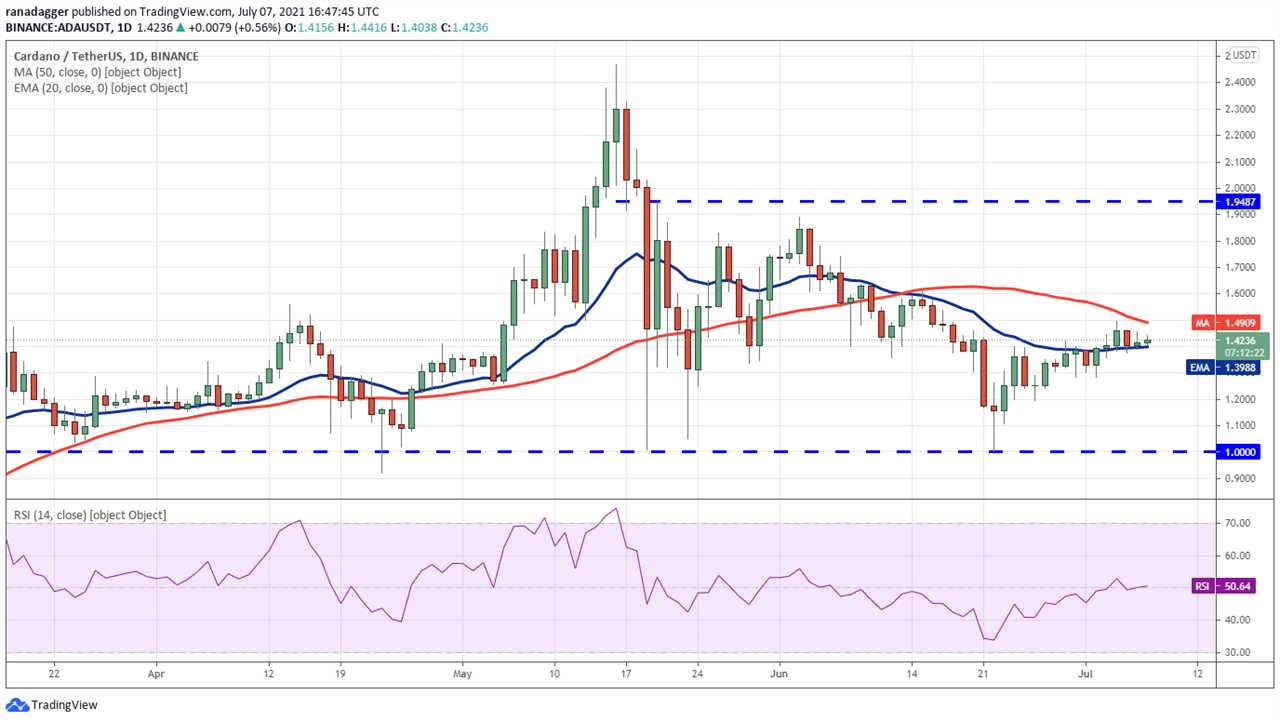
This equilibrium will shift in favor of the bulls if they propel the price above the 50-day SMA. That could result in a move to $1.60 and then to the overhead resistance at $1.94. The bears are likely to defend this level aggressively.
Contrary to this assumption, if bears sink and sustain the price below the 20-day EMA, the ADA/USDT pair could drop to $1.20. If the price rebounds off this level, the bulls will make one more attempt to clear the overhead hurdle. However, if the $1.20 support cracks, the pair could drop to $1.
DOGE/USDT
Dogecoin (DOGE) turned down from the 20-day EMA ($0.25) on July 5 but the bears have not been able to sink the price below the $0.21 support. This suggests that selling dries up at lower levels.
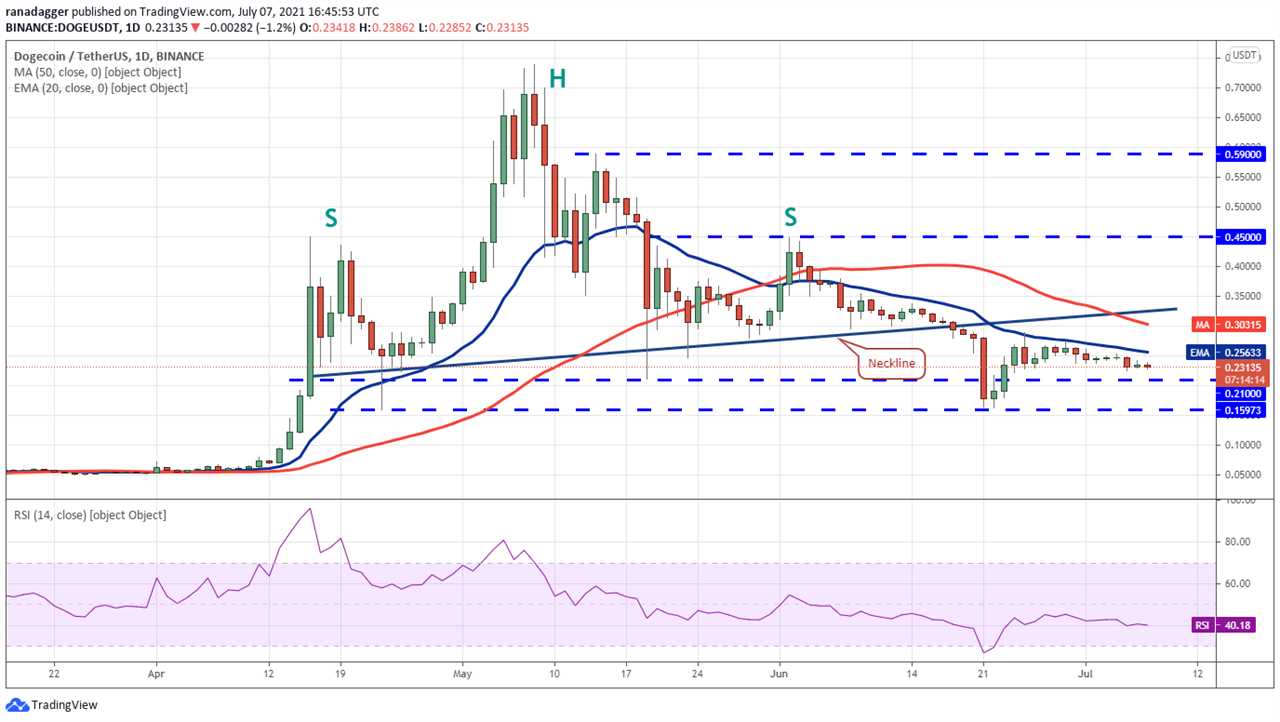
However, if bulls do not drive the price above the 20-day EMA, the selling may resume. The downsloping moving averages and the RSI below 41 suggest that the path of least resistance is to the downside.
A break below $0.21 could open the doors for a decline to $0.15. This is an important support for the bulls because a break below it could result in panic selling. The DOGE/USDT pair could then drop to $0.10.
Alternatively, if bulls push and sustain the price above the 20-day EMA, the pair may rally to the neckline of the head and shoulders pattern.
XRP/USDT
XRP has been sandwiched between $0.63 and the 20-day EMA ($0.70) for the past few days. This tight-range trading suggests indecision among the bulls and the bears about the next directional move. Therefore, traders seem to be avoiding large bets.
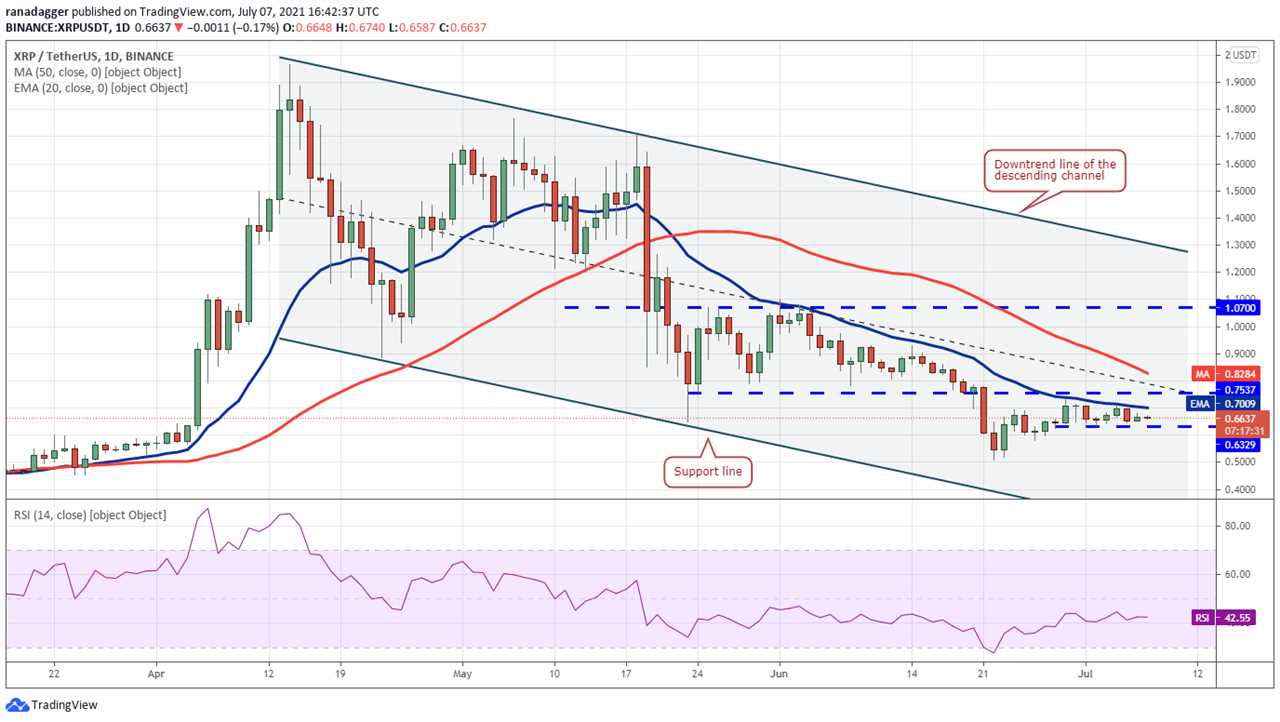
However, this consolidation in the small range is unlikely to continue for long. Soon, the price may start a decisive move. If bulls thrust the price above the 20-day EMA and the overhead resistance at $0.75, the XRP/USDT pair could rise to $0.93 and later to $1.07.
On the contrary, if the price plummets below $0.63, the bears will try to pull the price down to $0.58 and then to $0.50. A break below the psychological level at $0.50 will suggest the resumption of the downtrend.
DOT/USDT
The bulls are attempting to push Polkadot (DOT) above the overhead resistance at $16.93 and the 20-day EMA ($17.07). If they succeed, the altcoin could rally to the 50-day SMA ($20.43) where the bears are again likely to mount a stiff resistance.
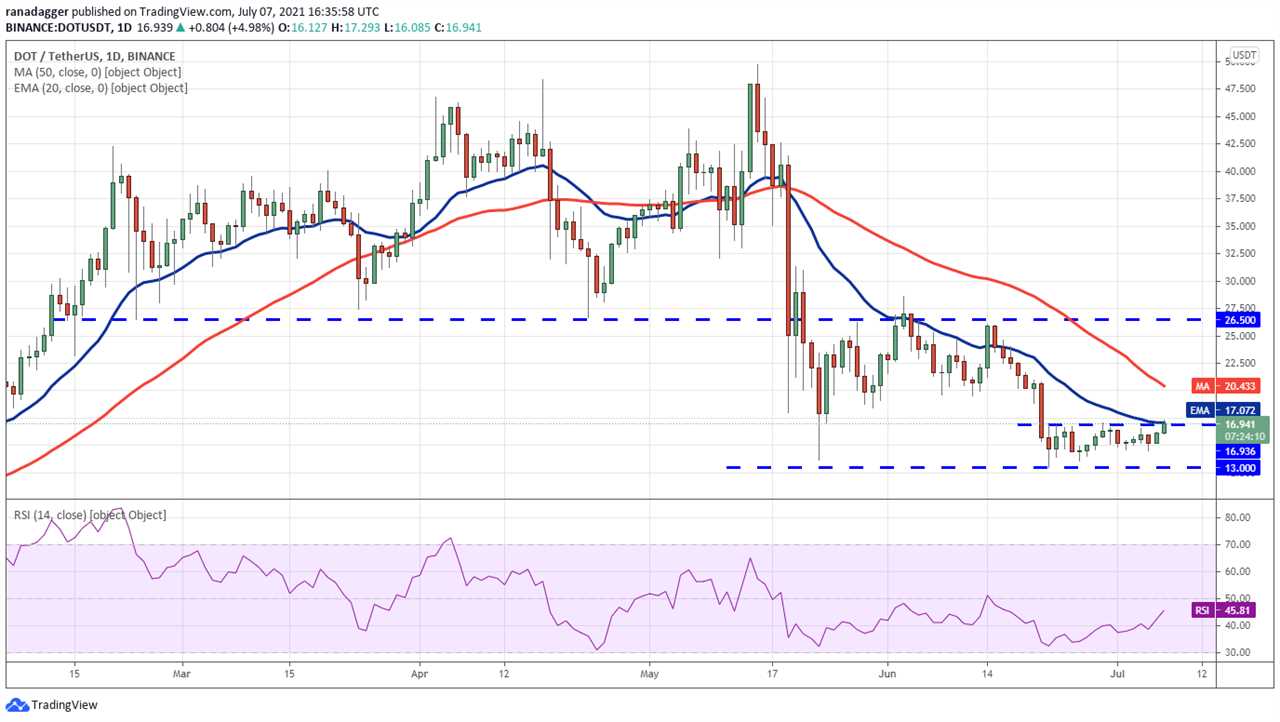
However, following the breakout, if buyers arrest the next decline at the 20-day EMA, it will suggest a possible change in sentiment. The flattening 20-day EMA and the RSI above 45, signal that bulls are trying to make a comeback.
If buyers propel the price above the 50-day SMA, the DOT/USDT pair may start its northward march toward $26.50. This positive view will invalidate if the price turns down and slides below $13.
UNI/USDT
The bulls defended the 20-day EMA ($20.11) on July 5, which indicates a possible change in sentiment. The buying continued on July 6 and the bulls pushed Uniswap (UNI) above the 50-day SMA ($22.20). There was a weak attempt by the bears to stall the relief rally at this level but that has been overcome by the buyers today.
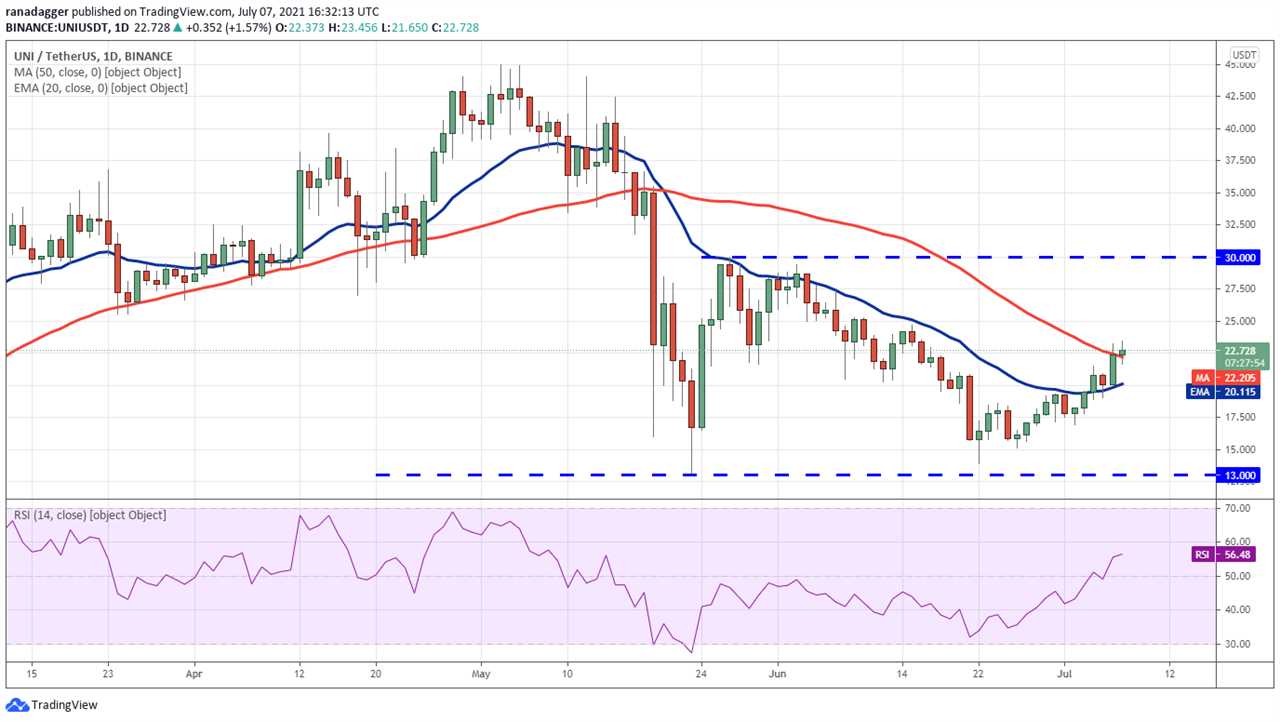
The 20-day EMA has started to turn up and the RSI has risen above 56, indicating that buyers have the upper hand. There is a minor resistance at $25 but if this level is crossed, the UNI/USDT pair may rise to $27 and then $30.
This positive view will invalidate if the price turns down from the current level and the bears pull the pair below the 20-day EMA. If that happens, it will suggest that the bears have trapped the aggressive bulls, opening the possibility of a fall to $16.93 and later $13.
Related: Bitcoin battles $35K as traders agree volatile BTC price move incoming
BCH/USDT
Bitcoin Cash (BCH) has been clinging to the overhead resistance at $538.11 for the past few days. A tight consolidation near a stiff resistance usually results in a break above it.
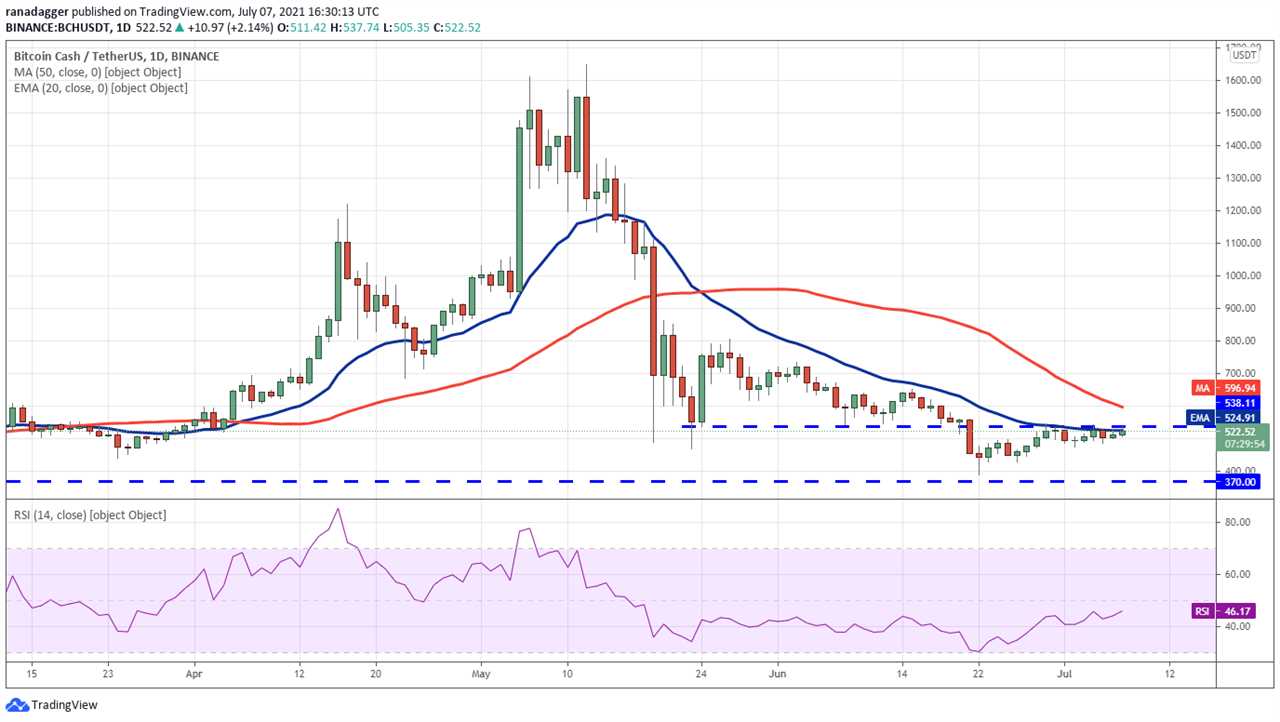
The flat 20-day EMA ($524) and the RSI above 46 indicate the bulls are trying to make a comeback. If buyers propel the price above $538.11, the BCH/USDT pair could start its upward journey to $650.35 and then $800.
Contrary to this assumption, if the price turns down from the current level or the 50-day SMA ($596) and breaks below $475.69, the pair may drop to $370. Such a move may keep the pair range-bound between $370 and $538.11 for a few more days.
SOL/USDT
Solana (SOL) had been trading between the 50-day SMA ($34.67) and the horizontal support at $33 for the past few days. This showed that the bulls were not dumping their positions near the 50-day SMA and were buying on dips below $33.
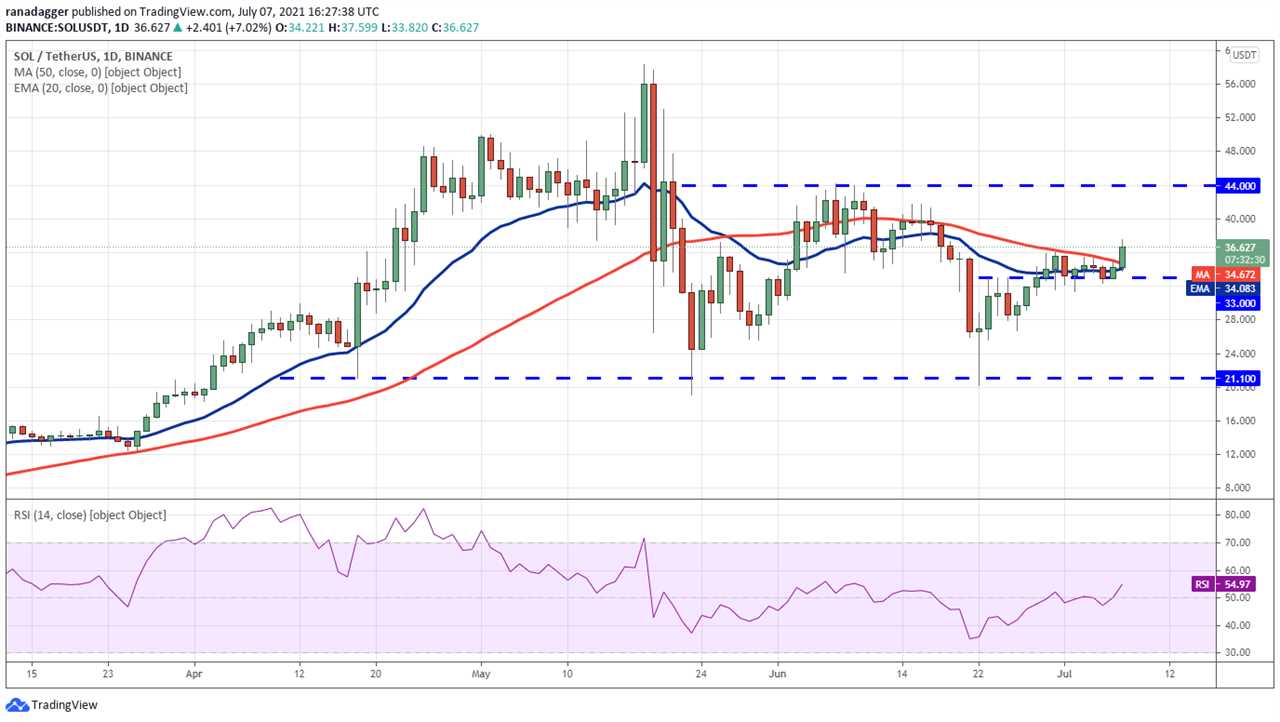
The failure of the bears to sustain the price below $33 attracted buying and the bulls have driven the price above the 50-day SMA today. The SOL/USDT pair could now rally to the overhead resistance zone at $41.75 to $44.
If the price turns down from this zone but rebounds off the 20-day EMA, it will suggest that the sentiment has changed from sell on rallies to buy on dips. That will improve the prospects of a break above $44. If that happens, the pair could start a new uptrend. The bears may gain the upper hand on a break below $31.36.
Market data is provided by HitBTC exchange.
Title: Price analysis 7/7: BTC, ETH, BNB, ADA, DOGE, XRP, DOT, UNI, BCH, SOL
Sourced From: cointelegraph.com/news/price-analysis-7-7-btc-eth-bnb-ada-doge-xrp-dot-uni-bch-sol
Published Date: Wed, 07 Jul 2021 22:20:53 +0100