
The United States equity markets have witnessed a solid year so far. The Nasdaq Composite has soared 31.7%, its best first-half performance since 1983. Similarly, the S&P 500 Index’s (SPX) 15.9% gain is its best first half since 2019. This suggests that risky assets remain in demand.
In the cryptocurrency markets, Bitcoin (BTC) has led the recovery from the front, rising 20% in Q2 2023. An encouraging sign is that the rise has not tempted the Bitcoin hodlers to book profits. Glassnode’s Illiquid Supply Change metric is near cycle highs, indicating hodler conviction.
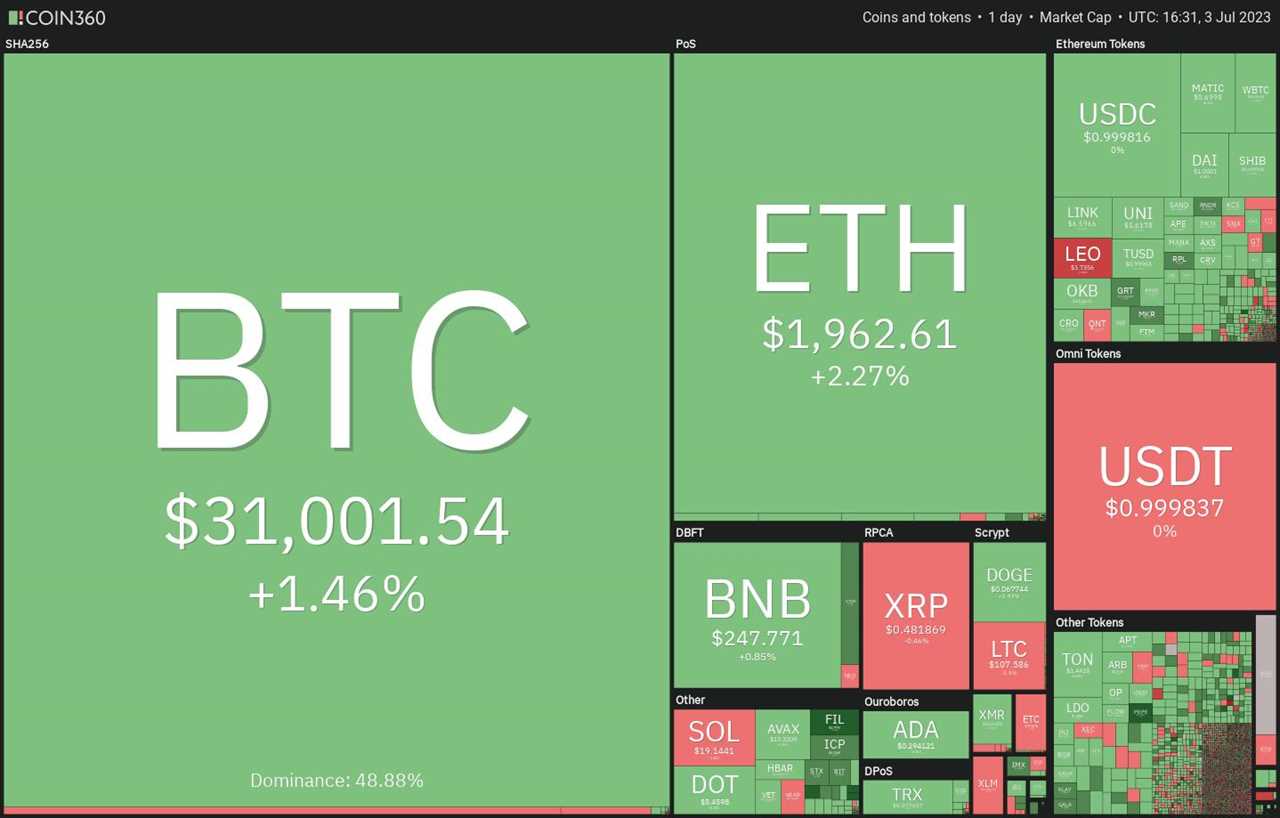
Usually, the leader is the first to emerge from a bear market. If the rally sustains, the sentiment among the traders improves and they start looking at other buying opportunities. After Bitcoin’s rally, the altcoins have started to show signs of life. If the trend continues, several altcoins may rally over the next few weeks.
Will the U.S. equities markets continue their march higher? Could Bitcoin and the major altcoins continue their recovery? Let’s analyze the charts to find out.
S&P 500 Index price analysis
The S&P 500 Index bounced off the breakout level of 4,325 on June 26, indicating that the bulls have flipped the level into support.
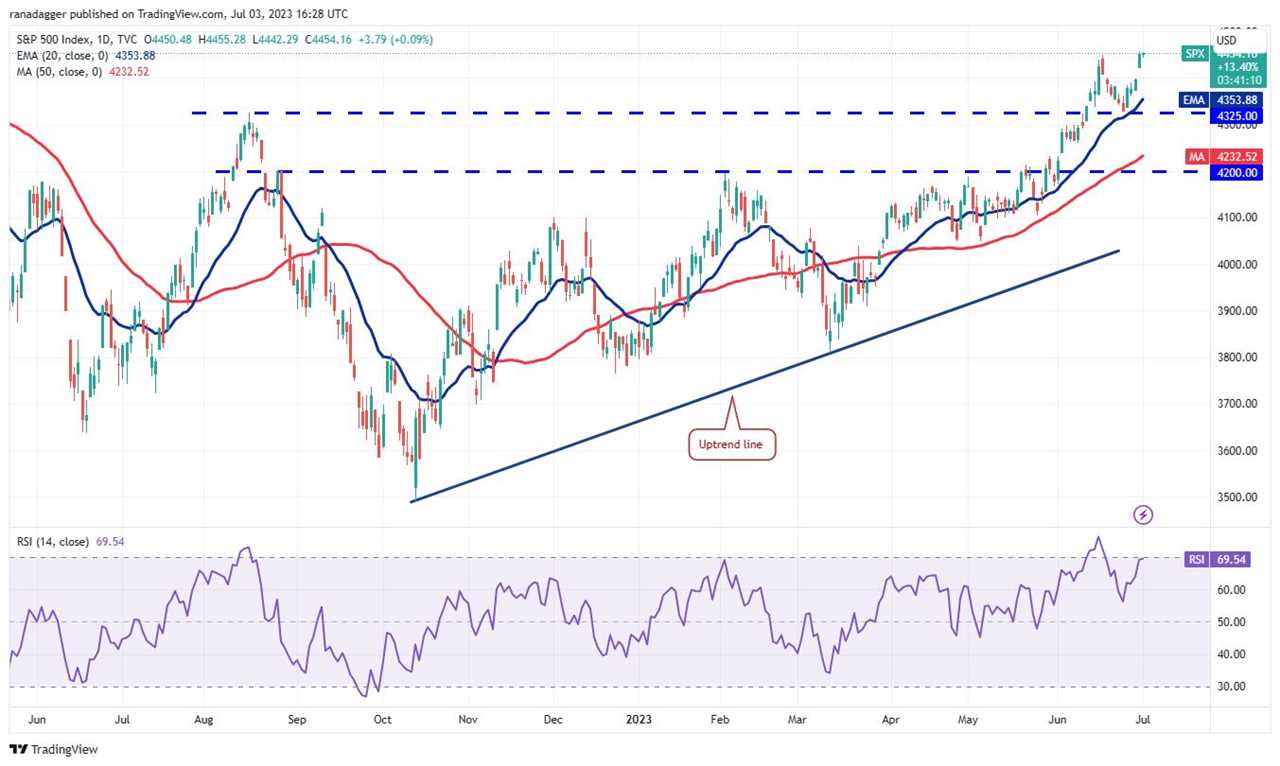
Buyers continued their purchases at higher levels which pushed the index above the immediate resistance at 4,448. This indicates the resumption of the uptrend. The bears are likely to pose a strong challenge at 4,500 but the likelihood of this level holding is low. If the index rises above this resistance, the rally could reach 4,650.
If bulls want to prevent the up-move, they will have to quickly yank the price below 4,325. If they do that, the selling could pick up momentum and the index may plummet to 4,200.
U.S. dollar index price analysis
The bulls pushed the U.S. dollar index (DXY) above the 20-day exponential moving average (103) on June 28, indicating strength.
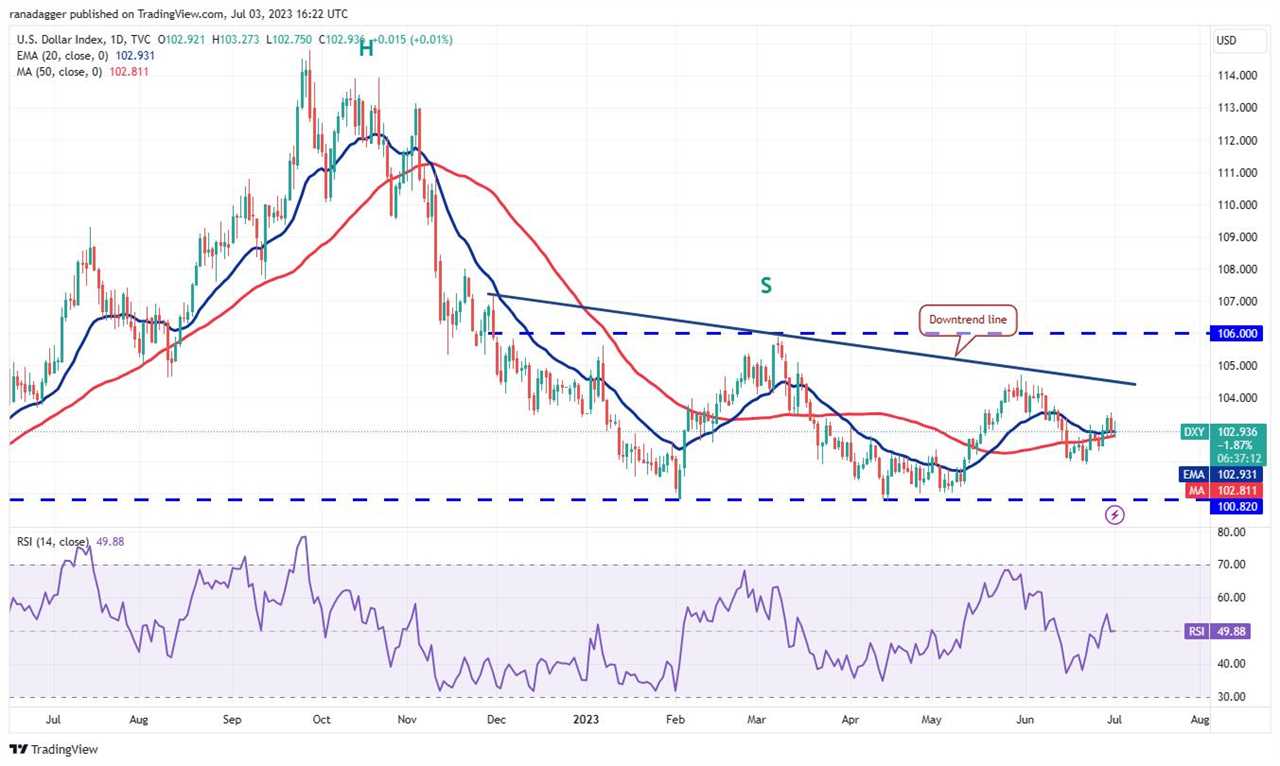
The bears tried to pull the price back below the moving averages on June 30 but the bulls did not relent. This suggests that lower levels are attracting buyers. The bulls will then try to push the price to the downtrend line.
Contrary to this assumption, if the price turns down and breaks below the moving averages, it will suggest that bears are selling on minor rallies. That could pull the price down to the immediate support at 102.
Bitcoin price analysis
The long tail on Bitcoin’s July 2 candlestick shows that the bulls are buying the intraday dips. The buyers will try to strengthen their position by driving and sustaining the price above the overhead resistance at $31,000.
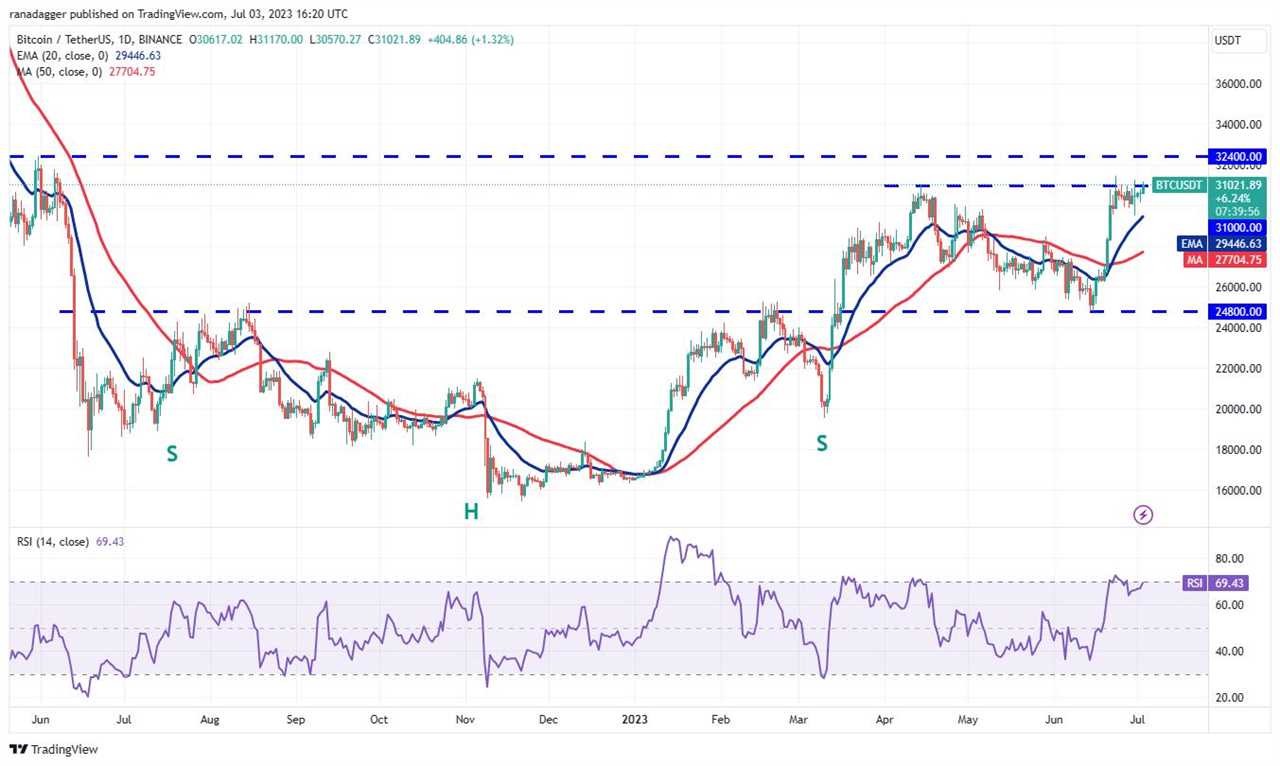
If they manage to do that, the BTC/USDT pair could pick up momentum and start its northward march toward $40,000. The $32,400 level may act as a minor roadblock but it is likely to be crossed.
The rising 20-day EMA ($29,446) and the relative strength index (RSI) near the overbought zone indicate advantage to buyers. Sellers will have to sink the price below the 20-day EMA to gain the upper hand in the near term. The pair may then drop to the 50-day simple moving average ($27,704).
Ether price analysis
The bears tried to tug Ether (ETH) toward the 20-day EMA ($1,866) on July 2 but the long tail on the candlestick shows that the bulls are buying on minor dips.
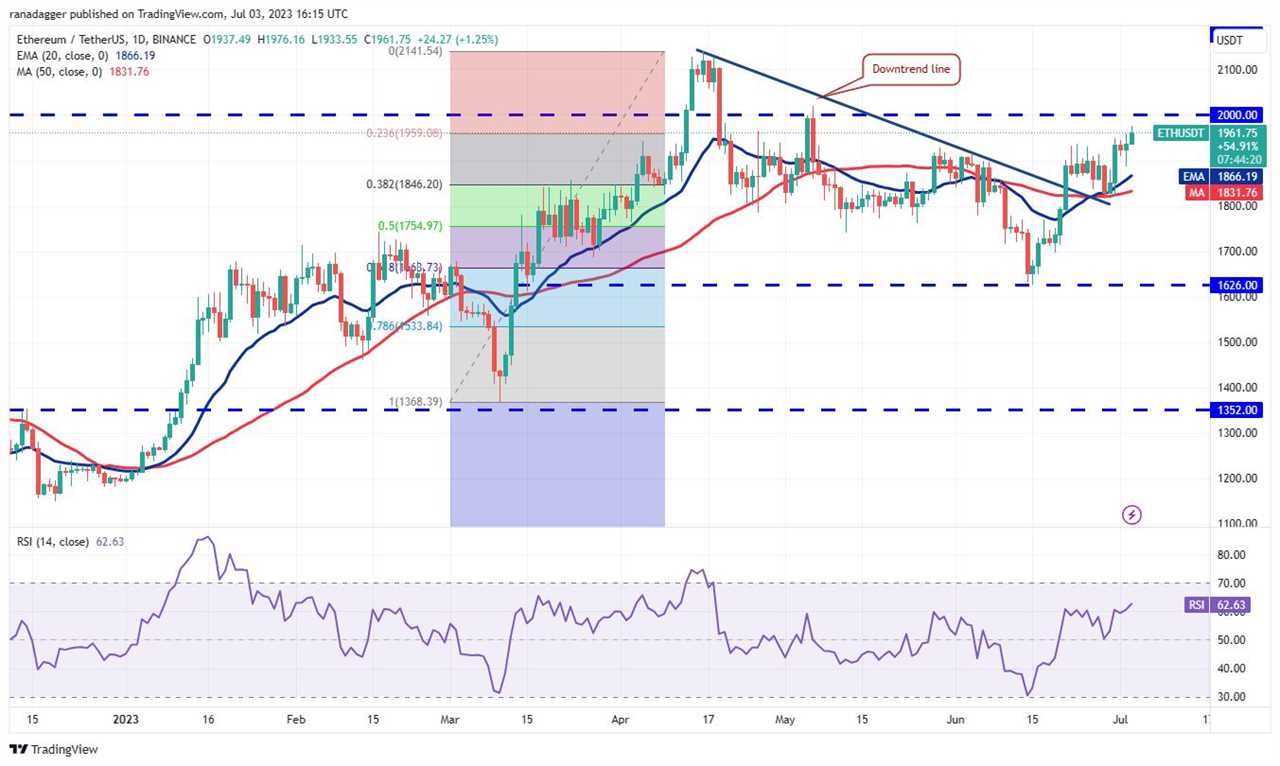
The 20-day EMA has turned up and the RSI is above 62, indicating that the bulls have the edge. There is a minor resistance at $2,000 but that is likely to be crossed. The ETH/USDT pair could then rally to the overhead resistance zone between $2,142 and $2,200. Sellers are expected to guard this zone with vigor.
This positive view will invalidate in the near term if the price turns down from $2,000 and slumps below the moving averages. The pair may then continue its range-bound action between $1,626 and $2,000 for some more time.
BNB price analysis
BNB (BNB) rose above the 20-day EMA ($245) on July 1, indicating that the selling pressure is reducing.
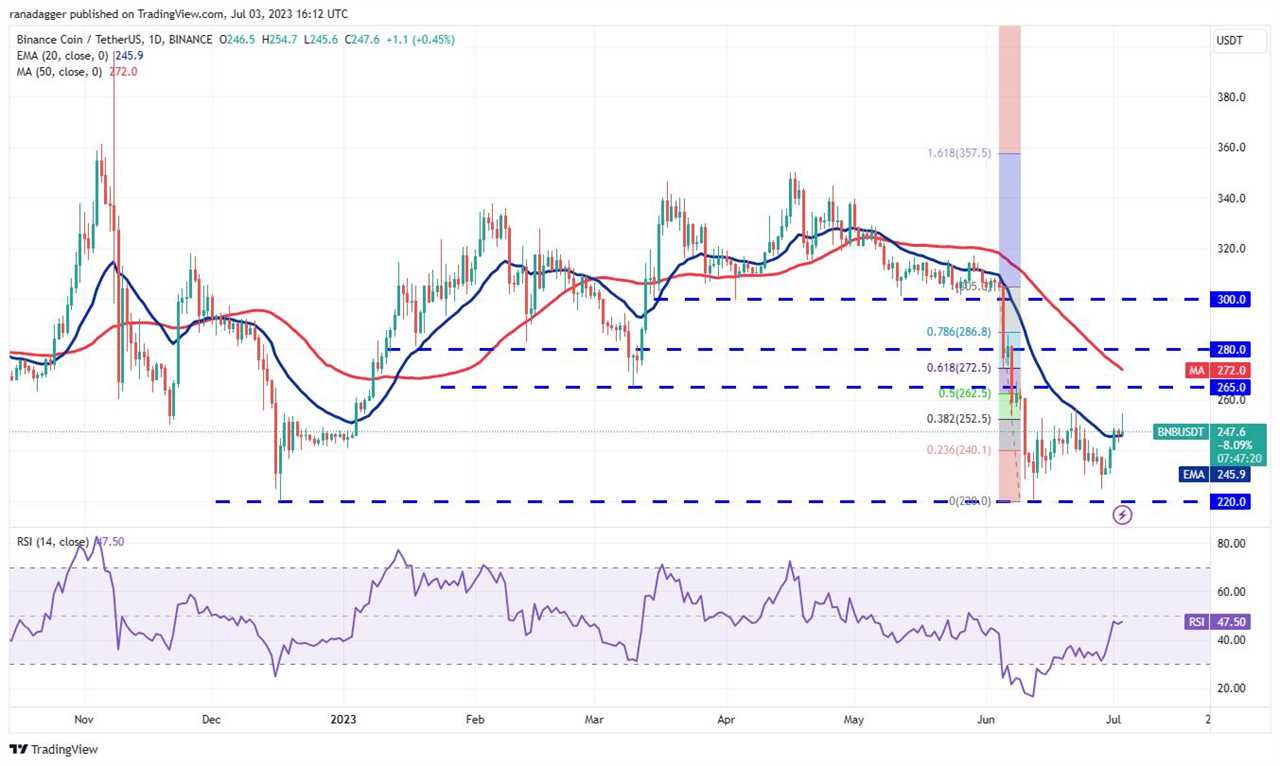
The 20-day EMA has flattened out and the RSI has climbed near the midpoint, indicating that the BNB/USDT pair may consolidate between $220 and $265 for a few more days. If the price sustains above the 20-day EMA, the pair may climb to the overhead resistance at $265. The bears are expected to fiercely guard this level.
Alternatively, if the price turns down and breaks below the 20-day EMA, it will suggest that every recovery attempt is being sold. The pair may then tumble to the strong support at $220.
XRP price analysis
The bulls are trying to propel XRP (XRP) above the 20-day EMA ($0.48) but the bears are aggressively defending the level.
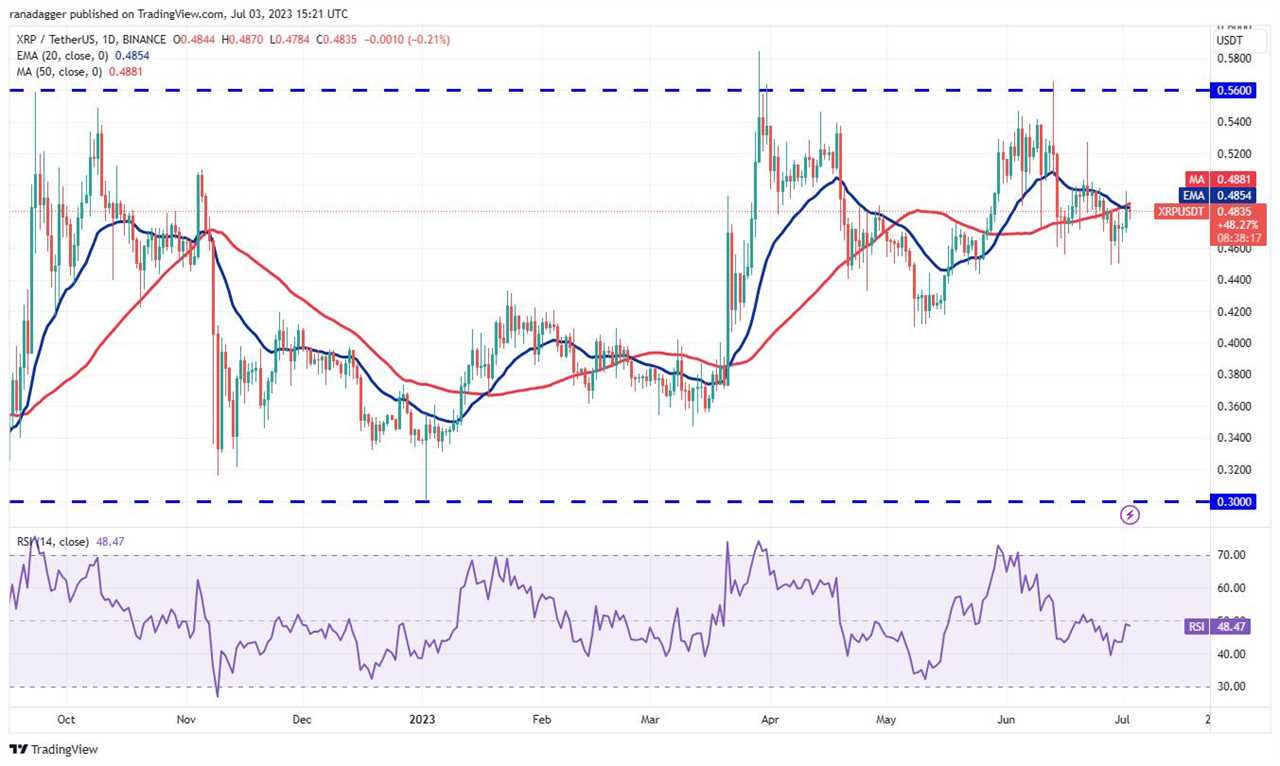
If buyers do not allow the price to slip much below the current level, it will increase the likelihood of a break above the 20-day EMA. The XRP/USDT pair may then start its northward march toward $0.53 and then $0.58.
Conversely, if the price turns down sharply from the current level, it will suggest solid selling near the 20-day EMA. The bears will have to sink the price below $0.44 to gain the upper hand. The pair may then tumble to $0.41.
Cardano price analysis
The bears successfully defended the $0.30 resistance on June 30 but they could not sustain Cardano (ADA) below the 20-day EMA ($0.29). This suggests that every minor dip is being purchased.
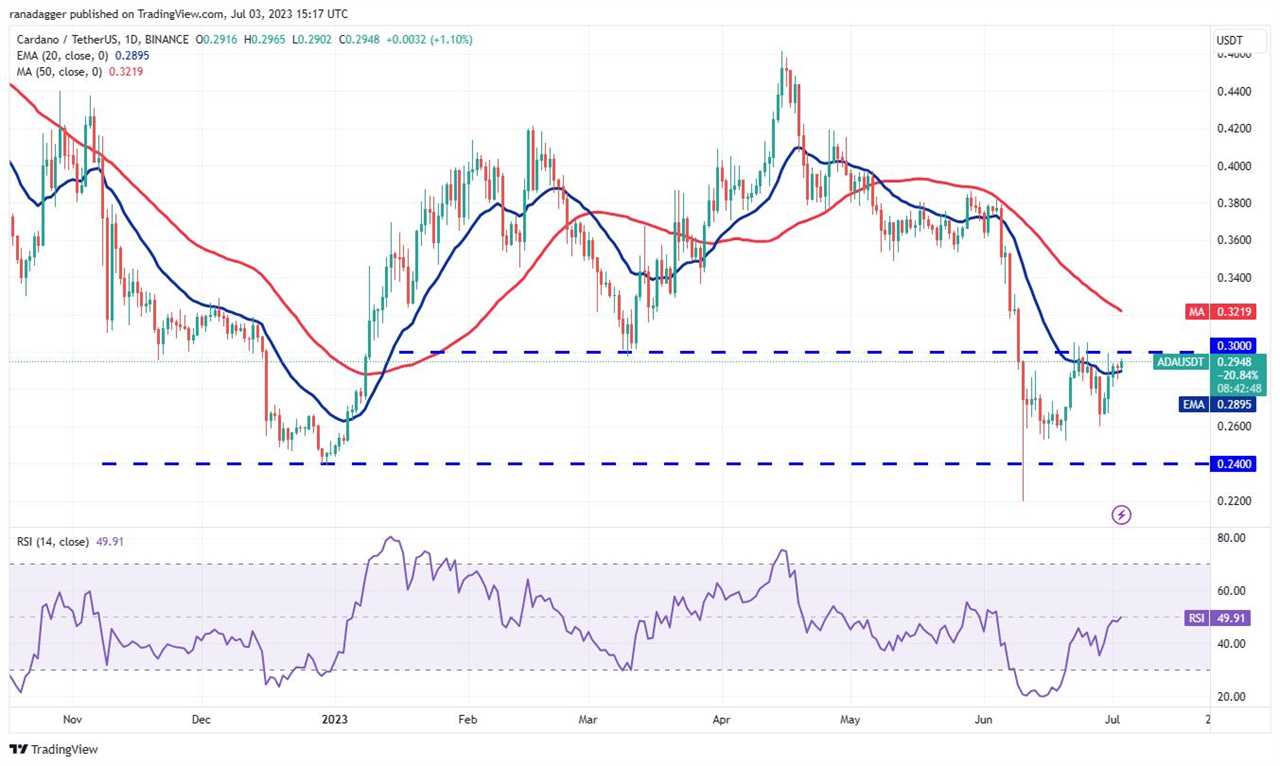
The 20-day EMA has flattened out and the RSI is near the midpoint, indicating that the bears may be losing their grip. Buyers will try to strengthen their position by kicking the price above $0.30. If they can pull it off, it will signal the start of a strong relief rally. The 50-day SMA ($0.32) may act as a barrier but it is likely to be overcome.
This positive view will invalidate in the near term if the price turns down sharply from the current level. That could keep the pair inside the $0.30 to $0.24 range for some more time.
Related: Bitcoin traders torn between breakout and $28K dip as BTC price stalls
Dogecoin price analysis
Dogecoin (DOGE) surged above the overhead resistance at $0.07 on July 1 but the long wick on the candlestick shows selling at higher levels.
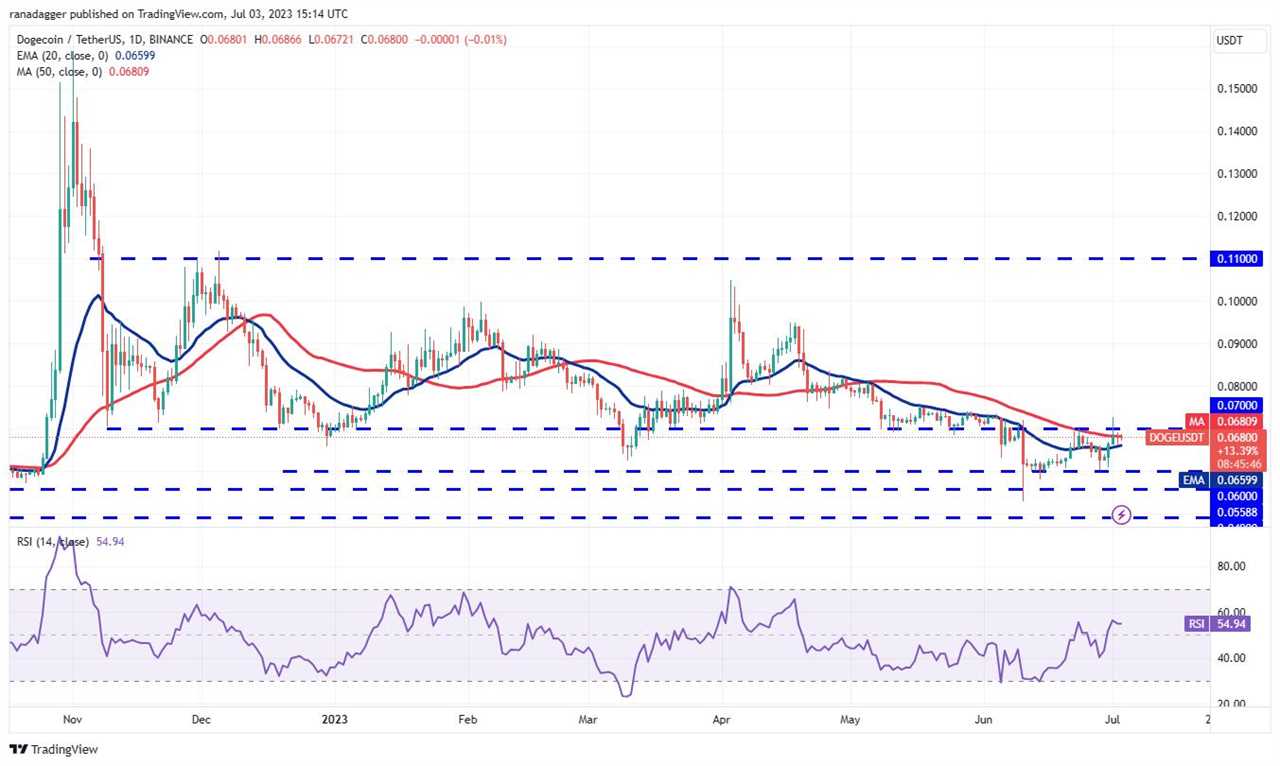
The failure to sustain the price above the overhead resistance indicates that the DOGE/USDT pair remains stuck inside the range between $0.06 and $0.07. Buyers will have to push and sustain the price above $0.07 to signal the start of a sustained recovery. The pair may then rally to $0.08.
On the downside, the $0.06 level remains the key support to watch out for. A break and close below this level could open the doors for a further decline to $0.05.
Solana price analysis
Solana (SOL) has been trading between the 20-day EMA ($17.61) and the downtrend line for the past three days. This suggests that the bears are selling near the downtrend line and the bulls are buying the dips.
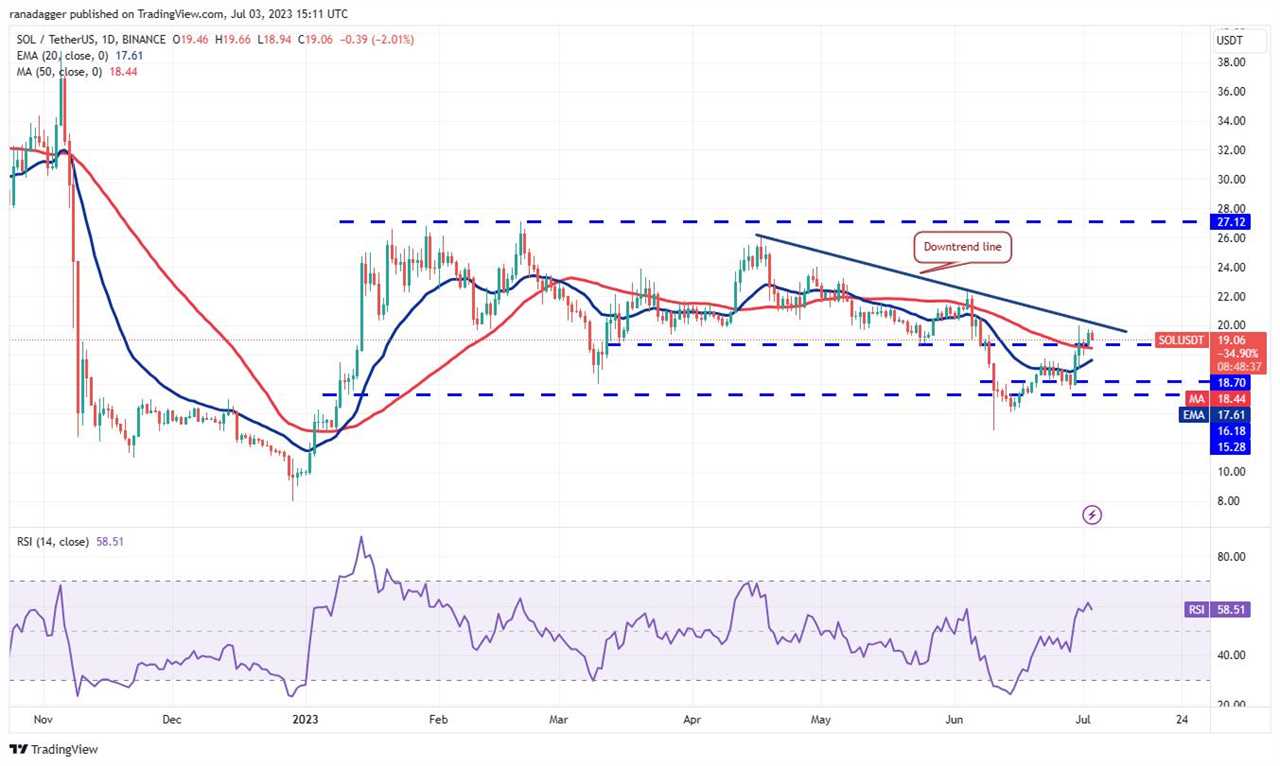
The 20-day EMA has started to slope up and the RSI has risen into the positive territory, indicating that bulls are in the driver’s seat. That increases the possibility of a break above the downtrend line. If that happens, the SOL/USDT pair could rally to $22 and thereafter to $24.
If the price turns down sharply from the current level and breaks below the 20-day EMA, it will suggest that the sentiment remains negative and traders are selling on rallies. That could sink the pair to the $16.18 to $15.28 support zone.
Litecoin price analysis
Litecoin (LTC) broke above the overhead resistance at $106 on June 30 and the bulls have managed to sustain the price above this level.
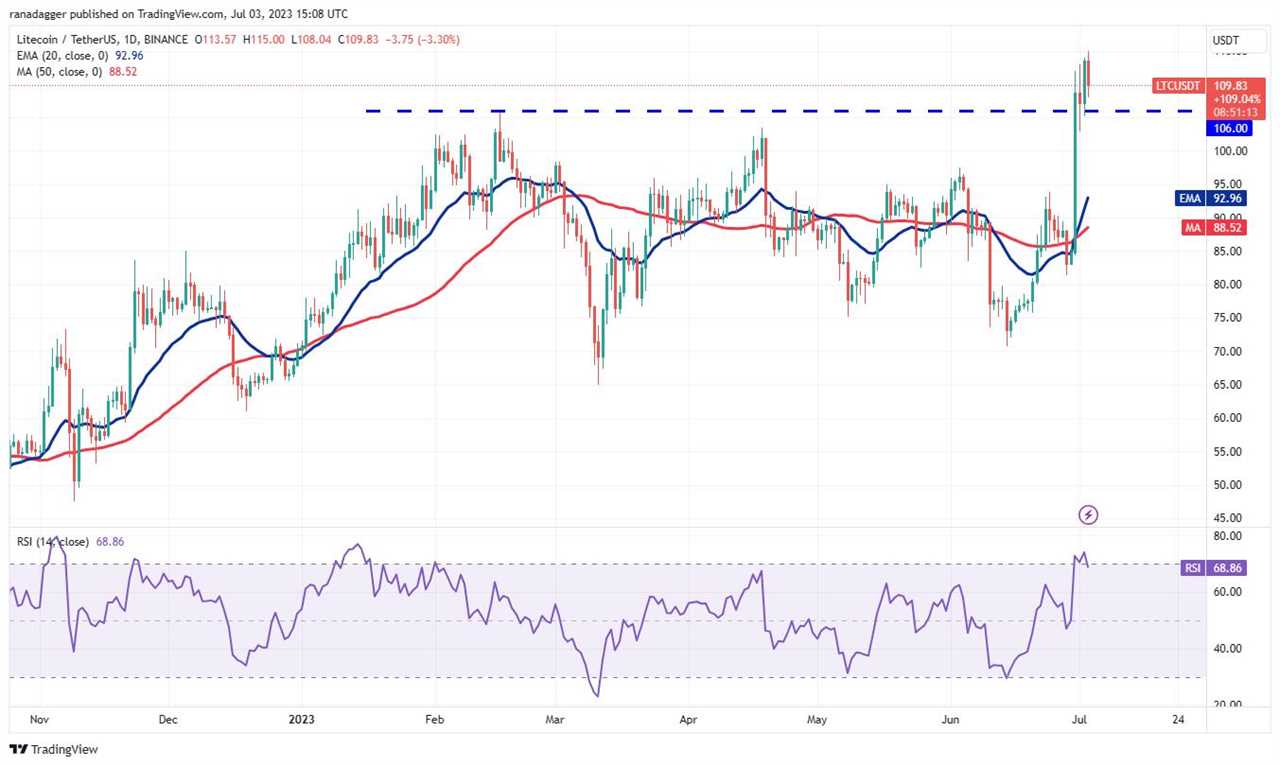
However, the bears have not given up and they are trying to stall the up-move at the next resistance at $115. If bulls sustain the price above $106, it will enhance the prospects of the continuation of the uptrend. The LTC/USDT pair may then soar to the overhead zone between $134 and $144.
The first support on the downside is $106. If this level gives way, it will indicate that the short-term bulls may be booking profits. That could drag the price down to the 20-day EMA ($93).
This article does not contain investment advice or recommendations. Every investment and trading move involves risk, and readers should conduct their own research when making a decision.
This article is for general information purposes and is not intended to be and should not be taken as legal or investment advice. The views, thoughts, and opinions expressed here are the author’s alone and do not necessarily reflect or represent the views and opinions of Cointelegraph.
Title: Price analysis 7/3: SPX, DXY, BTC, ETH, BNB, XRP, ADA, DOGE, SOL, LTC
Sourced From: cointelegraph.com/news/price-analysis-7-3-spx-dxy-btc-eth-bnb-xrp-ada-doge-sol-ltc
Published Date: Mon, 03 Jul 2023 21:14:49 +0100


