
Confidence in the United States financial system seems to be eroding fast with investors trying to find the next weakest link that is about to collapse. Bill Ackman, CEO of hedge fund management firm Pershing Square, cautioned that time was running out to fix the problem.
The U.S. equities markets have become vulnerable to adverse news on the regional banks as seen from the sell-off in the past three days. Compared to that, Bitcoin (BTC) has held strong and is hovering near its critical overhead resistance at $31,000.
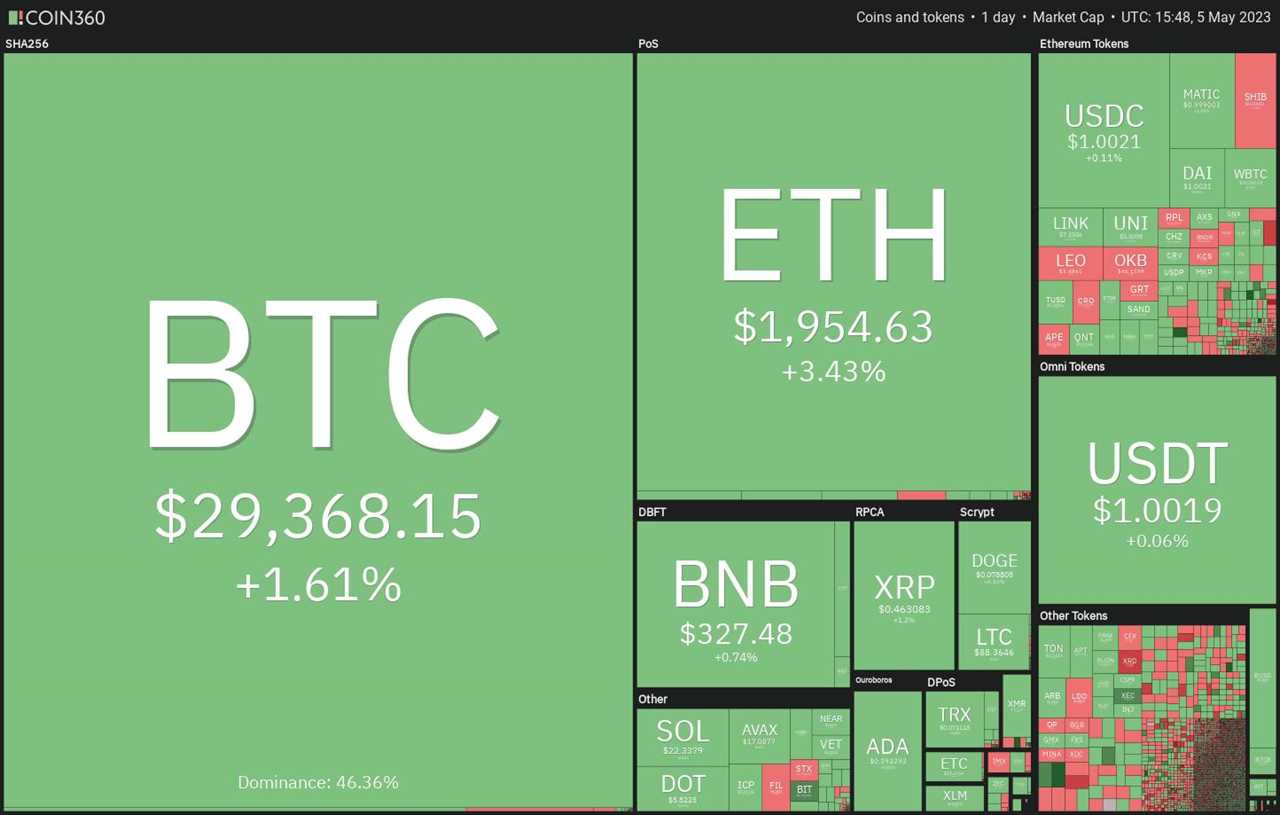
Bitcoin is not the only outperformer. Gold had risen close to its all-time high during the week. This shows that Bitcoin is currently behaving as a safe-haven asset and investors are adding it to their portfolio along with gold.
Could Bitcoin overcome the barrier at $31,000 and extend the up-move? Will the altcoins follow Bitcoin higher? Let’s study the charts of the top-10 cryptocurrencies to find out.
Bitcoin price analysis
Bitcoin continues to trade inside the symmetrical triangle pattern, indicating indecision among the bulls and the bears. Usually, the trend that was in force before the formation of the triangle tends to resume. That means the price is likely to break out to the upside.
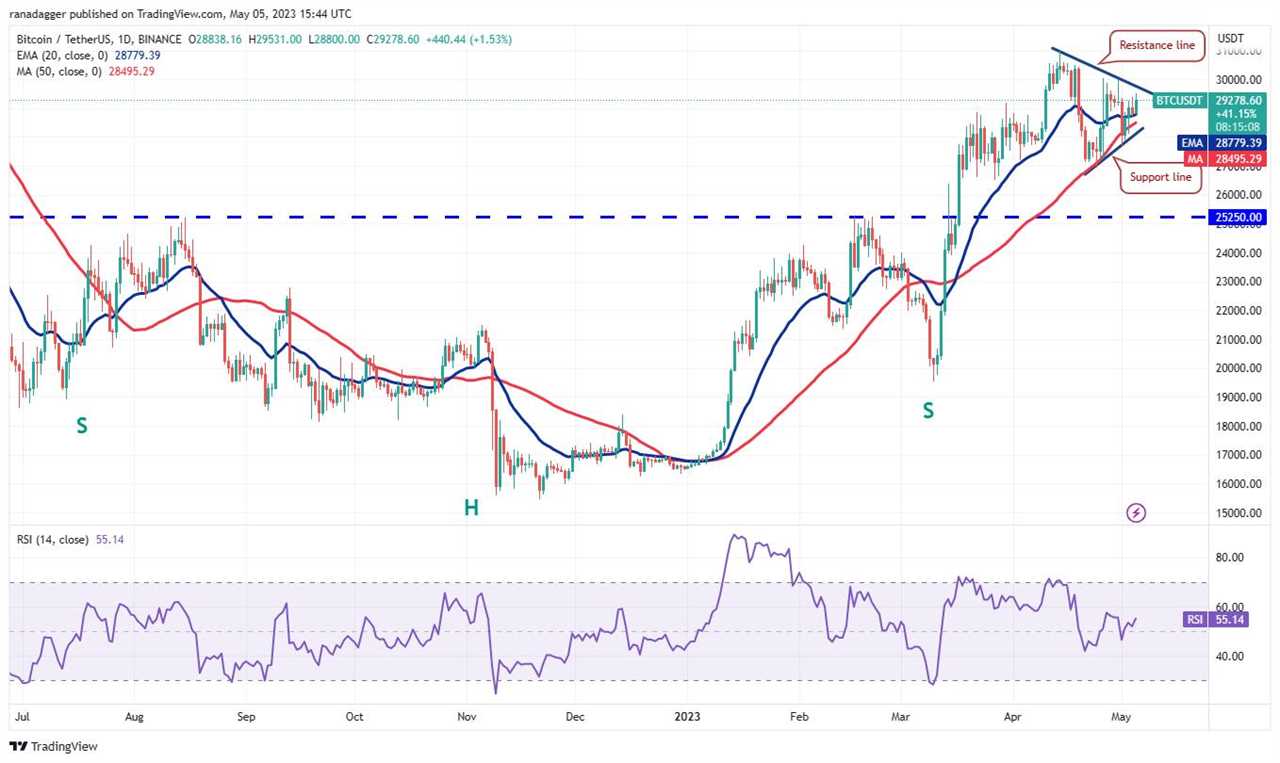
If the price closes above the triangle, the BTC/USDT pair could rally to $32,400. The bears are expected to mount a strong defense at this level because if the bulls drive the price above $32,400, the rally could reach $40,000.
Contrarily, if the price turns down from the resistance line, it will suggest that the pair may continue its random price action inside the triangle for a few more days.
A break and close below the triangle will indicate that the bears have overpowered the bulls. The pair may then tumble to $25,250.
Ethereum price analysis
The bulls pushed Ether (ETH) above the resistance line of the symmetrical triangle pattern on May 5. This shows that the bulls absorbed the supply and have come out on top.
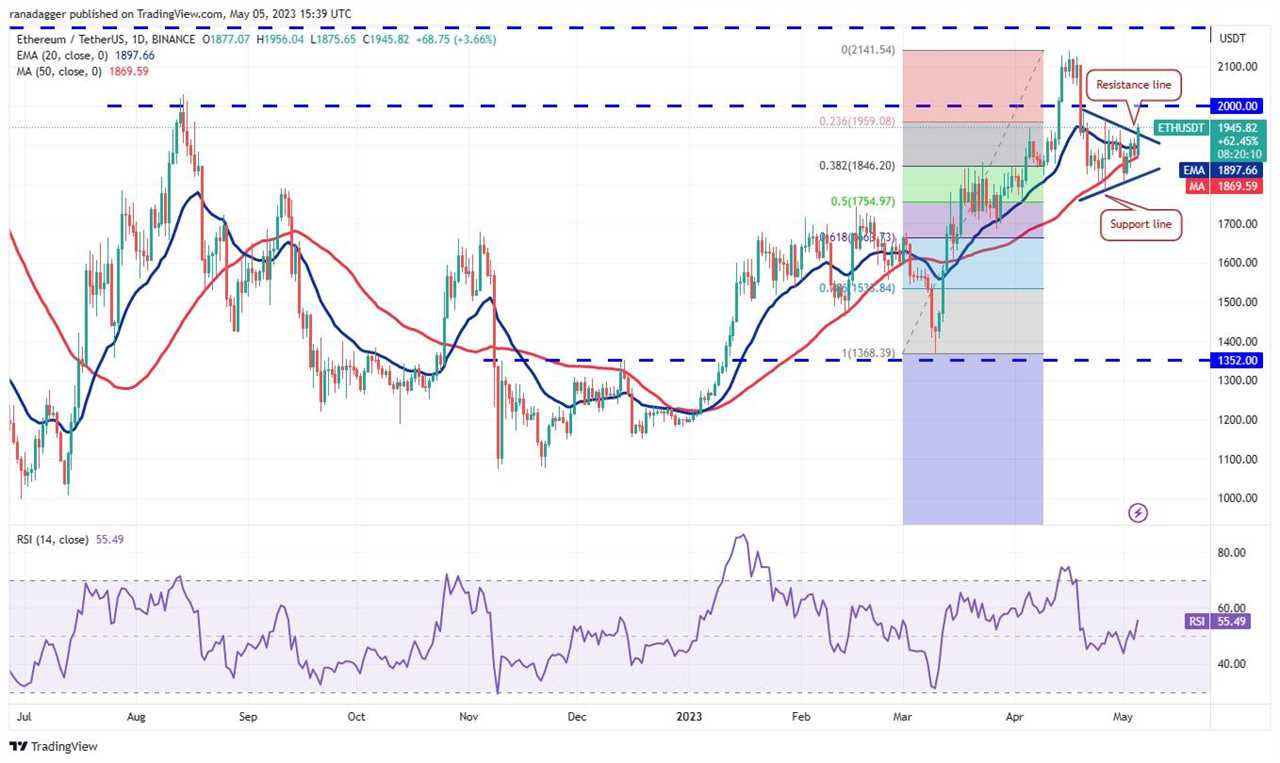
If buyers sustain the price above the triangle, the ETH/USDT pair could first rise to $2,000 and then attempt a rally to $2,200. The bears may aggressively defend this level because if they fail to do that, the pair may skyrocket toward $3,000.
Contrary to this assumption, if the price turns down from the current level and re-enters the triangle, it will suggest that the breakout may have been a bull trap. The pair may then once again drop to the support line. A break below this level may sink the pair to the target objective of $1,619.
BNB price analysis
BNB (BNB) is witnessing a tough battle between the bulls and the bears near the support line of the symmetrical triangle pattern.

The flattish 20-day EMA ($326) and the RSI near the midpoint do not give a clear advantage either to the bulls or the bears. If the price breaks above the 20-day EMA, the BNB/USDT pair may continue to oscillate inside the triangle for some more time.
A break below the triangle will indicate that bears have seized control. That is likely to start a downward move to $300 and then to the pattern target of $280. If bulls want to gain the upper hand, they will have to propel the price above the triangle. That will clear the path for a possible rally to $350 and then $400.
XRP price analysis
XRP (XRP) formed an inside-day candlestick pattern on May 4 and a Doji candlestick pattern on May 5. This suggests that the bulls and the bears are playing it safe and are not waging large bets.
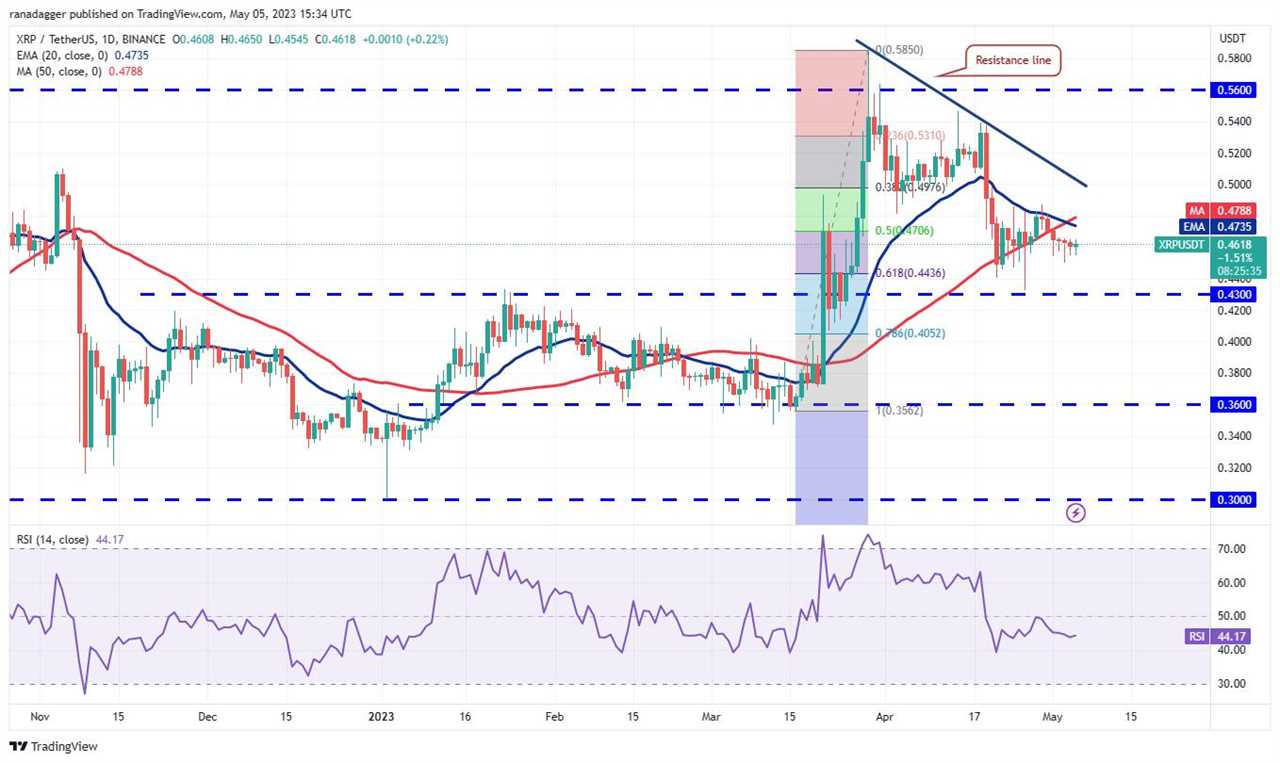
The moving averages have completed a bearish crossover and the RSI is in the negative territory, signaling that bears have a slight edge. The bears will try to sink the price to the strong support at $0.43.
Conversely, if the price turns up from the current level and breaks above the 20-day EMA ($0.47), it will indicate solid buying at lower levels. The XRP/USDT pair may then rise to the resistance line. Buyers will have to overcome this resistance to open up the possibility of a rally to $0.54.
Cardano price analysis
Cardano (ADA) dipped below the 50-day simple moving average ($0.38) on May 3 and 5 but the long tail on the candlestick shows that the bulls are aggressively defending the support near $0.37.
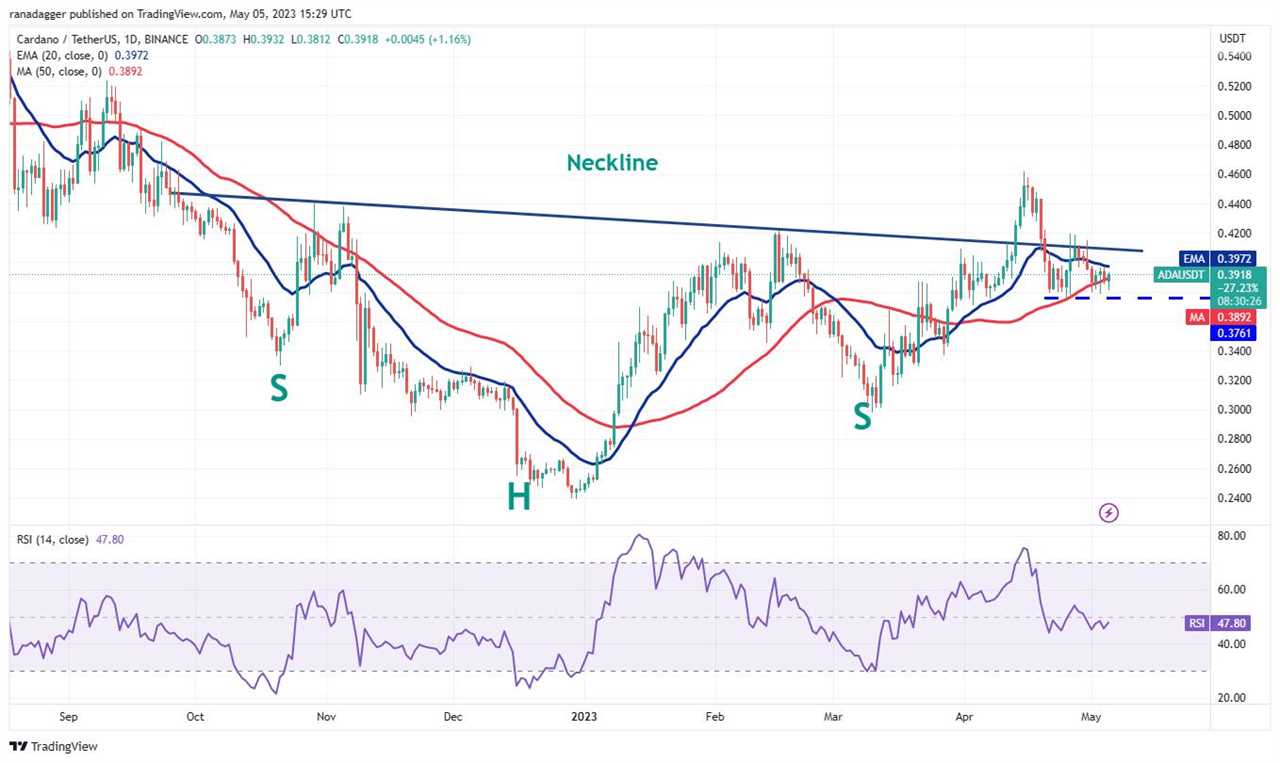
Buyers tried to push the price above the 20-day EMA ($0.39) on May 4 but the bears did not budge. The downsloping 20-day EMA and the RSI just below the midpoint suggest a minor advantage to the bears. If the price turns down and crumbles below $0.37, the selling could intensify and the ADA/USDT pair may descend to $0.33 and then $0.30.
If bulls want to prevent this decline, they will have to quickly propel the price above the neckline of the inverse head and shoulders pattern. That could increase the chances of a rally to $0.46 and later $0.52.
Dogecoin price analysis
The bulls have managed to keep Dogecoin (DOGE) above the immediate support near $0.08 but they have failed to achieve a meaningful bounce off it. This suggests that demand dries up at higher levels.

A tight consolidation near a strong support generally resolves to the downside. The downsloping 20-day EMA ($0.08) and the RSI in the negative zone also indicate that the path of least resistance is to the downside.
If the support near $0.08 gives way, the DOGE/USDT pair may tumble to the next major support at $0.07. This negative view will invalidate in the near term if buyers thrust DOGE price above the downtrend line.
Polygon price analysis
Polygon (MATIC) attempted to rise above the 20-day EMA ($1.02) on May 3 and 4 but the bears successfully protected the level.

The downsloping moving averages and the RSI near 43 suggest that the bears are in command. If the price turns down and breaks below $0.94, the MATIC/USDT pair will complete a descending triangle pattern. That could start a down move toward $0.69.
Instead, if the price turns up and rises above the 20-day EMA, it will suggest that the lower levels continue to attract buyers. The pair could then rally to the resistance line where the bears are again likely to sell aggressively.
Related: SUI price drops 70% from market debut top amid excessive supply concerns
Solana price analysis
Solana (SOL) has been trading in a tight range for the past three days. This suggests a state of indecision among the buyers and sellers.

The flattish moving averages and the RSI near the midpoint suggest that the SOL/USDT pair may remain stuck inside the large range between $15.28 and $27.12 for some time. If the price slips and sustains below the 50-day SMA ($21.90), it will suggest that the bears have the upper hand in the near term. The pair could then slide to $18.70.
On the other hand, if buyers kick the price above the 20-day EMA, the pair may start its march toward $24 and then $27.12.
Polkadot price analysis
Sellers yanked Polkadot (DOT) below the $5.70 support on May 3 but the long tail shows solid buying at lower levels. The bulls again thwarted attempts by the bears to break the support on May 4 and 5.

The repeated failure to sustain the price below $5.70 may attract buyers. They will then try to push the price above the 20-day EMA ($5.96). If they do that, the DOT/USDT pair could rise to the 50-day SMA ($6.18). Buyers will have to overcome this hurdle to gain the upper hand in the near term. The next target on the upside is $7.
Alternatively, if the price turns down from the 20-day EMA, it will suggest that bears continue to sell on minor rallies. The sellers will then again attempt to tug the price below $5.70 and challenge the crucial support at $5.15.
Litecoin price analysis
The long tail on Litecoin’s (LTC) May 3 and 5 candlestick shows that the bulls continue to guard the $85 level with vigor but they are struggling to clear the overhead hurdle at the moving averages.

The LTC/USDT pair is stuck in a tight range as the bulls are buying on dips while the bears are selling on rallies. The 20-day EMA ($89) is sloping down and the RSI is just below the midpoint, suggesting a minor advantage to the bears. A break below the $85 level will indicate that bears have taken control. The pair may then collapse to $75.
Instead, if buyers propel the price above the moving averages, the pair could rally to the overhead resistance at $96. If the price turns down from this level, it will point to a possible range-bound action between $85 and $96 for a few days.
This article does not contain investment advice or recommendations. Every investment and trading move involves risk, and readers should conduct their own research when making a decision.
Title: Price analysis 5/5: BTC, ETH, BNB, XRP, ADA, DOGE, MATIC, SOL, DOT, LTC
Sourced From: cointelegraph.com/news/price-analysis-5-5-btc-eth-bnb-xrp-ada-doge-matic-sol-dot-ltc
Published Date: Fri, 05 May 2023 17:32:30 +0100


