
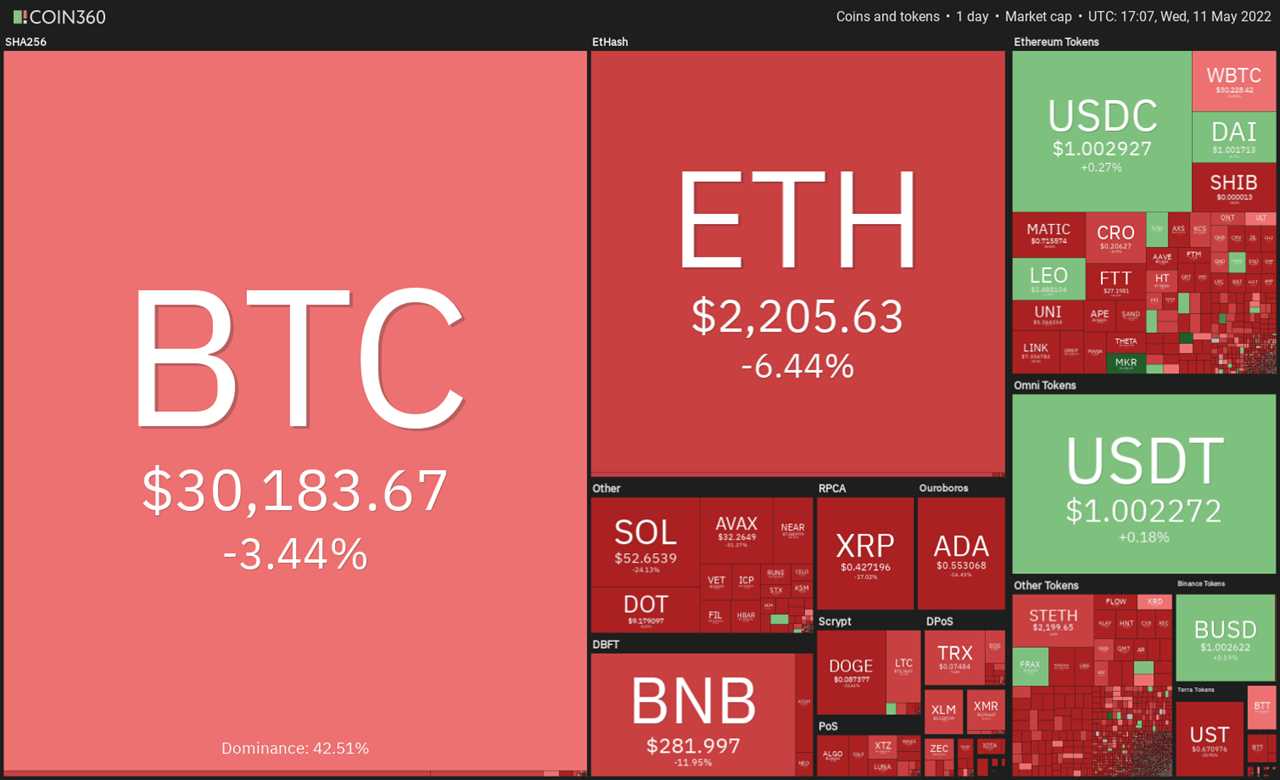
The crisis with Terra’s stablecoin TerraUSD (UST) and the freefall in Terra’s LUNA token has dented crypto sentiment further. Although Terraform Labs CEO Do Kwon announced a relief plan, the community does not seem too hopeful about the revival.
Another hindrance to a quick improvement in sentiment is that the United States Consumer Price Index soared 8.3% from a year ago, outpacing estimates by 0.2%. Although the numbers are a tad bit lower than March’s 8.5% print, the slow deceleration suggests no respite from more tightening by the U.S. Federal Reserve.
Although the screen looks scary during capitulation, it also offers one of the best times to go against the herd and accumulate fundamentally strong cryptocurrencies at a bargain. Traders should not be in a hurry to catch a falling knife but wait for the price to stabilize and the capitulation to end before buying in a phased manner.
What are the key levels of Bitcoin (BTC) and major altcoins that could attract buyers? What are the key resistance levels on the upside that may suggest a potential trend change? Let’s study the charts of the top-10 cryptocurrencies to find out.
BTC/USDT
Bitcoin fell sharply on May 9 and attempted a recovery from the psychological level at $30,000 on May 10. The long wick on the day’s candlestick shows that bears are not willing to ease off and they continue to sell on minor rallies.
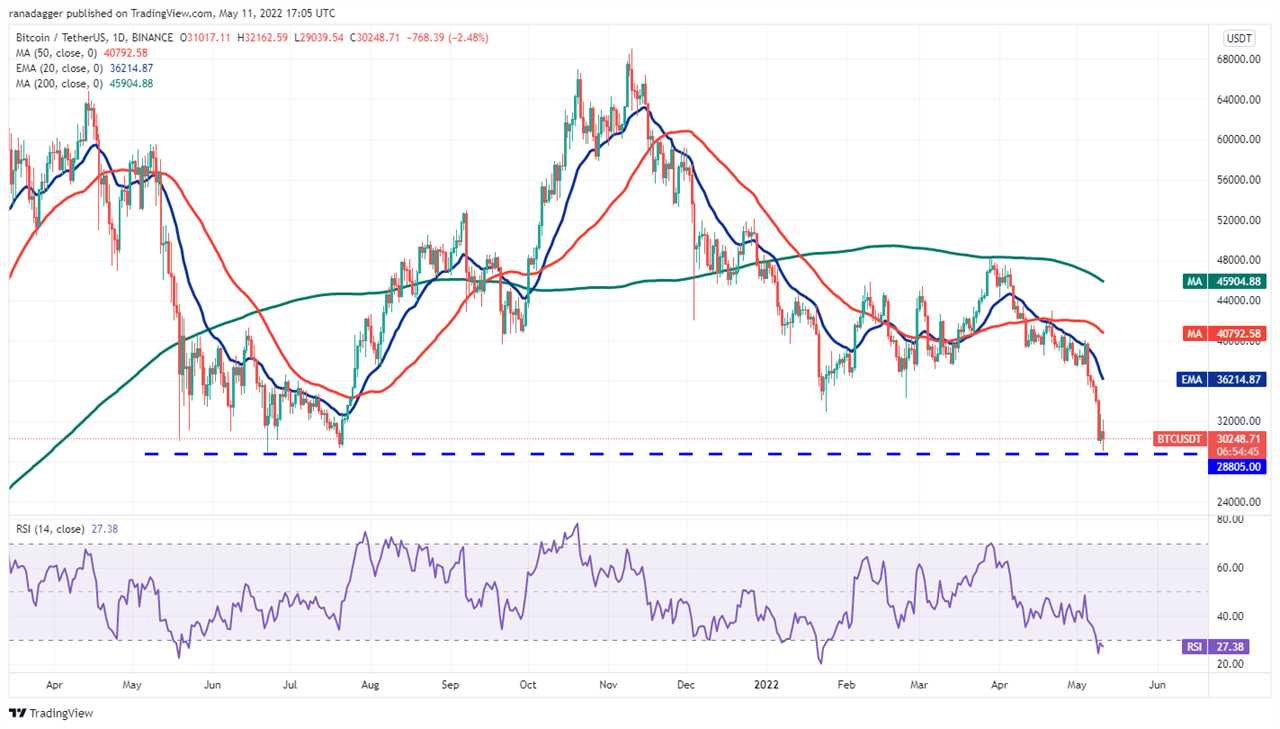
The bears tried to build upon their advantage on May 11 but the bulls are defending the critical level at $28,805 with all their might. This is an important level to watch out for because if it cracks, the selling could intensify. The BTC/USDT pair could then slide to $25,000 and later to $20,000.
Although downsloping moving averages indicate advantage to sellers, the relative strength index (RSI) in the oversold territory suggests that a relief rally or consolidation is possible.
If the price rises from the current level, it could reach the 20-day exponential moving average (EMA) ($36,214). This is an important level to keep an eye on because if the price turns down from it, the bears will again attempt to sink the pair below $28,805.
Alternatively, if bulls push the price above the 20-day EMA, the pair could rally to the 50-day simple moving average (SMA) ($40,792).
ETH/USDT
Ether (ETH) has reached a strong support level at $2,159. The bulls are likely to mount a strong defense at this level because if the support cracks, the selling could pick up momentum.
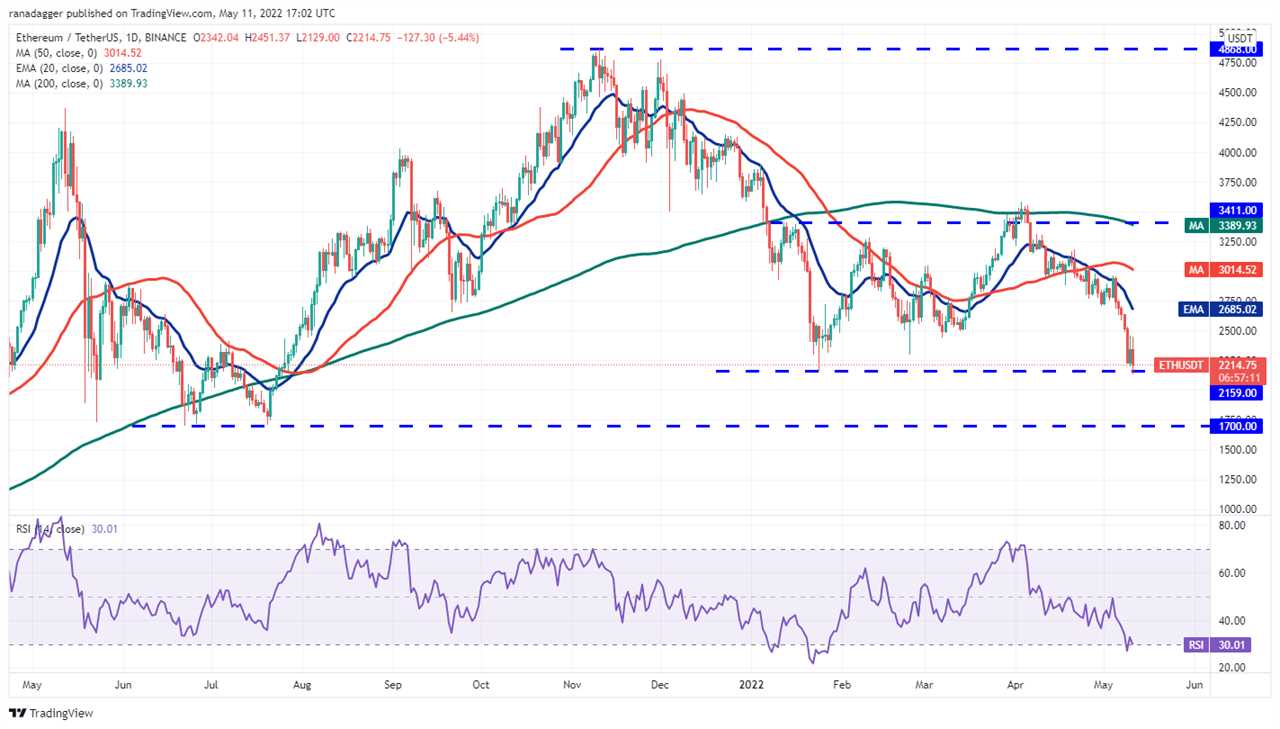
If the bounce sustains, the bulls will try to push the price to the 20-day EMA ($2,698). In a downtrend, the bears usually try to stall the relief rallies at the 20-day EMA, hence this becomes an important level to watch out for.
If the price turns down from the 20-day EMA, it will suggest that sentiment remains negative and traders continue to sell on rallies. The bears will then again attempt to sink the ETH/USDT pair below $2,159. If they succeed, the pair could plummet to $2,000 and later to $1,700.
BNB/USDT
Binance Coin (BNB) witnessed a sharp fall on May 9 and broke below the strong support at $320. The bulls tried to push the price back above the breakdown level on May 10 but the bears did not relent.
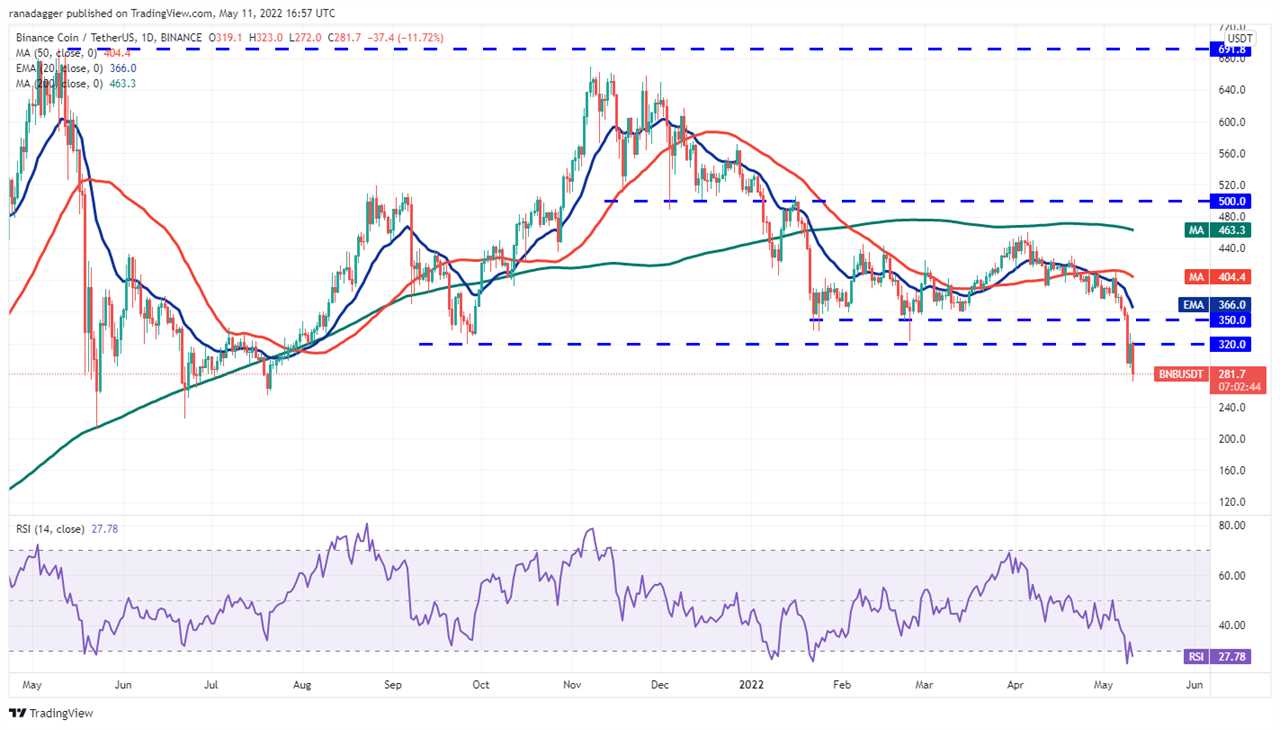
The bears resumed their selling on May 11 and pulled the BNB/USDT pair below the immediate support at $289. If sellers sustain the price below $289, the pair pick up momentum and plummet to $250 and later to $225. The buyers are expected to mount a strong defense in this support zone.
Alternatively, if the price turns up from the current level, the bulls will again try to propel and sustain the pair above $320. If they succeed, it will indicate that the markets have rejected the lower levels. The pair could then rise to $350.
XRP/USDT
Ripple (XRP) witnessed a tough battle between the bulls and the bears near the $0.50 level. Although bears pulled the price below $0.50 on May 9, the bulls reclaimed the level on May 10.
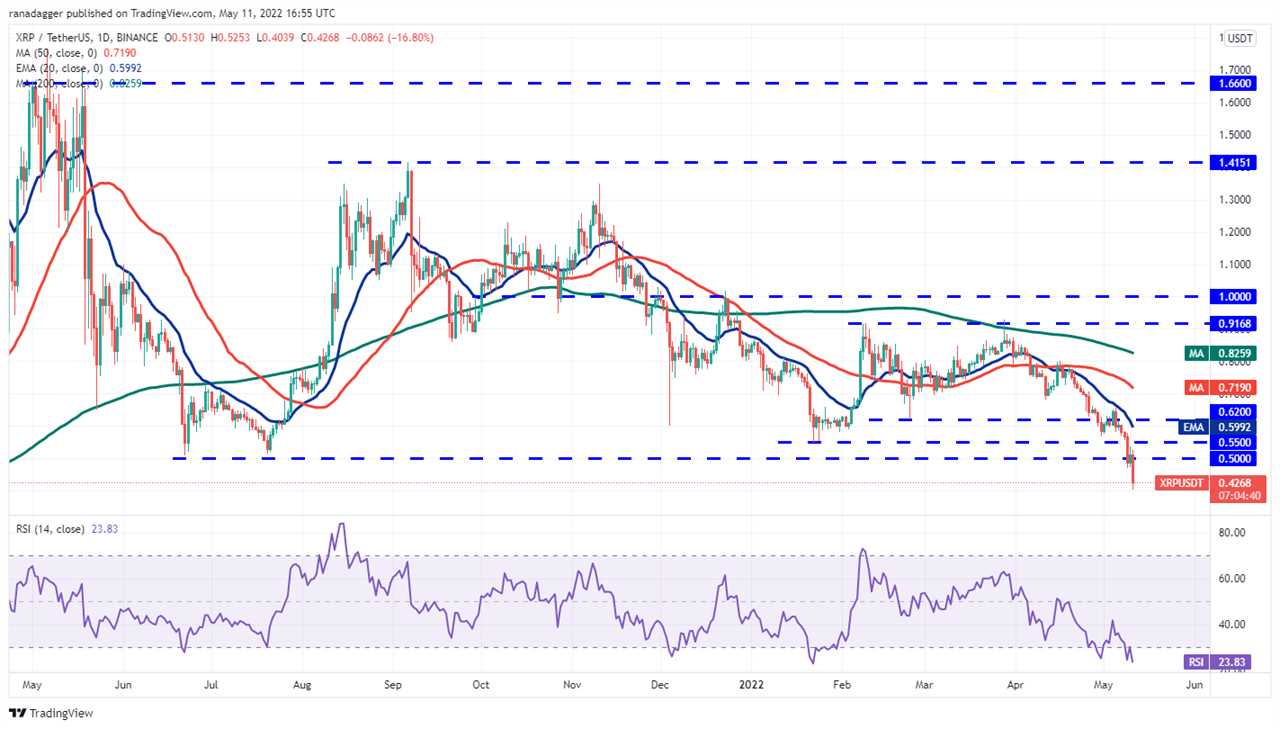
The bears finally overpowered the bulls on May 11 and resumed the downtrend. The XRP/USDT pair dropped to the strong support at $0.40 where the bulls are attempting to arrest the decline.
If the price turns up from the current level, the bulls will again attempt to propel the pair above the overhead resistance zone between $0.50 and $0.55. Conversely, if the price slips below $0.40, the pair could witness further selling and drop to $0.34.
ADA/USDT
Cardano (ADA) tumbled below the strong support at $0.74 on May 9, indicating the resumption of the downtrend. The buyers attempted a recovery on May 10 but failed to hold onto higher levels.
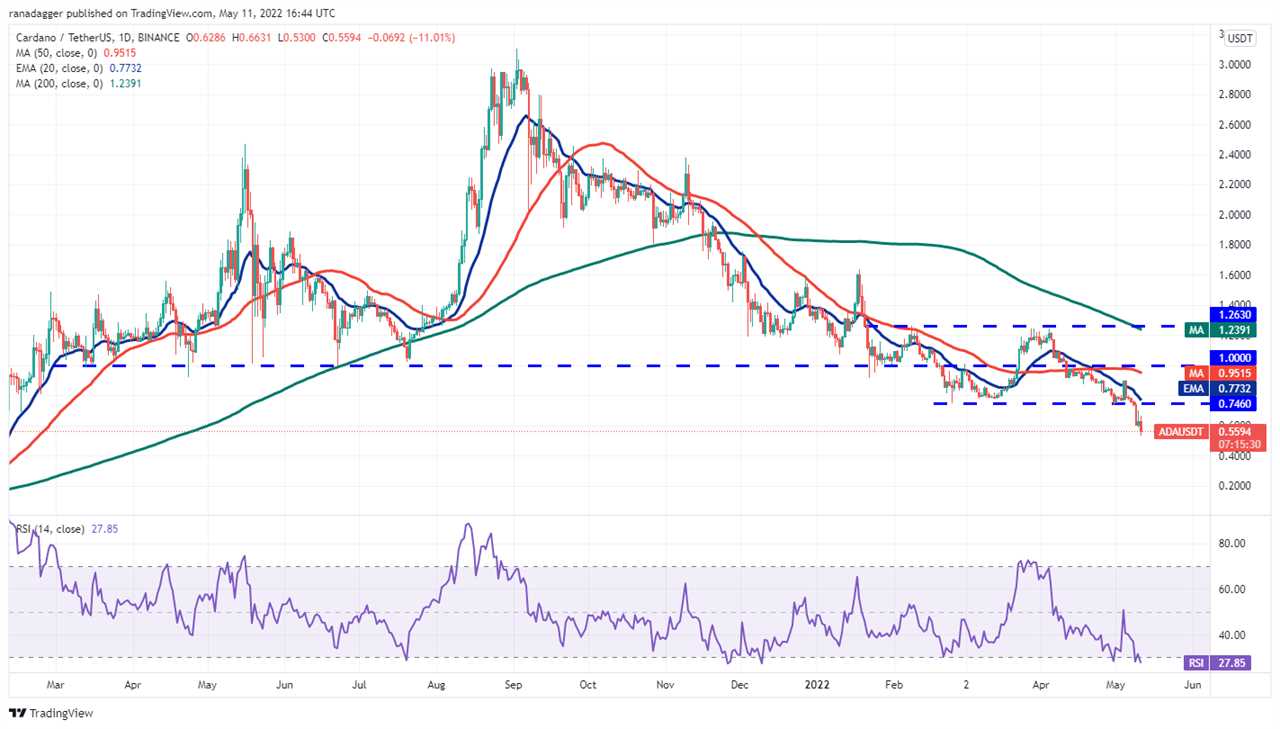
The selling resumed on May 11 and the ADA/USDT pair dipped below the immediate support at $0.58. If the price sustains below this level, the pair could drop to the psychological level at $0.50 and thereafter to $0.40.
On the contrary, if the price rises from the current level, the bulls will try to push the pair back above the breakdown level at $0.74 and the 20-day EMA ($0.77). If they succeed, the recovery could pick up momentum and the pair may rally to the critical resistance at $1.
SOL/USDT
Solana (SOL) dropped and closed below the strong support at $75 on May 9. This signaled the start of the next leg of the downtrend. The bulls tried to trap the aggressive bears by pushing the price back above the breakdown level at $75 on May 10 but the bears held their ground.
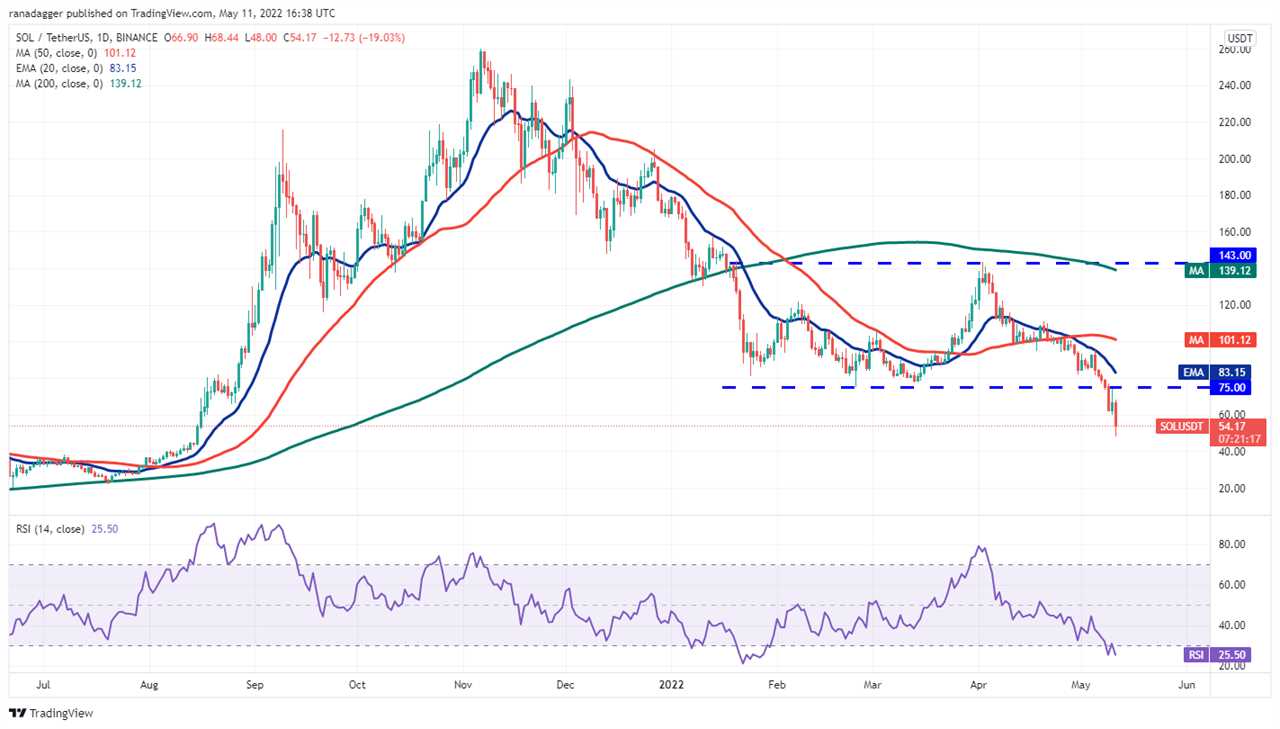
The selling resumed on May 11 and the bears pulled the price below the psychological support at $50. If the price sustains below $50, the SOL/USDT pair could extend its decline to $44 and thereafter to $40.
Conversely, if the price turns up from the current level, the bulls will make another attempt to propel the pair above $75. If they manage to do that, the pair could rally to the 20-day EMA ($83).
This is an important level to watch out for because a break and close above it could signal that the bulls are back in the game. The pair could then rally to the 50-day SMA ($101).
DOGE/USDT
Dogecoin (DOGE) broke below the support at $0.12 on May 9 and nosedived to the psychological level at $0.10. The buyers tried to start a recovery on May 10 but hit a wall at the breakdown level at $0.12.
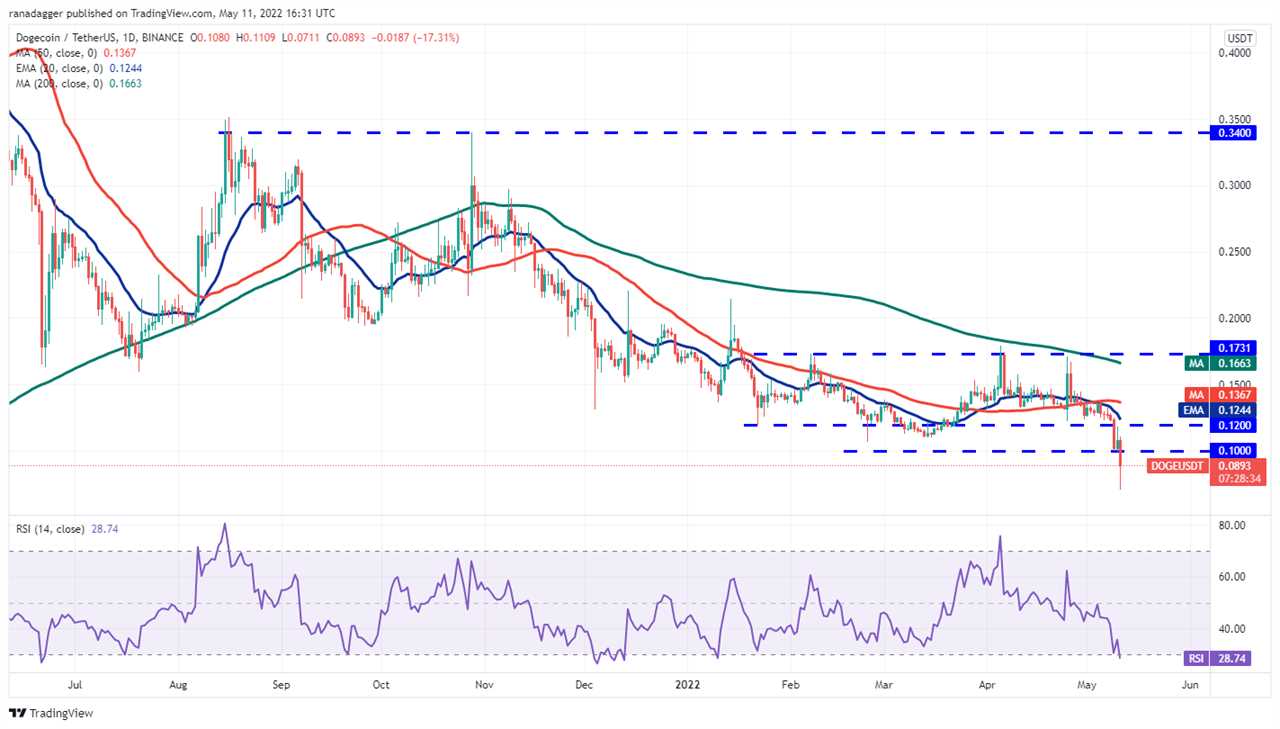
The bears continued their selling and pulled the price below the crucial support at $0.10 on May 11. If the price sustains below $0.10, the DOGE/USDT pair could extend its decline to the strong support zone between $0.06 and $0.04. The bulls are likely to defend this support zone with vigor.
If bulls push the price back above $0.10 quickly, it will suggest strong accumulation at lower levels. The buyers will then try to drive the pair above the 20-day EMA ($0.12). If they succeed, it will suggest that the bears may be losing their grip.
Related: Avalanche drops 30% on fears Terra's LFG will dump AVAX next
DOT/USDT
Polkadot (DOT) plunged to psychological support at $10 on May 9 and attempted a recovery on May 10 but the long wick on the day’s candlestick shows selling at higher levels.
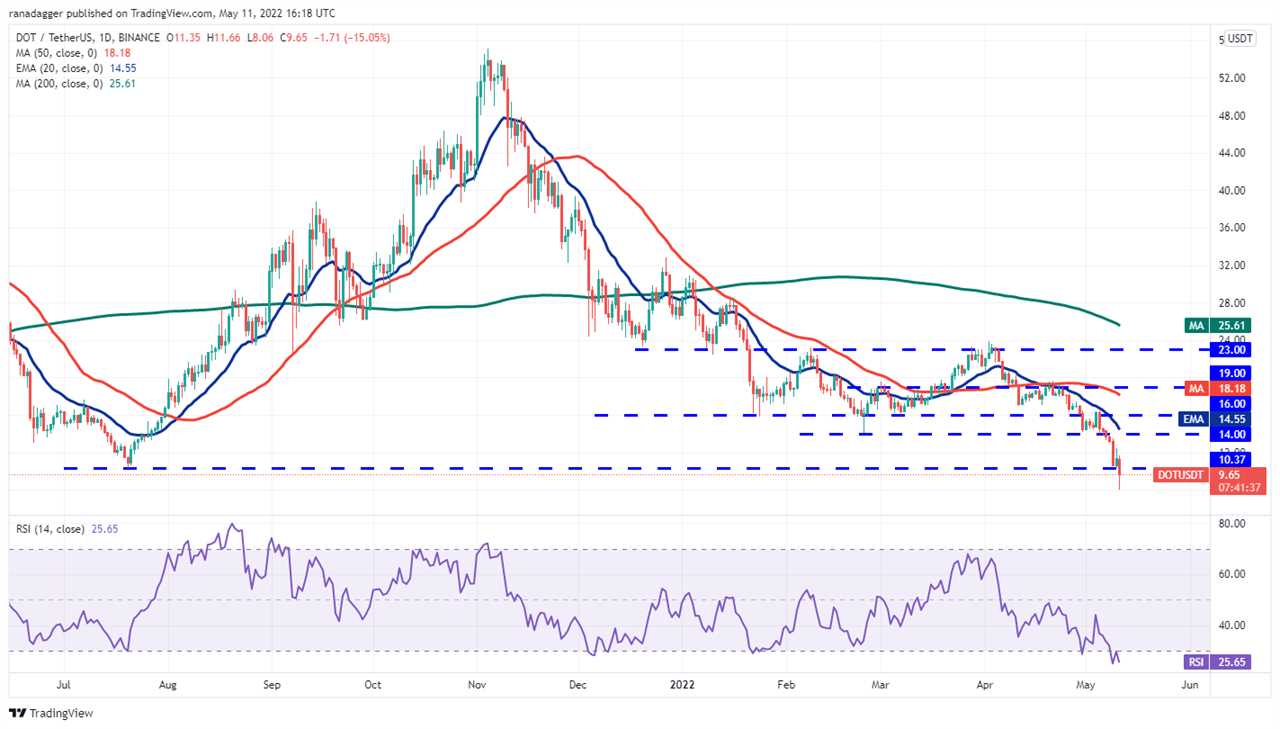
The selling resumed on May 11 and bears pulled the price below the strong support at $10. If bears sustain the breakdown, it will suggest the start of the next leg of the downtrend. The DOT/USDT pair could then extend its decline to $7.
Conversely, if the price turns up from the current level and rises back above $10, it will indicate strong buying at lower levels. If bulls sustain the price above $10, the possibility of a rally to $14 increases.
AVAX/USDT
Avalanche (AVAX) plunged below the critical support at $51 on May 9 signaling the resumption of the downtrend. The buyers tried to push the price back above the breakdown level on May 10 but the long wick on the candlestick shows that bears flipped the $51 level into resistance.
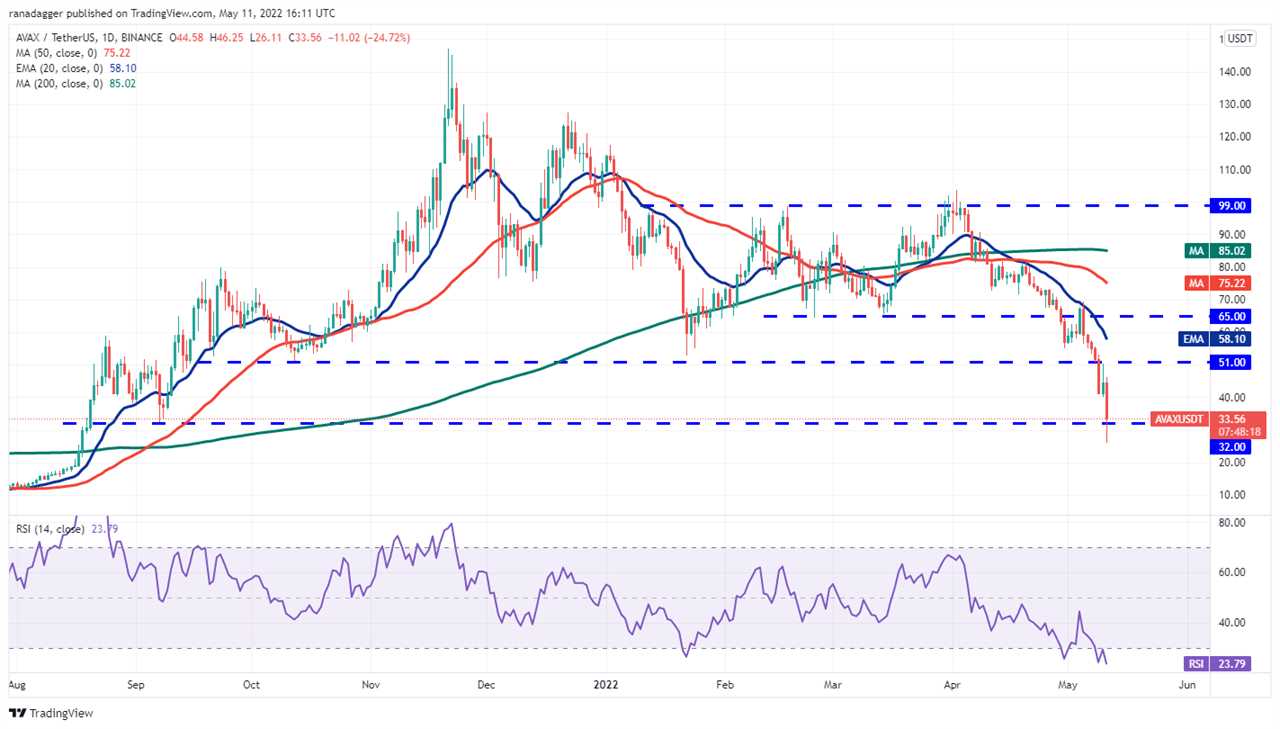
The AVAX/USDT pair resumed its decline on May 11 and dropped below the crucial support at $32 but the long tail on the candlestick shows strong buying at lower levels. The bulls are expected to defend the $32 level aggressively because if the support gives way, the selling could intensify and the pair may drop to $18.
If the price rises from the current level, the buyers will again try to push the pair to the breakdown level at $51. A break and close above this level could be the first sign that the downtrend may be weakening.
SHIB/USDT
Shiba Inu (SHIB) had been declining gradually for the past few days. The momentum picked up on May 9 and the price slipped below the critical support at $0.000017. This signaled the resumption of the downtrend.
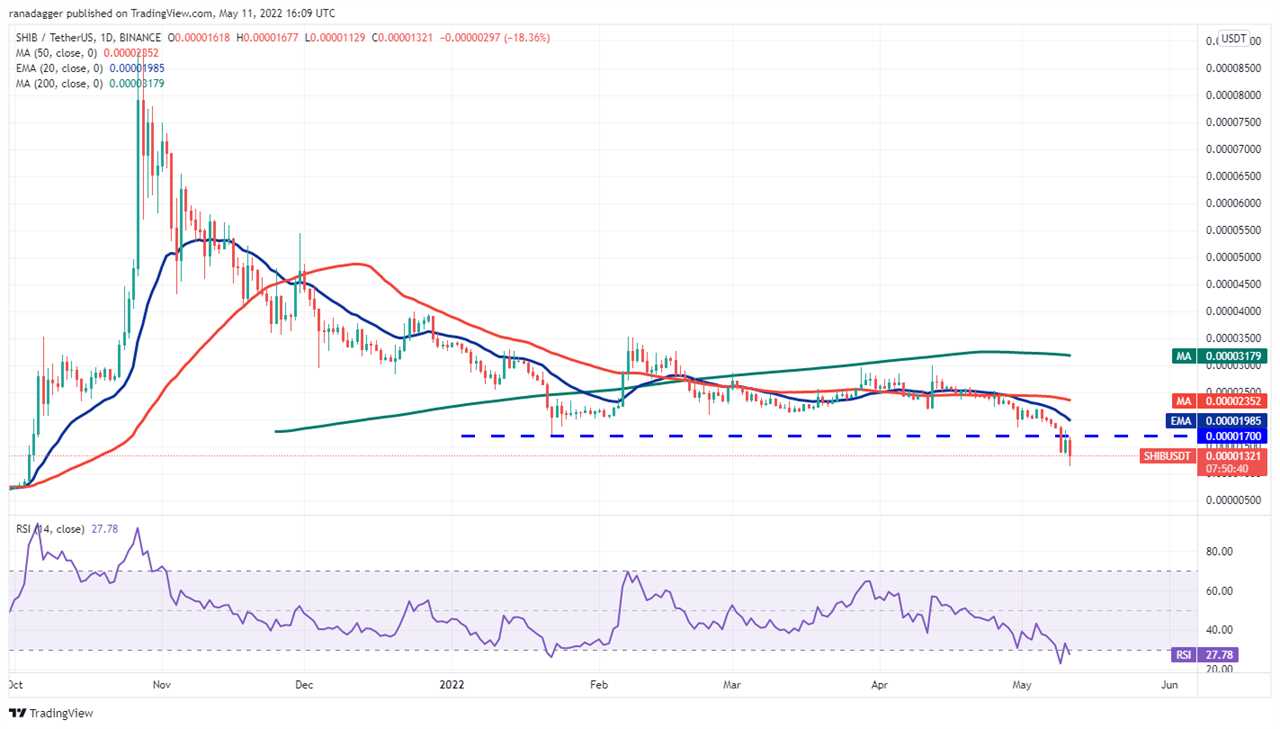
The buyers bought the dip near $0.000013 and pushed the price back above the breakdown level at $0.000017 on May 10. However, the long wick on the day’s candlestick shows that bears are selling at higher levels and attempting to flip $0.000017 into resistance.
If the price sustains below $0.000013, the selling could intensify and the SHIB/USDT pair could decline to the psychological level at $0.000010. The buyers will have to push and sustain the price above the 20-day EMA ($0.000020) to indicate that the selling pressure may be weakening.
Market data is provided by HitBTC exchange.
Title: Price analysis 5/11: BTC, ETH, BNB, XRP, ADA, SOL, DOGE, DOT, AVAX, SHIB
Sourced From: cointelegraph.com/news/price-analysis-5-11-btc-eth-bnb-xrp-ada-sol-doge-dot-avax-shib
Published Date: Wed, 11 May 2022 19:30:19 +0100