
The U.S. dollar index (DXY) has risen above the highs created in March 2020 and may next challenge the multi-year highs set in January 2017. Bitcoin’s (BTC) price action is generally inversely connected to DXY. Therefore, unless the dollar reverses its sharp uptrend, a strong recovery in Bitcoin may be difficult.
Although Bitcoin has not confirmed a bottom, institutional investors seem to have started their purchases at lower levels. Canada’s Purpose Bitcoin exchange-traded fund added 1,132 BTC to its holdings, according to data analytics platform Coinglass. Behavior analytics resource Santiment also suggested that the crowd’s interest in buying the dip hit a six-week high.
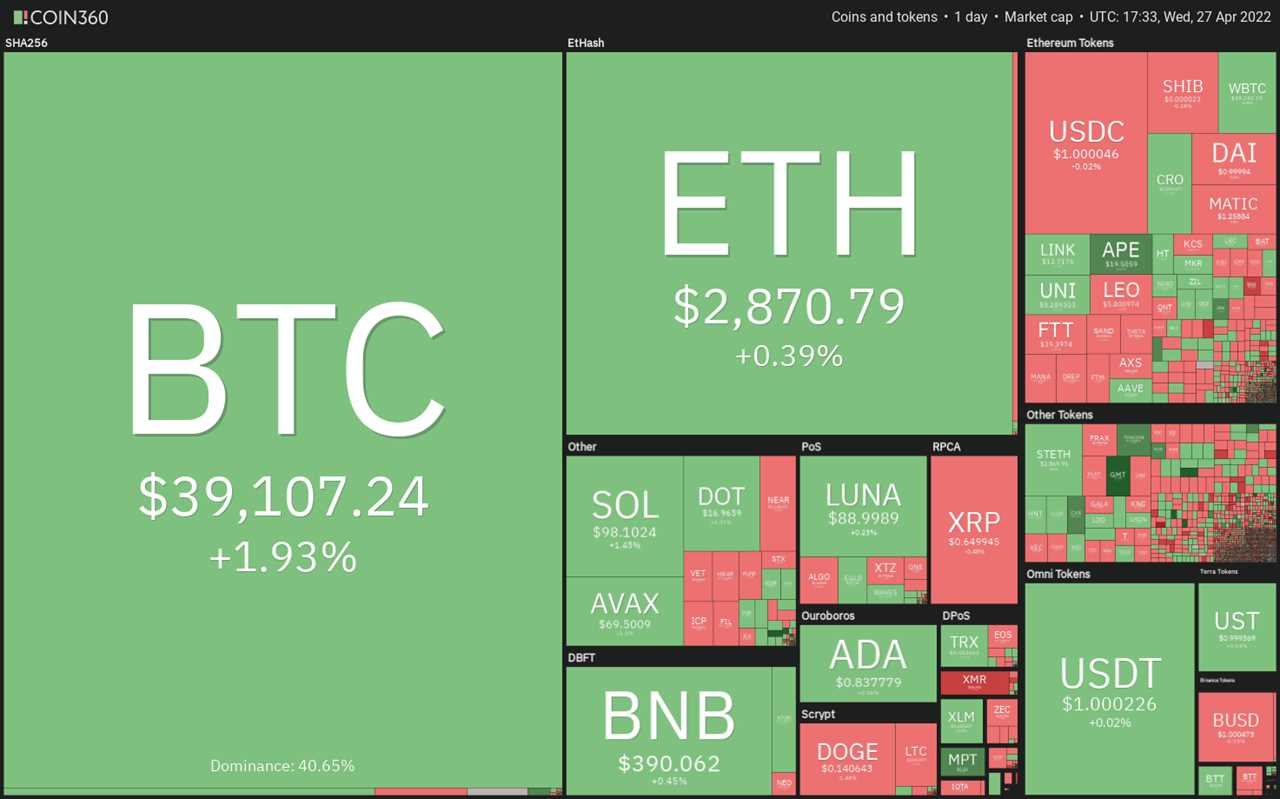
The crypto sector has been under pressure in 2022 but that has not reduced venture-capital (VC) activity in different blockchain sectors. The first quarter of 2022 has witnessed VC investments of more than $14.6 billion in the blockchain industry, which is 48% of the total investments made by VC’s in 2021. This shows the long-term growth potential of the industry.
Could Bitcoin and altcoins start a recovery from their respective support levels? Let’s study the charts of the top-10 cryptocurrencies to find out.
BTC/USDT
Bitcoin’s recovery on April 26 stalled at the 20-day exponential moving average ($40,618), suggesting that the sentiment remains negative and traders are selling on rallies. A minor positive is that the price has rebounded off the support line of the ascending channel today indicating that bulls are attempting to defend this level.
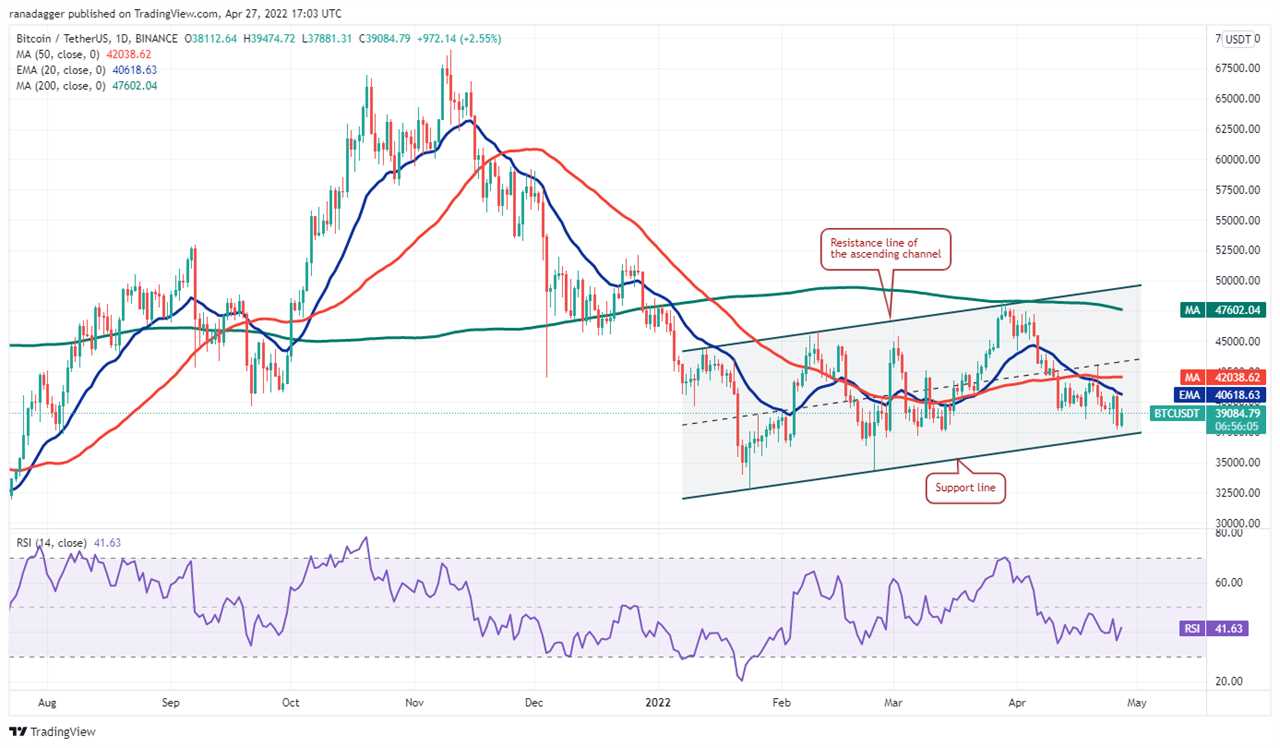
If the bounce sustains, the bulls will again strive to push the price above the 20-day EMA and the 50-day simple moving average (S42,038). If they succeed, it will suggest that the BTC/USDT pair could extend its stay inside the channel for a few more days.
Conversely, if the price turns down from the current level or the 20-day EMA and breaks below the channel, it will suggest that bears are in control. The pair could then slide to $34,300 and later to $32,917.
ETH/USDT
Ether (ETH) once again turned down from the 20-day EMA ($3,014) on April 26, indicating that bears continue to sell on rallies to this level. The bears will now try to pull the price to the uptrend line.
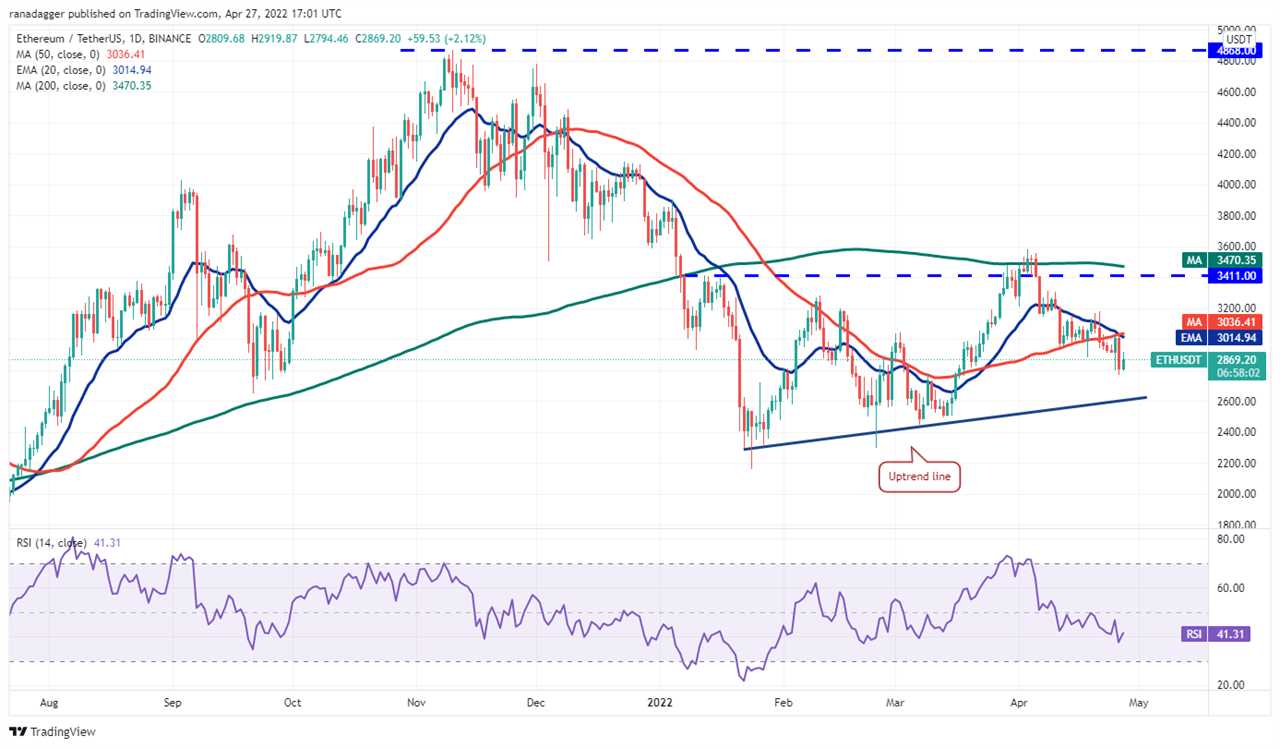
If bears sink the price below the uptrend line, the ETH/USDT pair could slide toward $2,450. The bulls will attempt to stall the decline at this level but if they fail, the selling could accelerate and the pair may drop to $2,159.
Alternatively, if the price rises from the current level, the buyers will make one more attempt to propel the pair above the 20-day EMA. If they manage to do that, the pair could rise to $3,200 and later attempt an up-move to the 200-day SMA ($3,470).
BNB/USDT
Binance Coin (BNB) closed below the immediate support at $391 on April 26, indicating near-term weakness. The bulls are currently attempting to push the price back above the breakdown level.
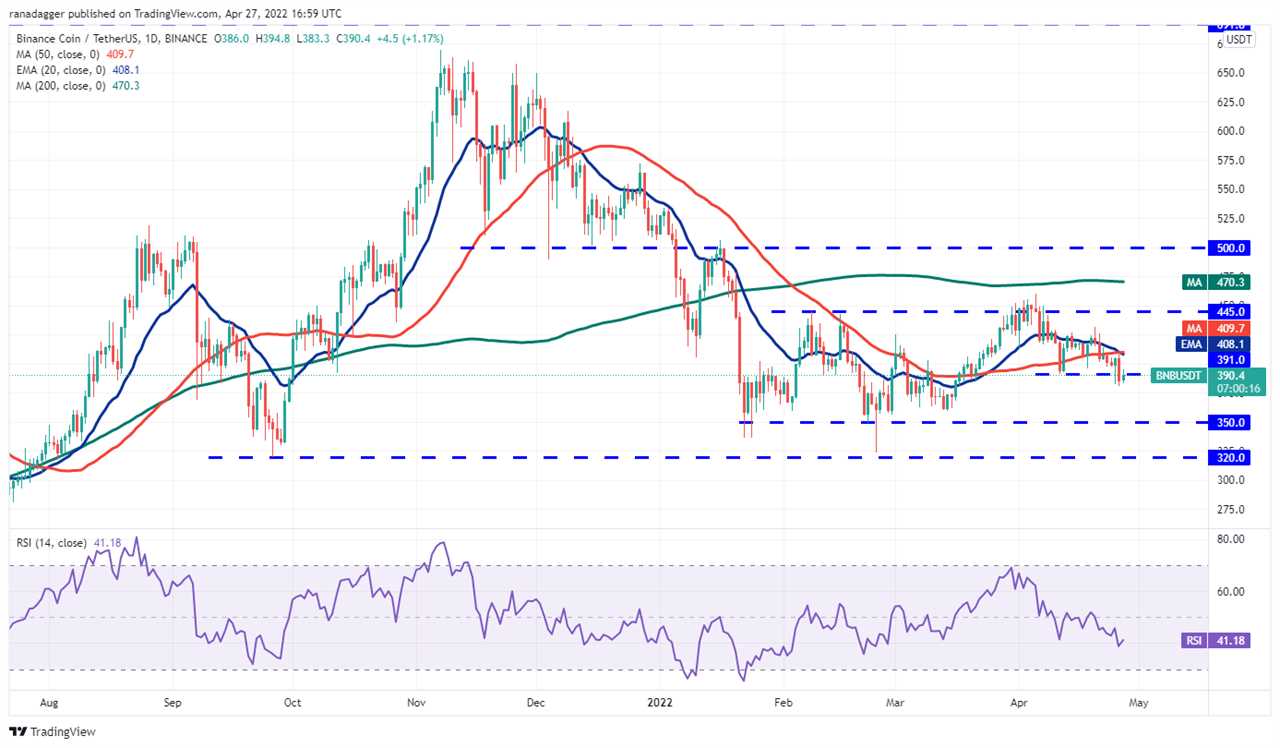
If they succeed, the price could rise to the 20-day EMA ($408). This is an important resistance to keep an eye on because if bulls clear this hurdle, the BNB/USDT pair could rise to $431 and later attempt a rally to $460.
Contrary to this assumption, if bears flip the $391 level into resistance, the BNB/USDT pair could resume its downtrend and drop toward the strong support at $350. The downsloping 20-day EMA and the RSI in the negative zone indicate that the path of least resistance is to the downside.
XRP/USDT
Ripple’s (XRP) long tail on the April 25 candlestick shows strong buying at lower levels. However, the bulls could not sustain the price above $0.70 on April 26, resulting in another sell-off.
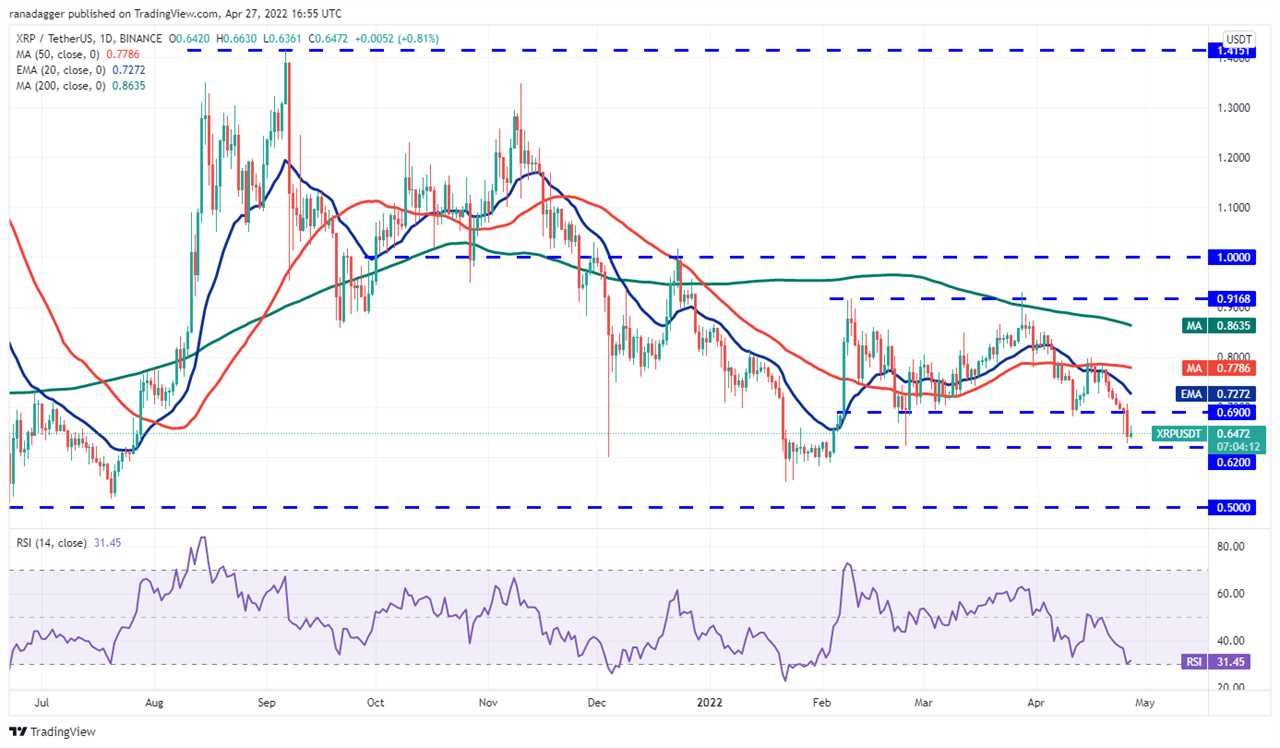
The downsloping 20-day EMA ($0.72) and the RSI near the oversold zone indicate that bears have the upper hand. If the price breaks below the immediate support at $0.62, the XRP/USDT pair could plummet to the strong support at $0.55.
Contrary to this assumption, if the price rebounds off the current level, the bulls will make another attempt to push and sustain the pair above the breakdown level at $0.69. If they succeed, the pair could rise to the 50-day SMA ($0.77).
SOL/USDT
The bulls have been defending the support line of the ascending channel for the past two days but they haven’t been able to push Solana (SOL) above the 20-day EMA ($103). This suggests that demand dries up at higher levels.
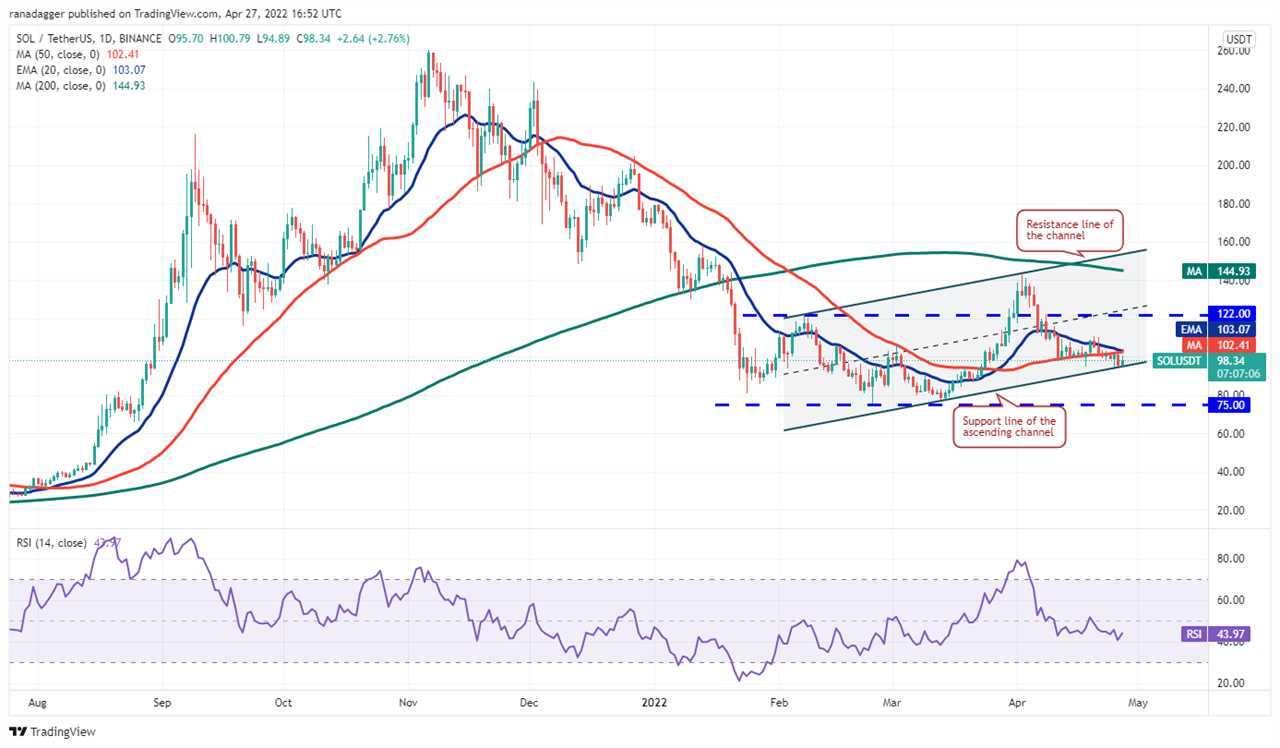
The downsloping 20-day EMA and the RSI below 44 indicate advantage to sellers. If the price turns down from the current level or the 20-day EMA, it will increase the possibility of a drop below the ascending channel. If that happens, the SOL/USDT pair could plunge to the strong support at $75.
Alternatively, if the price rises from the current level and breaks above the 20-day EMA, it will suggest accumulation at the support line. The pair could then rally to $110. A break and close above this level will suggest that the pair may extend its stay inside the channel for a few more days.
LUNA/USDT
Terra’s LUNA token has been oscillating above and below the 20-day EMA ($91) for the past few days. The buyers pushed the price above the 50-day SMA ($94) on April 25 but could not sustain the higher levels.
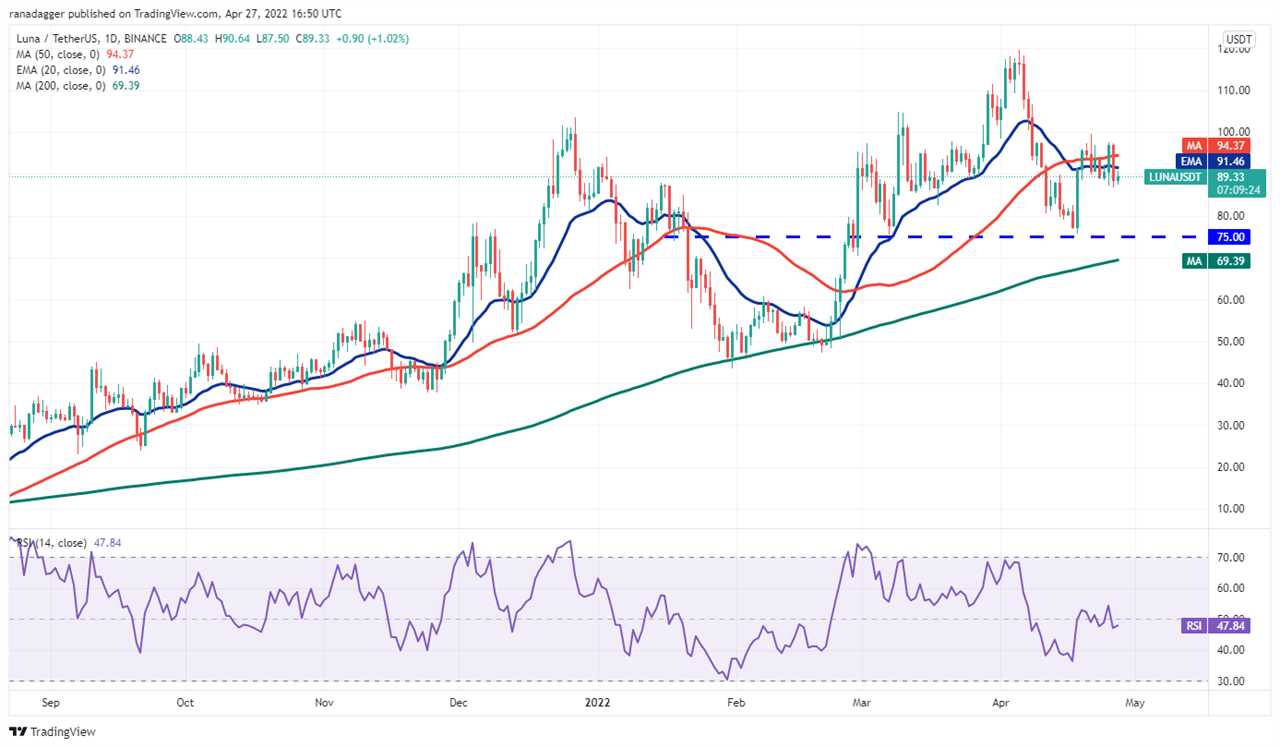
The bears pulled the price back below the 20-day EMA on April 26. If the price slips and sustains below $86, the LUNA/USDT pair could continue to slide toward the strong support at $75. The buyers are likely to defend this level aggressively.
If the price turns up from the current level and rises above the 50-day SMA, the bulls will again attempt to propel the pair above the psychological resistance at $100. If they succeed, the pair may rise to the all-time high at $119.
The flattish 20-day EMA and the RSI just below the midpoint do not give a clear advantage either to the bulls or the bears.
ADA/USDT
After repeatedly failing to break above the psychological level at $1, Cardano (ADA) has gradually been dropping toward the strong support at $0.74.
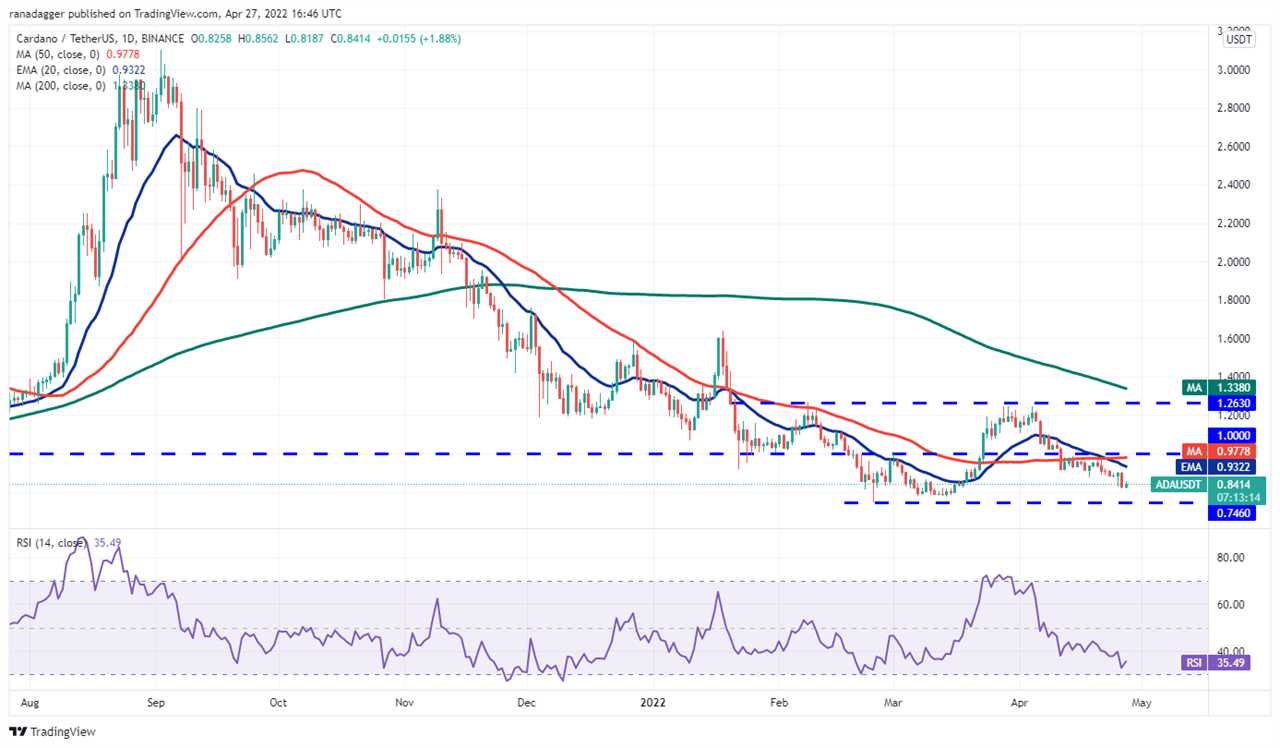
The downsloping 20-day EMA ($0.93) and the RSI near the oversold territory indicate advantage to bears. The sellers will now attempt to sink the ADA/USDT pair below the strong support at $0.74. If they succeed, the pair could resume the downtrend.
Contrary to this assumption, if the price rises from the current level or the $0.74 support, the bulls will attempt to push the pair above the 20-day EMA. If they do that, the pair could rise to $1. A break and close above this resistance could open the doors for a possible rally to $1.26.
Related: Ex-BitMEX CEO explains how Bitcoin will have hit $1 million by 2030
AVAX/USDT
Avalanche (AVAX) has been trading between $65 and $99 for the past few days. The price has gradually drifted down toward the support of the range where the buyers are expected to mount a strong defense.
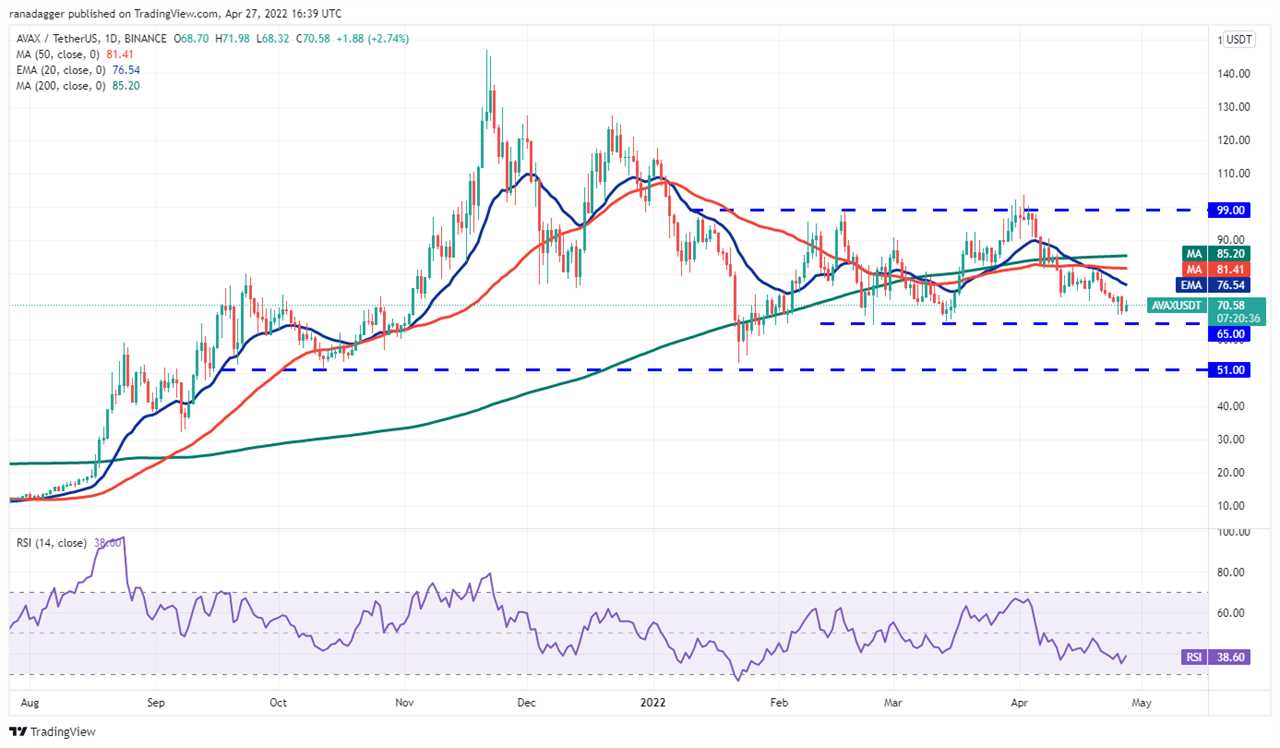
If the price bounces off the current level, the bulls will attempt to push the AVAX/USDT pair above the 20-day EMA ($76). If they succeed, it will be the first indication that the bears may be losing their grip. A break and close above the 200-day SMA ($85) could open the doors for a potential rally to $99.
Alternatively, if the price turns down from the current level or the 20-day EMA and breaks below $65, it could clear the path for a drop to $51. The downsloping 20-day EMA and the RSI in the negative zone indicate the path of least resistance is to the downside.
DOGE/USDT
Dogecoin (DOGE) soared to the overhead resistance at $0.17 on April 25 but the bulls could not overcome this barrier. The failure to do so may have attracted profit-booking by short-term traders which pulled the price back below the 20-day EMA ($0.14) on April 26.
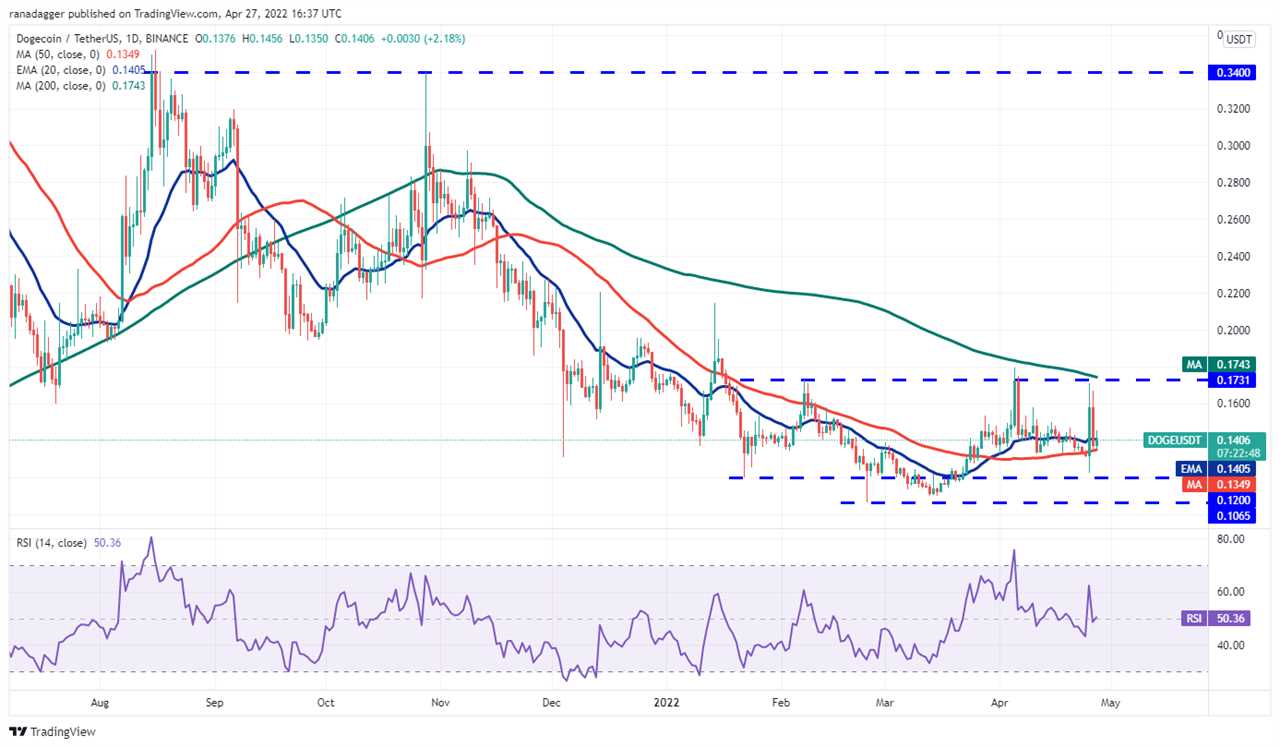
The 20-day EMA is flat and the RSI is near the midpoint, suggesting a range-bound action in the near term. If the price breaks below the 50-day SMA ($0.13), the DOGE/USDT pair could drop to $0.12. The bulls are likely to defend this level with vigor but if they fail to arrest the decline, the next stop could be the psychological level at $0.10.
The next trending move could start after the bulls push and sustain the pair above $0.17 or bears sink the price below the support at $0.10. Until then, volatile range-bound action is likely to continue.
DOT/USDT
Polkadot (DOT) has been stuck inside a range between $23 and $16 for the past several days. This means traders buy the dips to the support of the range and sell on rallies to the resistance level.
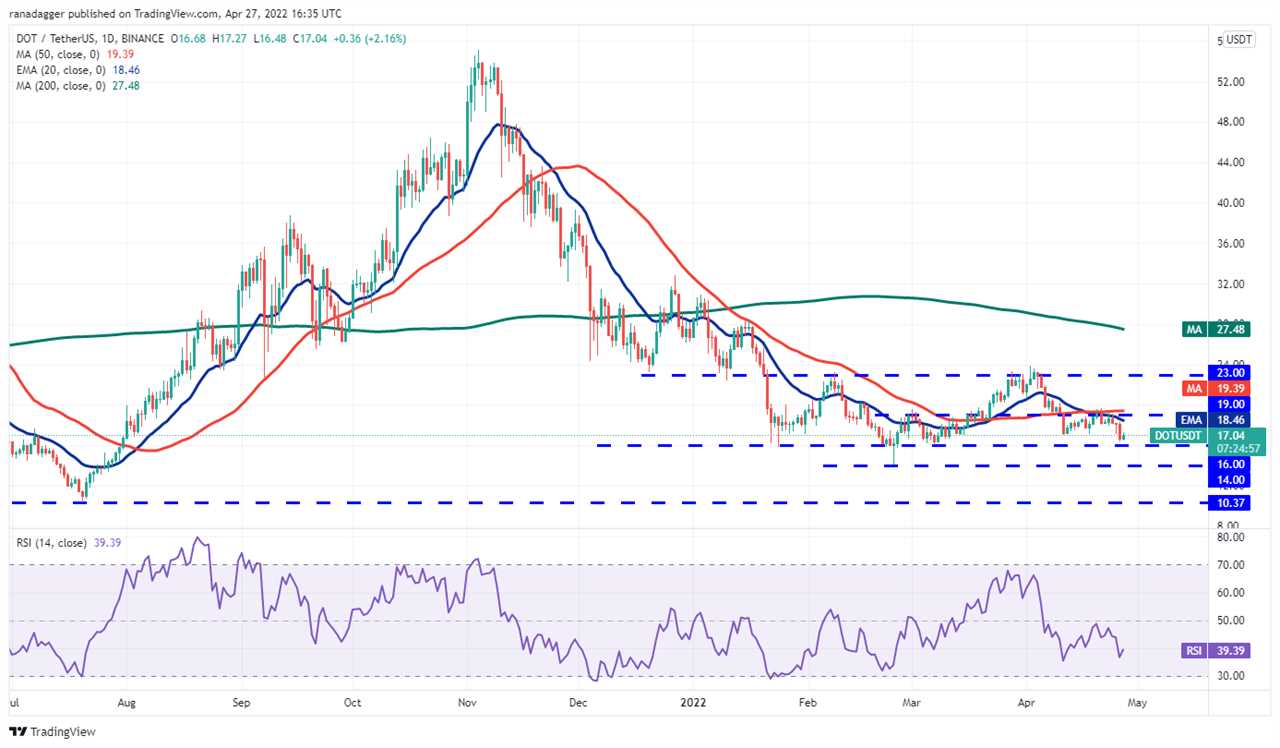
The price has bounced off the support and the buyers will now try to propel the DOT/USDT pair above the 50-day SMA ($19.39). If they succeed, it will suggest that the pair may extend its stay inside the range for a few more days.
Conversely, if the price slips and sustains below $16, it will indicate that supply exceeds demand. The pair could then decline to the critical support at $14. This is an important level for the bulls to defend because a break below it could signal the resumption of the downtrend.
Market data is provided by HitBTC exchange.
Title: Price analysis 4/27: BTC, ETH, BNB, XRP, SOL, LUNA, ADA, AVAX, DOGE, DOT
Sourced From: cointelegraph.com/news/price-analysis-4-27-btc-eth-bnb-xrp-sol-luna-ada-avax-doge-dot
Published Date: Wed, 27 Apr 2022 21:00:00 +0100


