
Bitcoin’s (BTC) price inched higher over the weekend as bulls try to enforce a trend change while bears attempt to stall the relief rally. On-chain monitoring resource Whalemap highlighted that $38,000 is the critical zone for the whales during any correction as whales had accumulated in this zone last week.
On the upside, trader Pentoshi believes that Bitcoin could face stiff resistance near the 2022 yearly opening price of about $46,000. However, if Bitcoin remains strong, Pentoshi expects altcoins to start performing, especially since several of them have corrected sharply in the past few months.
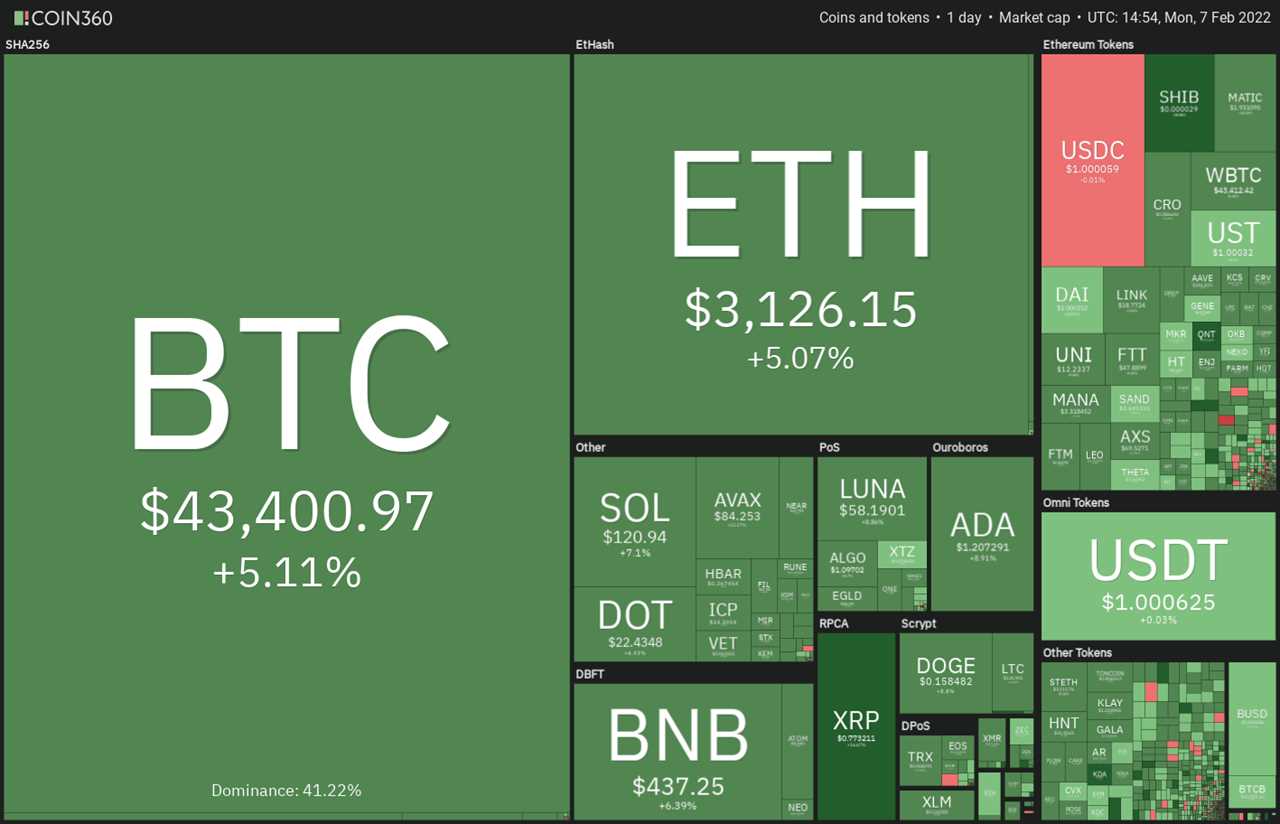
Meanwhile, traders are likely to look toward the US equity markets for clues as Bitcoin has shown a strong correlation with the Nasdaq in the past few days.
Does the sharp rebound in Bitcoin’s price indicate a trend change? Could the improving sentiment pull altcoins higher? Let’s study the charts of the top-10 cryptocurrencies to find out.
BTC/USDT
Bitcoin gradually continued to move up and has reached the 50-day simple moving average ($42,809). The bears could try to defend this level because if they fail to do so, a trend change will be signaled.
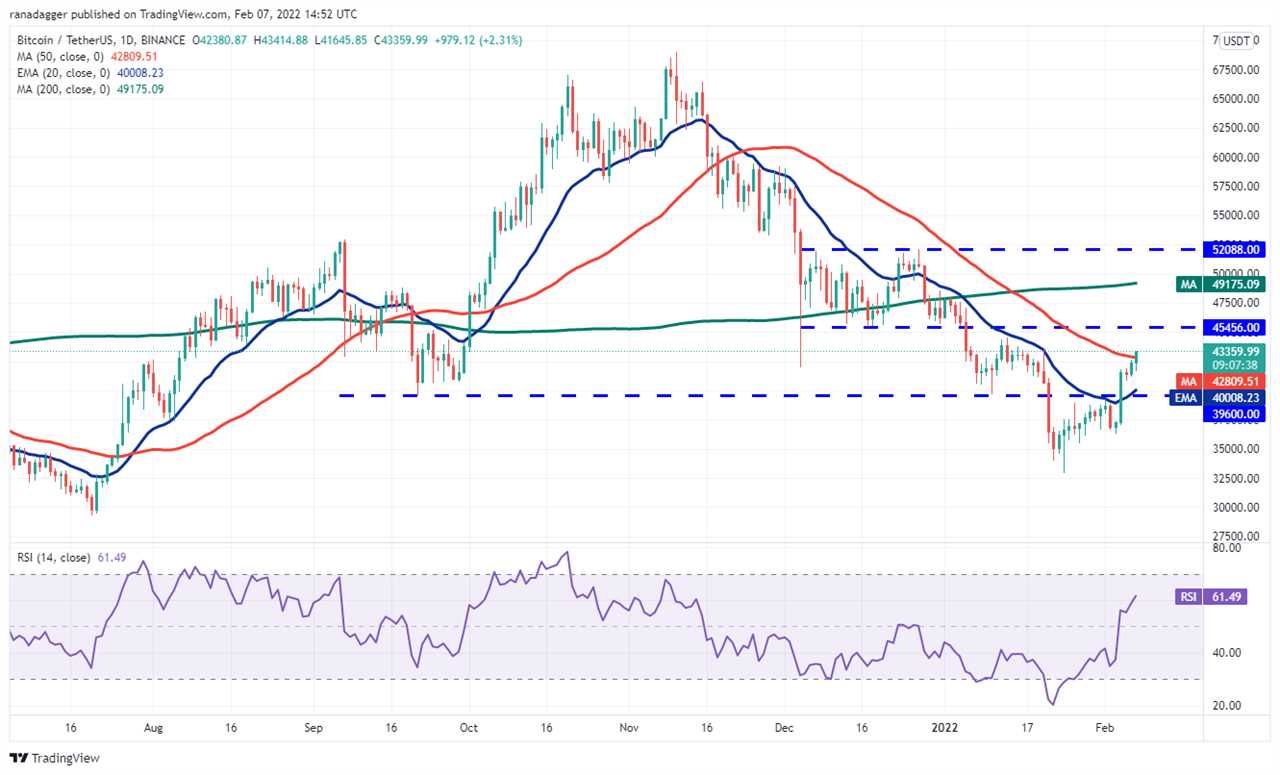
The rising 20-day exponential moving average ($40,008) and the relative strength index (RSI) in the positive zone indicate that bulls have a slight edge. Above the 50-day SMA, the BTC/USDT pair could rally to $45,456. If bulls clear this hurdle, the pair could retest the 200-day SMA ($49,175).
Alternatively, if the price turns down from the current level of $45,456, the bears will attempt to pull the price back below $39,600. This is an important level to watch out for because if bulls flip this into support, it will suggest that a bottom is in place.
On the other hand, a break and close below $39,600 could indicate that the current up-move may have been a bear market rally, which was sold into.
ETH/USDT
Ether (ETH) has continued to rise gradually and reached the resistance line of the descending channel. The bears are expected to mount a strong defense in the zone between the resistance line and the 50-day SMA ($3,241).
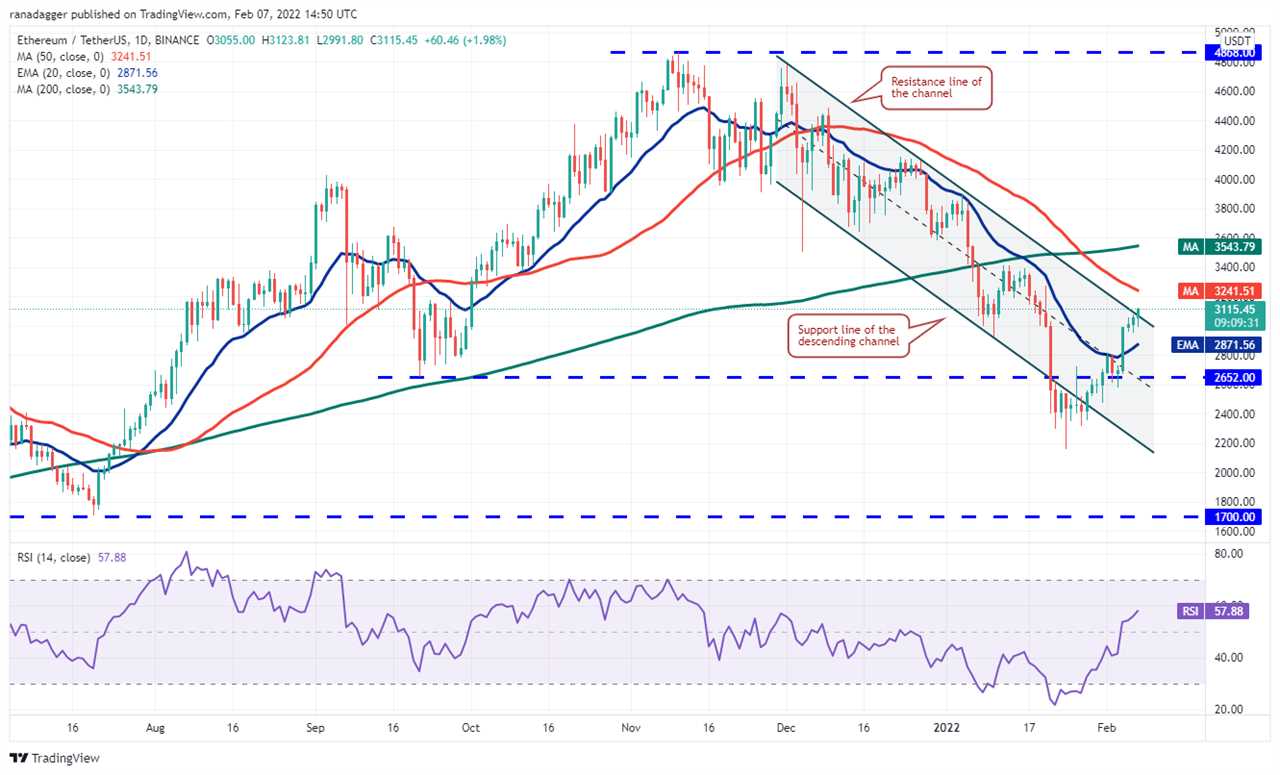
However, the rising 20-day EMA ($2,871) and the RSI in the positive territory indicate an advantage to buyers. If bulls thrust the price above the 50-day SMA, the ETH/USDT pair could rally to the 200-day SMA ($3,543).
Contrary to this assumption, if the price turns down from the current level or the 50-day SMA, it will suggest that bears are active at higher levels. The bears will then attempt to pull the pair below the 20-day EMA. If they succeed, the pair could challenge the strong support at $2,652.
BNB/USDT
Binance Coin (BNB) surged above the 20-day EMA ($408) on Feb. 5, indicating that bulls are attempting a comeback. The buyers will now attempt to push the price above the resistance line of the channel and the 50-day SMA ($458).
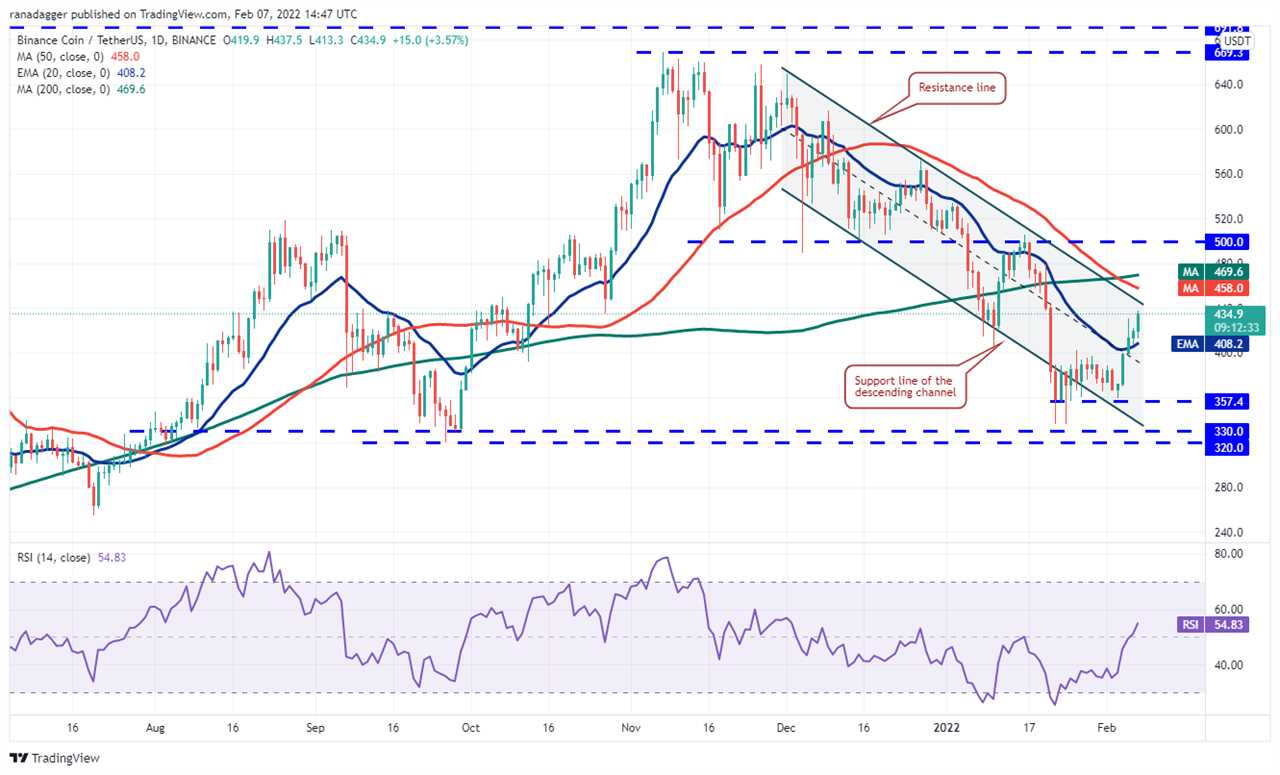
If they do that, it will indicate that the downtrend could be over. The 20-day EMA has turned up and the RSI has risen into the positive territory, indicating that bulls have the upper hand.
Above the 50-day SMA, the BNB/USDT pair could rally to the psychological level at $500 where the bears may again mount a strong resistance.
This positive view will invalidate if the price turns down from the resistance line. Such a move will indicate that bears have not given up and continue to sell on rallies. A break below the 20-day EMA could suggest that the pair may remain inside the channel for a few more days.
ADA/USDT
Cardano (ADA) bounced off the strong support at $1 and broke above the 20-day EMA ($1.13) on Feb. 4. The bears tried to pull the price back below the 20-day EMA on Feb. 5 and 6 but the bulls did not relent.
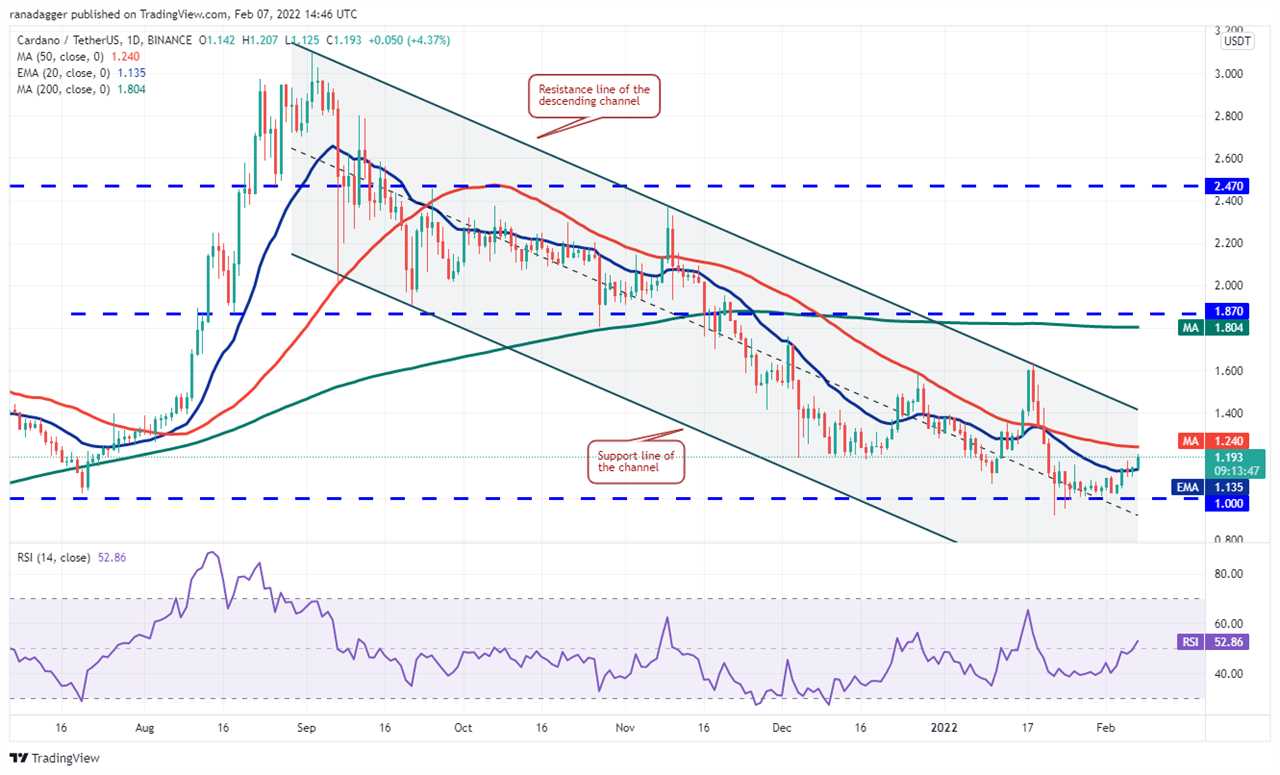
This indicates that bulls are attempting to defend the 20-day EMA. If the price rises above the 50-day SMA ($1.24), the ADA/USDT pair could rally to the resistance line of the descending channel.
A break and close above the channel could signal that the downtrend may be over. The pair could then rally to $1.60 and later toward the overhead resistance at $1.87. This positive view will be negated on a break and close below $1. Such a move could suggest the resumption of the downtrend.
SOL/USDT
Solana (SOL) broke above the 20-day EMA ($112) on Feb. 4 but the bulls have been struggling to clear the overhead hurdle at $116. This suggests that bears are attempting to defend the overhead resistance.
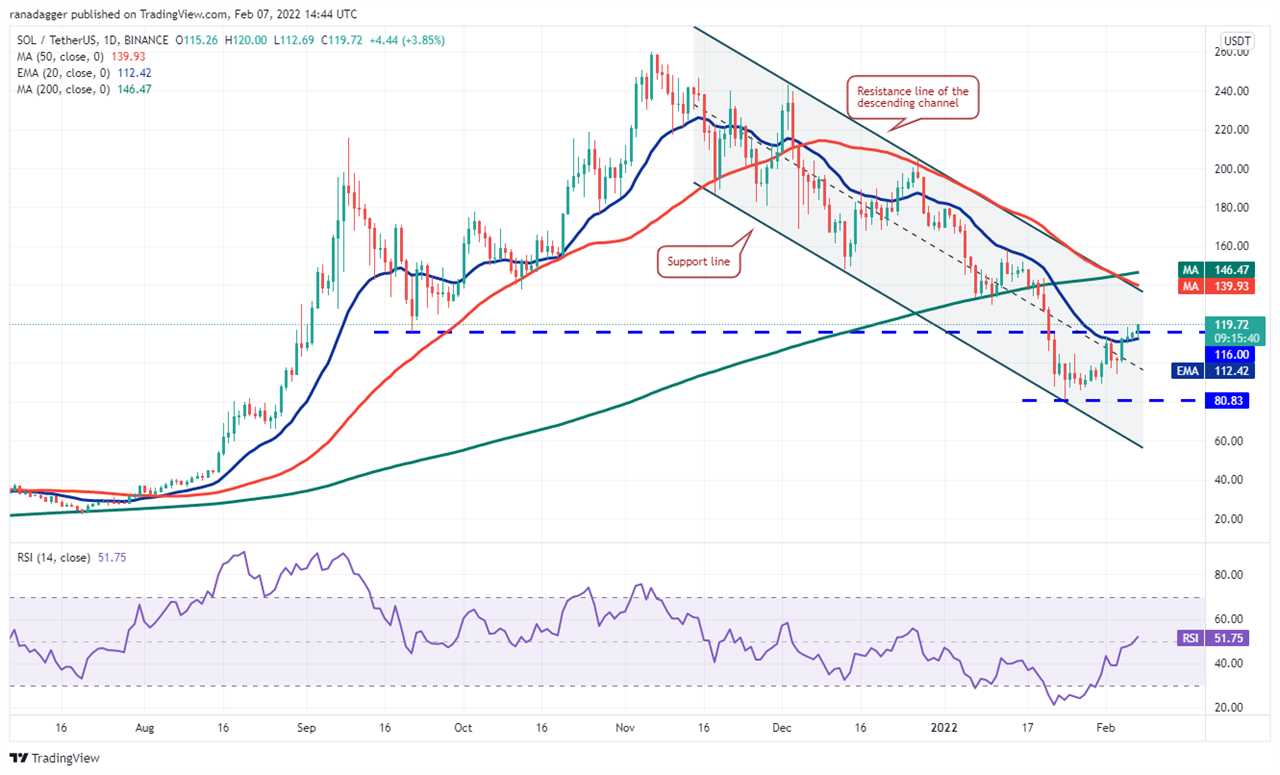
If bears fail to pull the price back below the 20-day EMA quickly, the prospects of a rally to the resistance line of the descending channel increase. A break and close above the 200-day SMA ($146) could indicate that the downtrend may be over.
Conversely, if the price turns down from the current level or the resistance line, it will suggest that bears continue to sell on rallies. The SOL/USDT pair could then extend its stay inside the channel for a few more days.
XRP/USDT
XRP rose above the overhead resistance at $0.65 on Feb. 4 and picked up momentum today to climb above the 50-day SMA ($0.75). A close above the 50-day SMA will signal a possible change in trend.
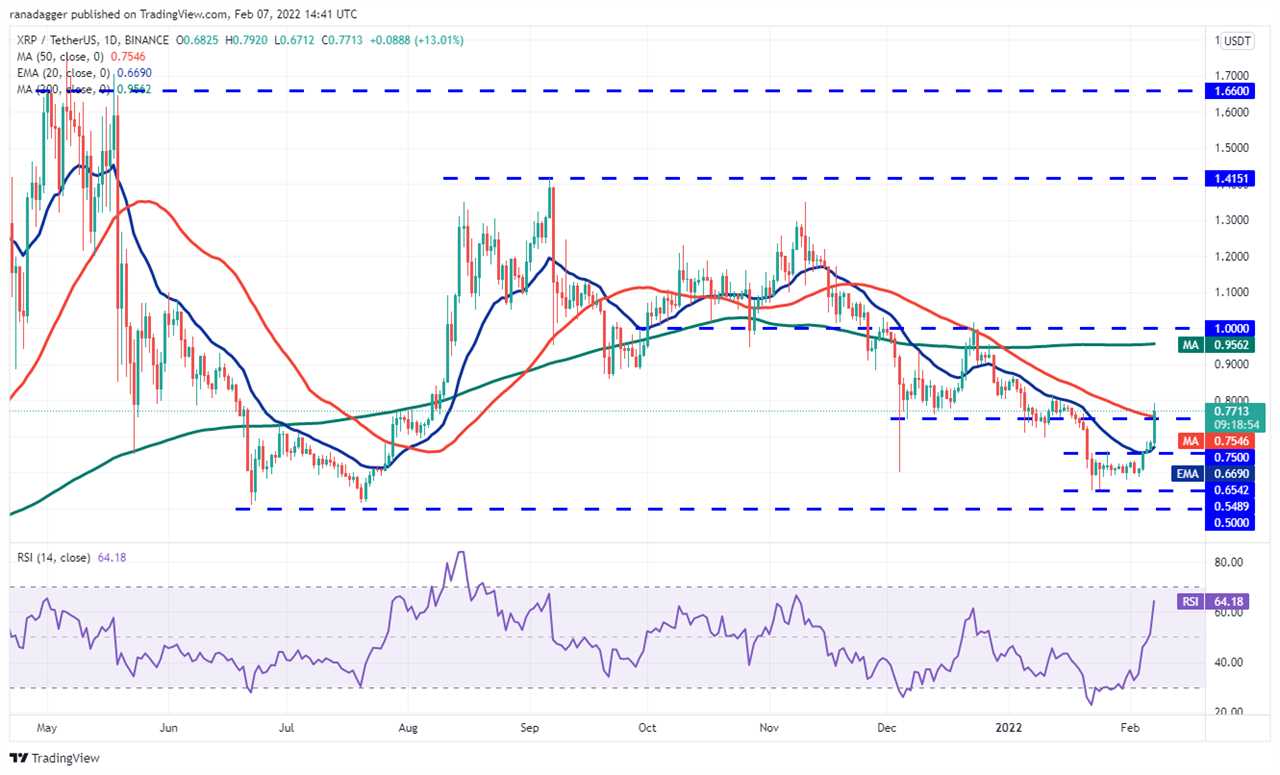
The XRP/USDT pair could then start its northward march toward the psychological level at $1. The 20-day EMA ($0.66) has started to turn up gradually and the RSI has jumped into the positive territory, indicating an advantage to buyers.
This positive view will invalidate in the short term if the price turns down and sustains below $0.75. Such a move will indicate that bears continue to sell at higher levels. The pair could then drop to the 20-day EMA.
LUNA/USDT
Terra’s LUNA token rose above the $54.20 overhead resistance on Feb. 5. The bears tried to pull the price back below the level on Feb. 6 but the bulls did not relent. The bulls are attempting to push the price above the 20-day EMA ($58.96).
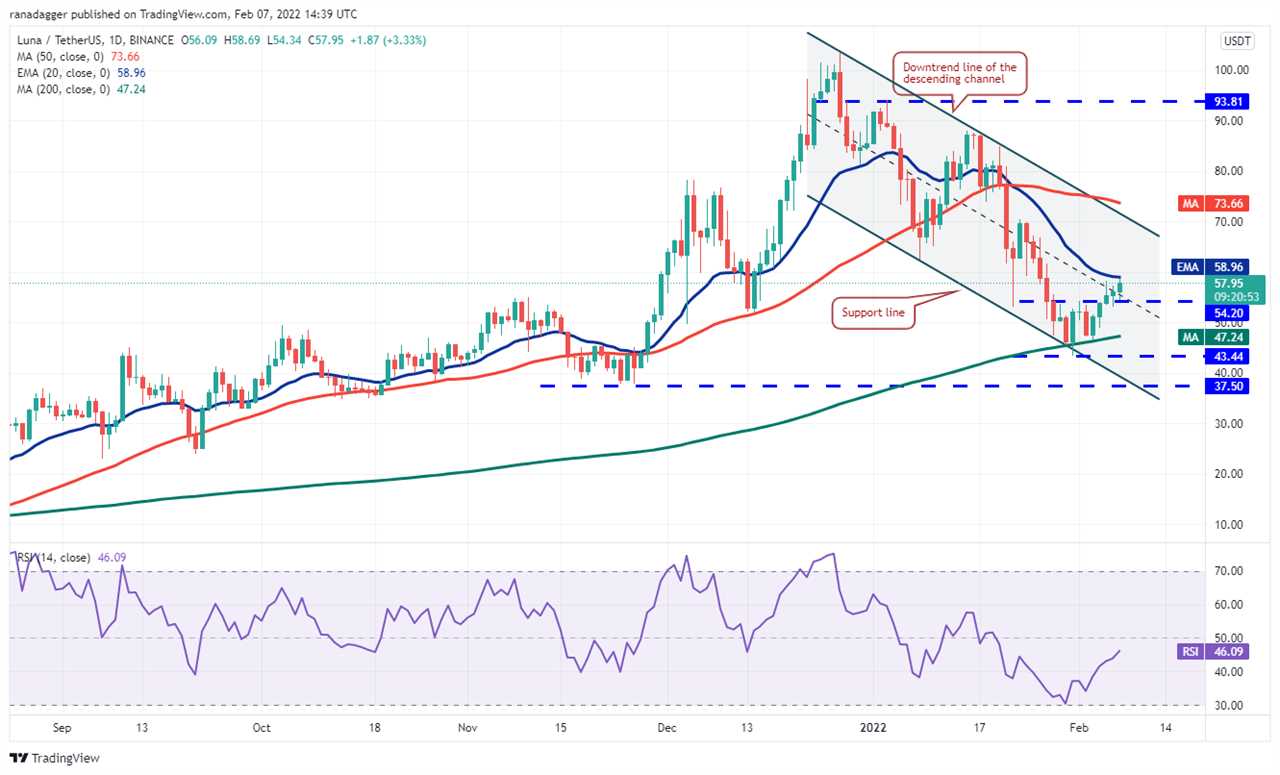
If they manage to do that, the LUNA/USDT pair could start its northward march toward the downtrend line of the descending channel. The bulls will have to clear this hurdle to signal a possible change in trend.
Conversely, if the price turns down from the current level or the downtrend line, it will indicate that the pair could continue to trade inside the channel. A break and close below the 200-day SMA ($47) could clear the path for a possible drop to the support line of the channel.
Related: Is Shiba Inu overheating after SHIB price gains 75% in two weeks?
DOGE/USDT
After struggling to sustain above the 20-day EMA ($0.14) on Feb. 4 and 5, Dogecoin (DOGE) made a decisive move on Feb. 6 and closed above the resistance. This was the first indication that the selling pressure could be waning.
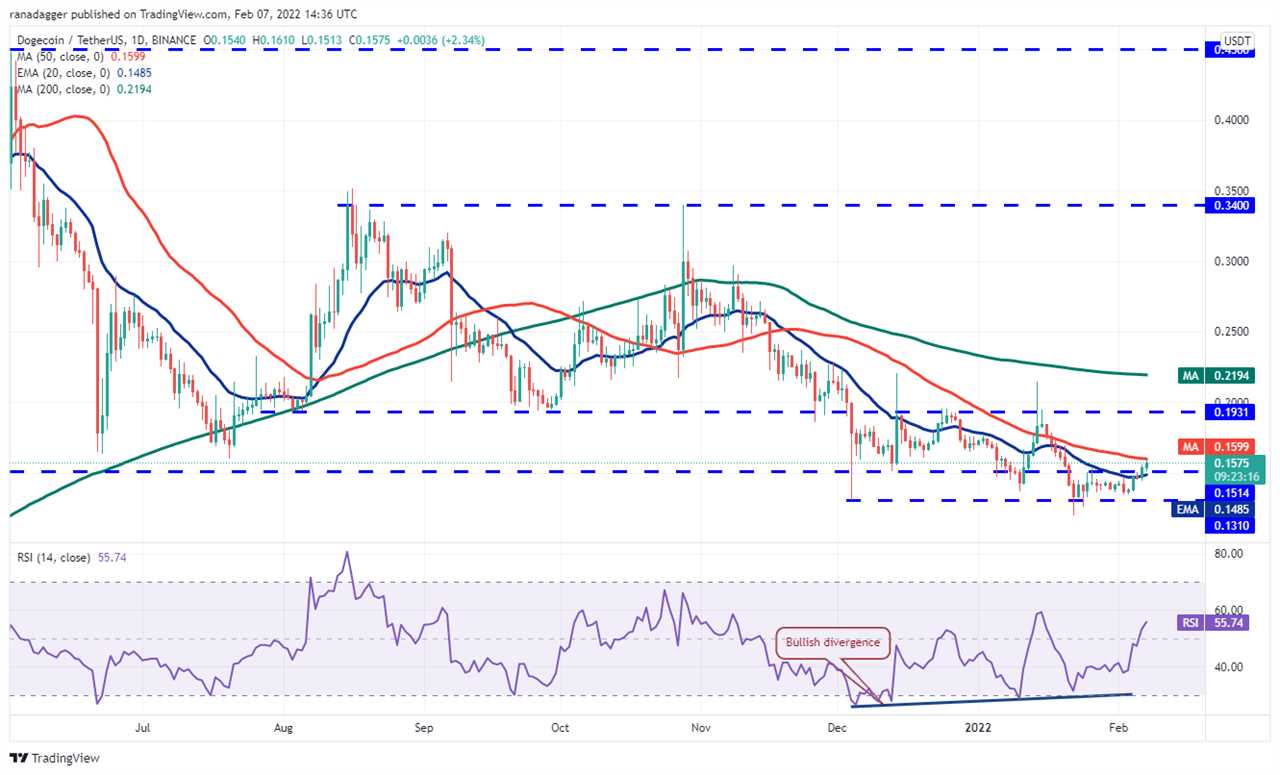
The price has reached the 50-day SMA ($0.16), which could act as a resistance. If the price turns down from the current level but does not slip back below the 20-day EMA, it will suggest buying on dips.
The bulls will then make one more attempt to push the price above the 50-day SMA. If they succeed, the DOGE/USDT pair could rally toward the overhead resistance at $0.19. Contrary to this assumption, if the price breaks below the 20-day EMA, the pair could slide to $0.13.
DOT/USDT
Polkadot (DOT) broke and closed above the 20-day EMA ($20.87) on Feb. 5 but the bulls have been struggling to push the price above the breakdown level at $22.66. The bears are likely to defend the zone between $22.66 and the 50-day SMA ($24.16).
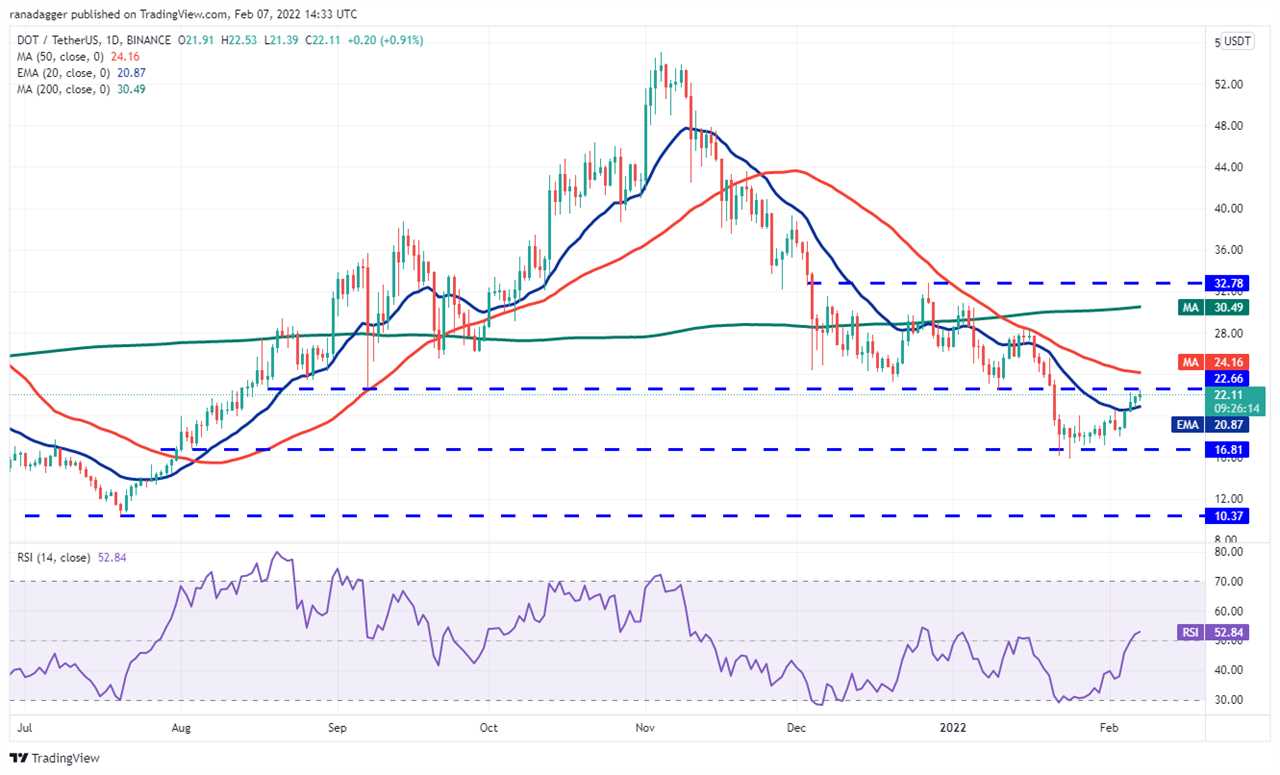
If the price turns down from the overhead zone, it will suggest that bears continue to sell on rallies. The bears will then attempt to pull the price back below the 20-day EMA. If they manage to do that, the DOT/USDT pair could drop to $16.81.
Alternatively, if bulls push the price above the 50-day SMA, it will suggest a change in the short-term trend. The pair could then gradually move up to $28.60 and later continue its march toward the overhead resistance at $32.78.
AVAX/USDT
Avalanche (AVAX) rose above the 20-day EMA ($75.67) on Feb. 4, indicating that the bears could be losing their grip. The sellers tried to pull the price back below the 20-day EMA on Feb. 5 but the bulls held their ground.
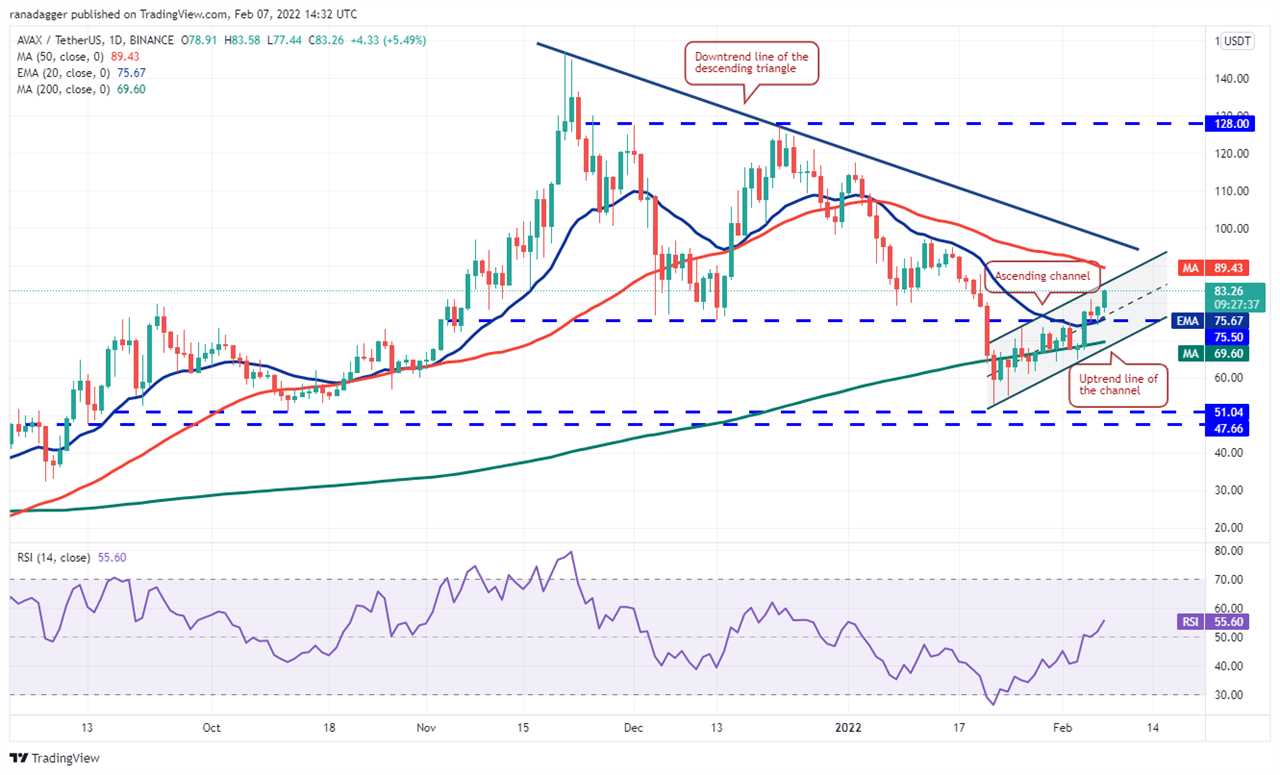
The buying resumed on Feb. 6 and the AVAX/USDT pair has reached the resistance line of the ascending channel. If bulls drive the price above the channel, the pair could start its journey toward the downtrend line.
The 20-day EMA has started to turn up gradually and the RSI has jumped into the positive zone, indicating a minor advantage to buyers. This positive view will invalidate in the short term if the price turns down and breaks below the 20-day EMA. Such a move could pull the price to the uptrend line of the channel.
Market data is provided by HitBTC exchange.
Title: Price analysis 2/7: BTC, ETH, BNB, ADA, SOL, XRP, LUNA, DOGE, DOT, AVAX
Sourced From: cointelegraph.com/news/price-analysis-2-7-btc-eth-bnb-ada-sol-xrp-luna-doge-dot-avax
Published Date: Mon, 07 Feb 2022 15:24:27 +0000
Did you miss our previous article...
https://trendinginthenews.com/crypto-currency/privacyfocused-applications-platform-aleo-raises-200m