
Bitcoin’s (BTC) stellar run in the latter half of 2020 and MicroStrategy’s purchase of the digital asset appears to have attracted attention from several publicly listed companies in the United States. However, the lack of regulatory clarity could have deterred them from buying Bitcoin at lower levels.
To address this issue, business intelligence firm MicroStrategy is hosting an online seminar on Feb. 3 and 4, where “the legal considerations firms face while integrating Bitcoin into their corporate strategy” will be discussed. Several major crypto firms will also make presentations to the audience.
About 1,400 firms have signed up for the webinar, which shows companies are deeply interested in Bitcoin. Even if a handful of these firms end up buying Bitcoin, it could start the next leg of the rally to a new all-time high.
U.S.-based institutional investors have shown increasing interest in Bitcoin in 2020, which has propelled Coinbase to the top 1,000 websites in the world and one of the top 400 in the U.S.
The popularity seems to have increased further in January of this year. Morgan Creek Digital co-founder Anthony Pompliano recently highlighted that the Coinbase app was downloaded 1.3 million times in January, which is greater than “E-trade, TD Ameritrade, Charles Schwab, Fidelity, and Sofi” combined.
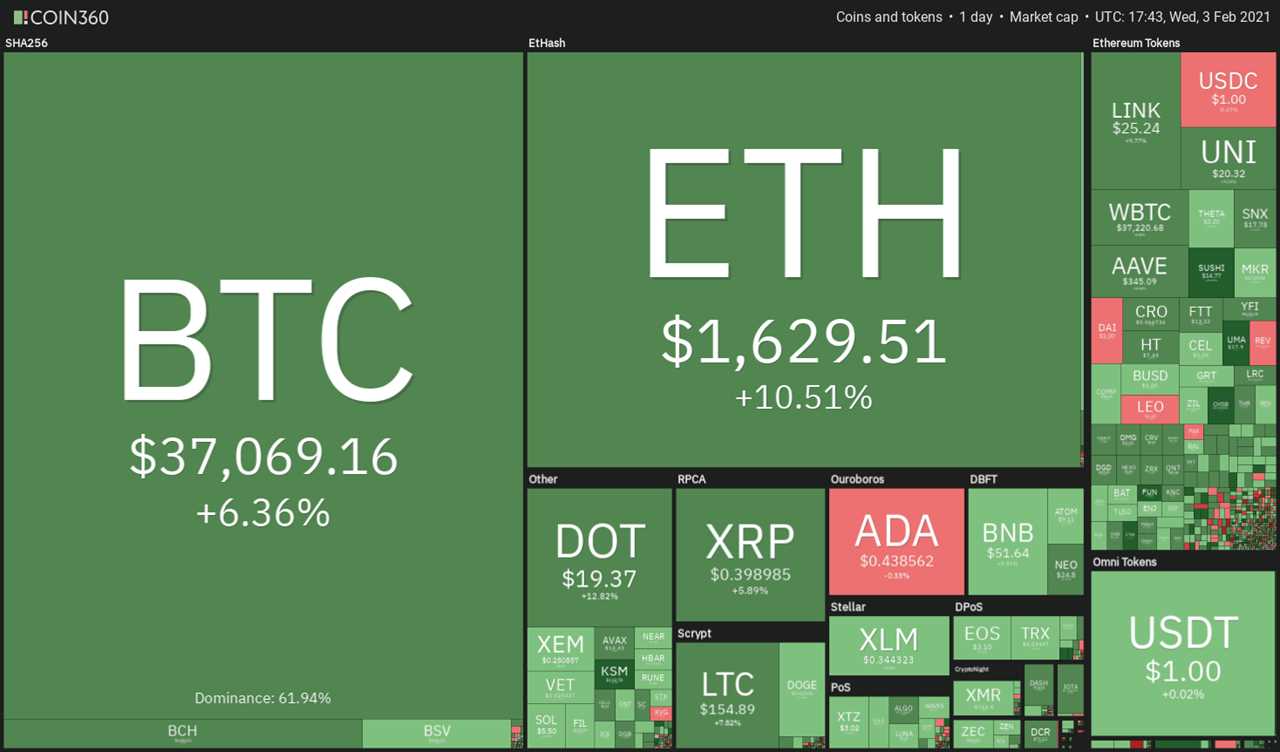
With these positive fundamental tailwinds, let’s analyze the charts of the top-10 cryptocurrencies and determine what the technicals project.
BTC/USD
Bitcoin broke above the downtrend line on Feb. 2 and followed that up with another up-move today, which invalidates the short-term bearish sentiment. The relative strength index (RSI) has jumped into the positive zone and the 20-day exponential moving average ($33,945) has started to turn up, indicating advantage to the bulls.
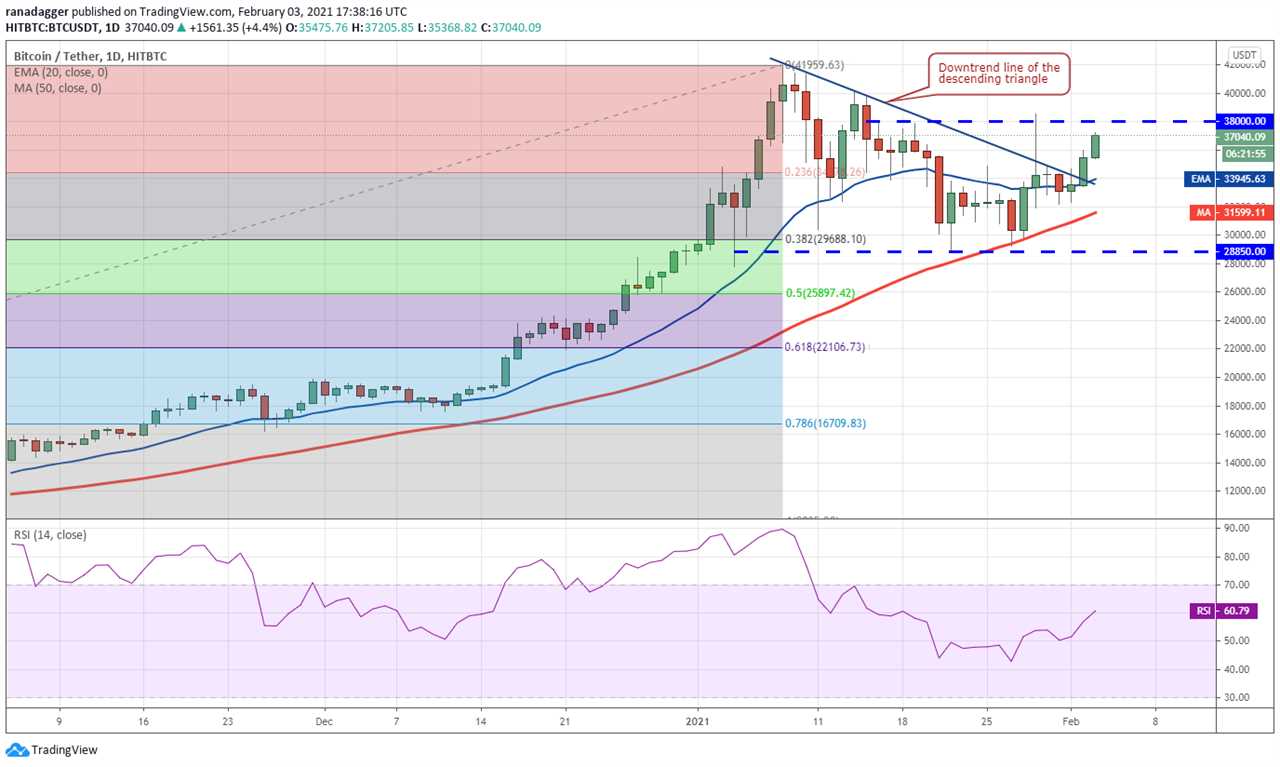
The BTC/USD pair could now rally to $38,000. If the bulls can drive the price above this resistance, the pair could retest the all-time high at $41,959.63. A breakout of this level could start the next leg of the up-move that may reach $50,000.
On the other hand, if the bears defend the $38,000 level aggressively, the price may turn down and drop to the 20-day EMA. If the price rebounds off this level, the bulls will again try to resume the uptrend.
But if the bears sink the price below the moving averages, the pair may consolidate between $28,850 and $38,000. A break below $28,850 could start a deeper correction.
ETH/USD
Ether (ETH) soared above the $1,400 to $1,473.096 overhead resistance on Feb. 2 and followed that up with another strong up-move today. This suggests that the bulls continue to buy at higher levels.
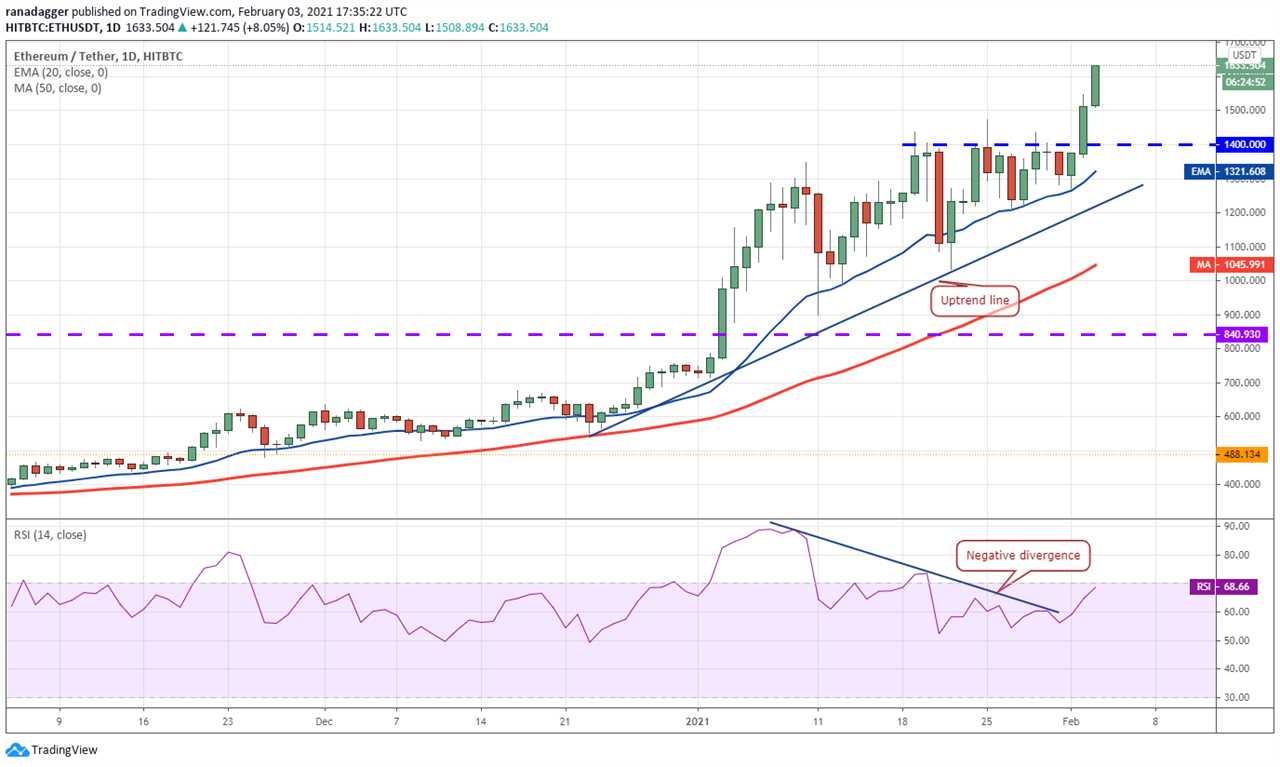
The price action of the past three days has invalidated the negative divergence on the RSI. The ETH/USD pair could now rally to $1,675 and if that level is also crossed, the rally could extend to $2,000.
Any correction is likely to find strong support at the breakout level at $1,400 and below that at the 20-day EMA ($1,321). A bounce off either level will suggest that bulls remain in command.
This positive view will invalidate if the pair reverses direction and breaks below the uptrend line. Such a move will suggest aggressive profit-booking at higher levels.
XRP/USD
XRP formed a Doji candlestick on Feb. 2, indicating indecision among the bulls and the bears. Today, the bulls are attempting to resolve the uncertainty in their favor by pushing and sustaining the price above $0.41123.
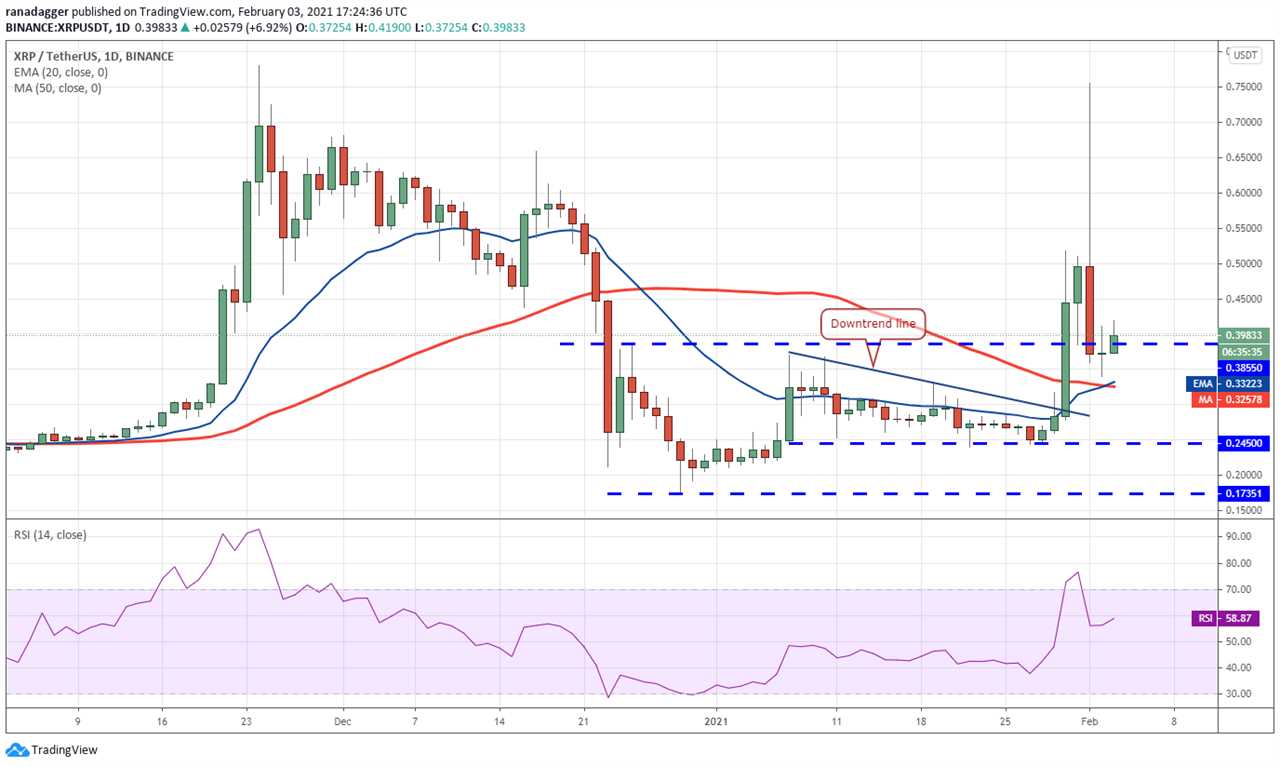
If they succeed, the XRP/USD pair could rally to $0.50 and then to $0.60. The gradually upsloping 20-day EMA ($0.33) and the RSI in the positive zone suggest that the bulls are trying to make a comeback.
However, if the bulls fail to sustain the price above $0.41123, the bears will try to pull the pair back below $0.3855. A break below the moving averages will suggest weakness and the decline may then extend to $0.245.
DOT/USD
Polkadot (DOT) bounced off the 20-day EMA ($15.97) on Feb. 1 and has soared above the all-time high today. If the altcoin closes above $19.40, it will suggest the next leg of the uptrend has begun.
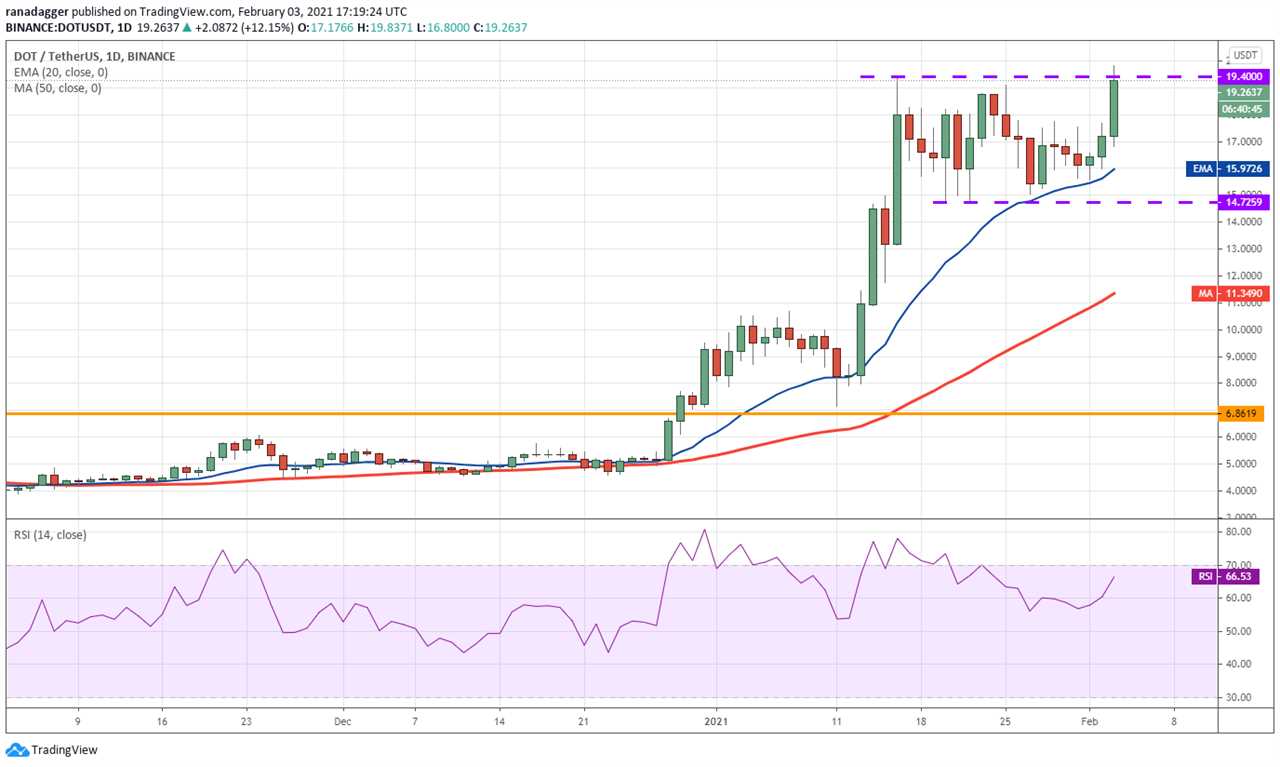
The DOT/USD pair could then rally to $24.08 and then $30. The upsloping moving averages and the RSI near the overbought territory indicate the bulls are in control.
Contrary to this assumption, if the pair reverses direction from the current levels, a few more days of range-bound action is possible. The bears will have to sink the price below the $14.7259 support to tilt the advantage in their favor.
ADA/USD
Cardano (ADA) took support at the 20-day EMA ($0.35) and surged above the $0.38 resistance on Feb. 1. That was followed by another up-move on Feb. 2, which carried the altcoin near the resistance line of the ascending channel.
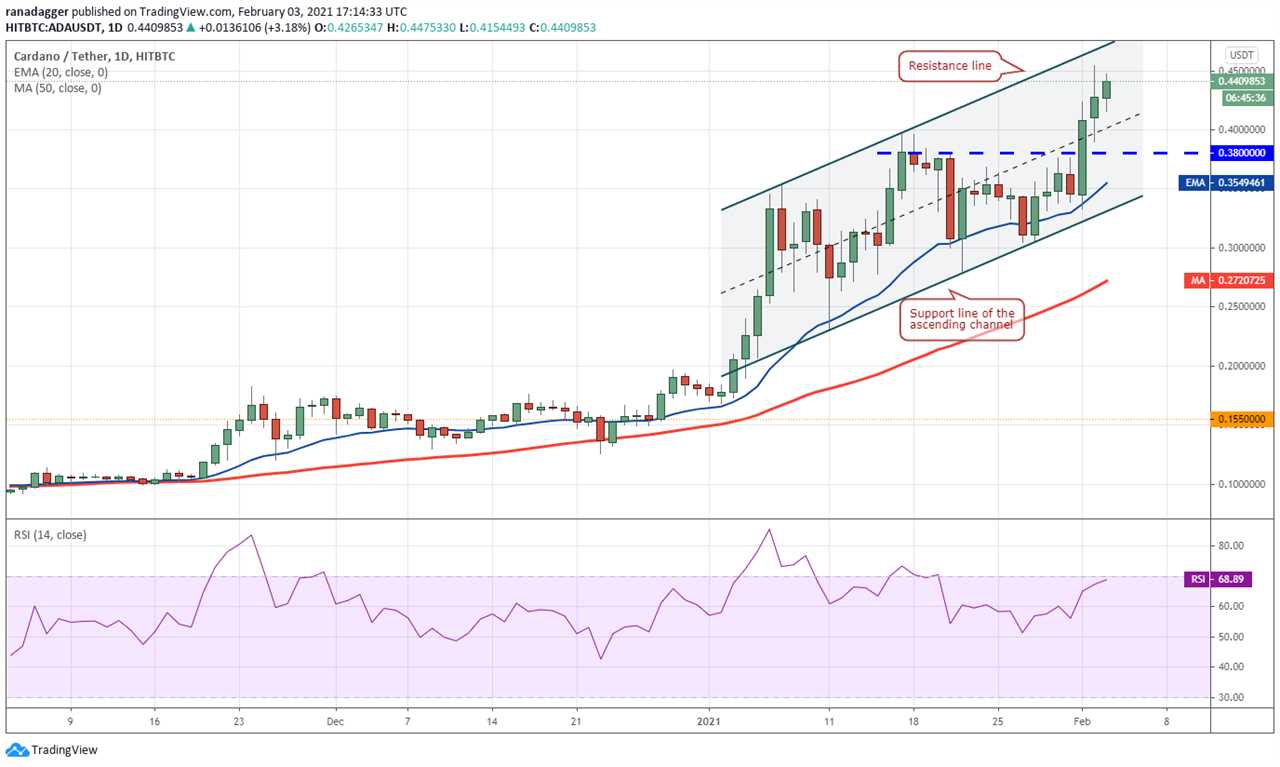
However, the long wick on the Feb. 2 candlestick suggests traders are booking profits near the resistance line. The ADA/USD pair has formed an inside day candlestick pattern today, which generally acts as a continuation pattern.
If the bulls can thrust the price above $0.4546265, the pair could rally to the resistance line of the channel. A break above the channel can push the price to the psychological resistance at $0.50.
Contrary to this assumption, if the pair turns down from the current levels and breaks below $0.38, it will suggest profit-booking at higher levels. A break below the channel will indicate a possible trend change.
LINK/USD
Chainlink (LINK) bounced off the 20-day EMA ($21.80) on Feb. 1 and broke above the downtrend line today. The bulls will now try to propel the price above the all-time high at $25.7824 and resume the uptrend.
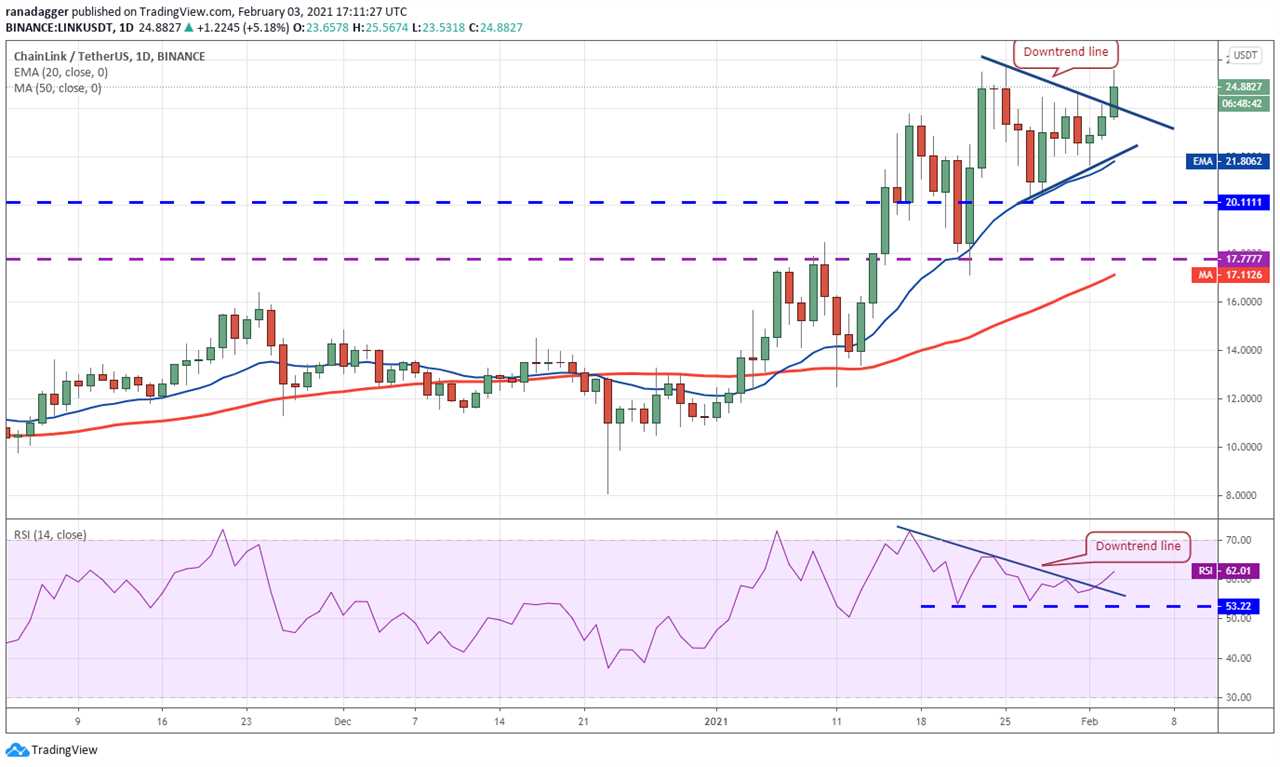
If they succeed, the LINK/USD pair could rally to $30. The rising moving averages and the RSI above 62 indicate advantage to the bulls.
On the other hand, if the price turns down from $25.7824, the LINK/USD pair could again drop to the 20-day EMA. A break below this support may result in a fall to $20.1111 and the pair could consolidate in this range for a few days.
The advantage will tilt in favor of the bears if the $20.1111 support cracks. Such a move could sink the price to the 50-day SMA ($17.11).
LTC/USD
Litecoin (LTC) broke above the downtrend line and the moving averages on Feb. 2. This move invalidates the head and shoulders pattern, which suggests the selling pressure has reduced.
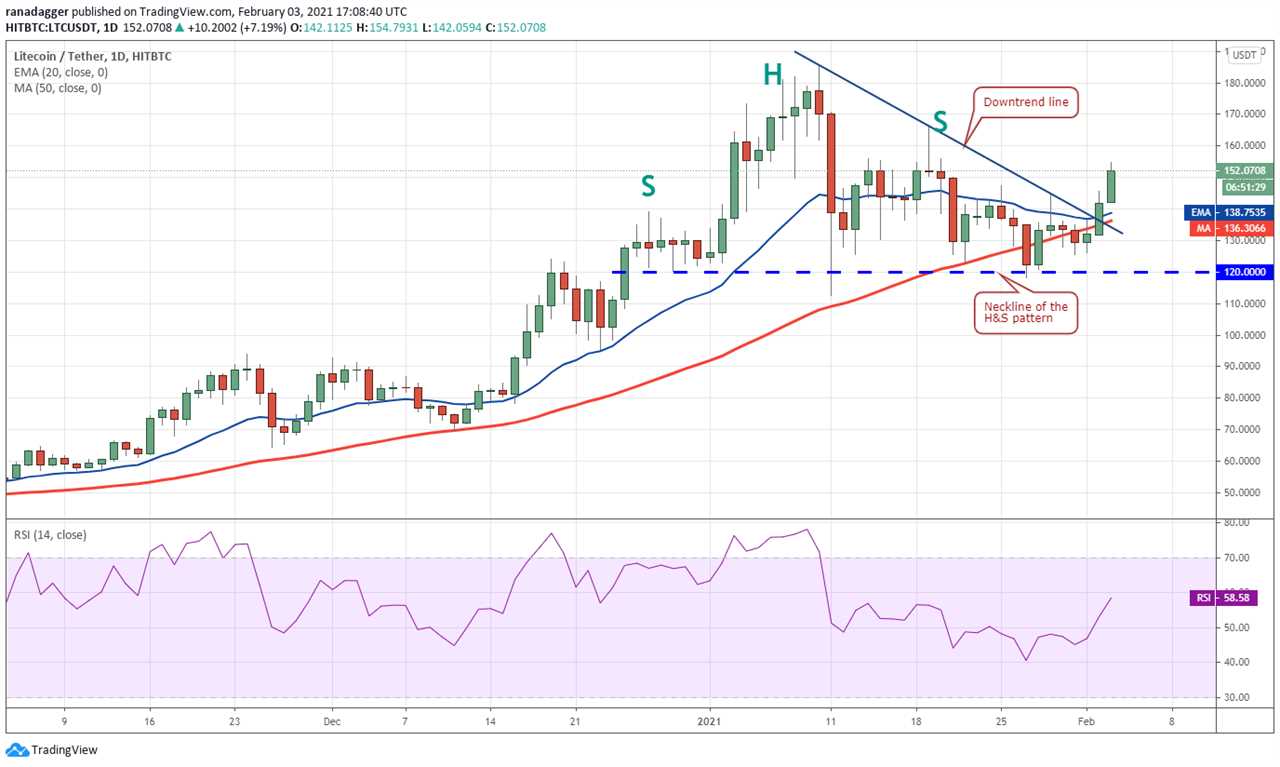
The LTC/USD pair could now rally to $165.9709. If the price turns down from this resistance, it will point to a possible consolidation between $120 and $165.9709.
On the other hand, if the bulls can drive the price above $165.9709, the pair could retest $185.5821. A break above this resistance could resume the uptrend.
This bullish view will invalidate if the pair turns down from the current levels and breaks below the $120 support. Such a move will suggest that the bears are back in command.
BCH/USD
The bulls have pushed Bitcoin Cash (BCH) above the downtrend line and the 20-day EMA ($431), which suggests the bearish sentiment has weakened. The 20-day EMA has flattened out and the RSI is just above the midpoint, suggesting a balance between supply and demand.
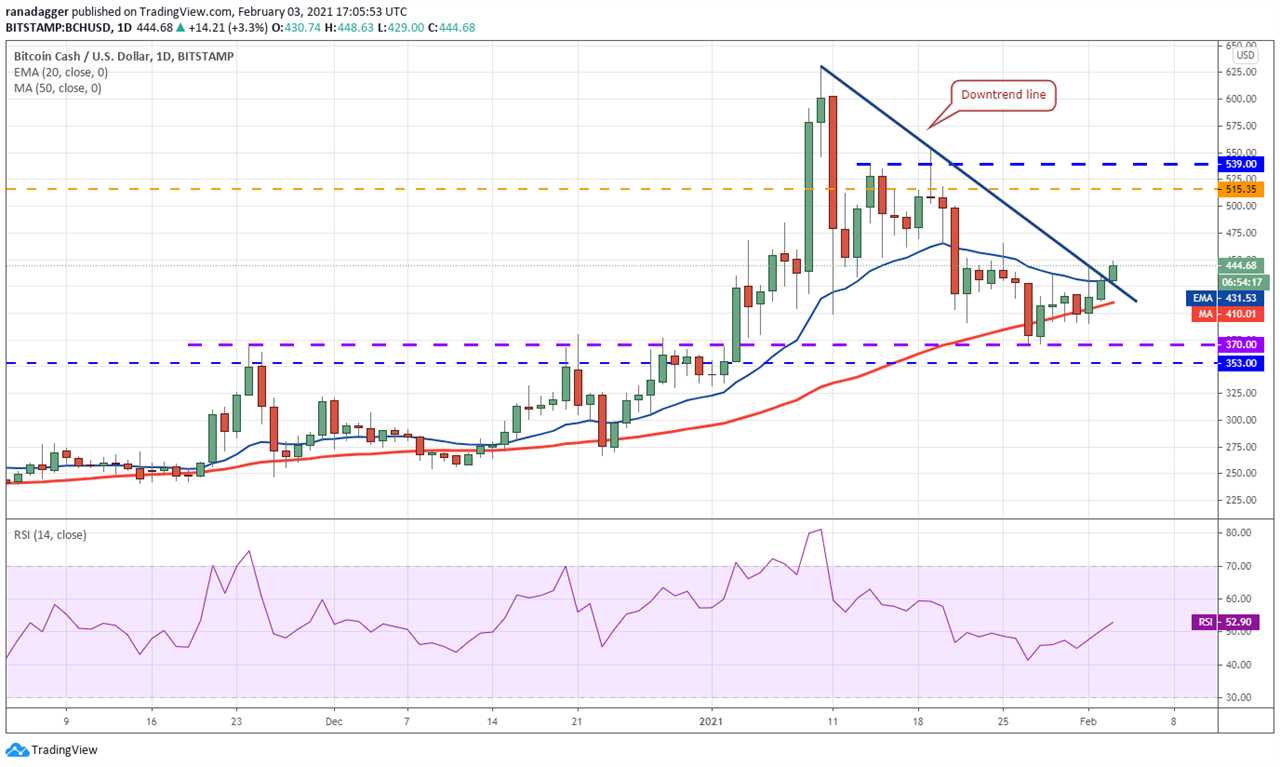
The bulls can now push the price to $465 and then to $515.35. If the price turns down from either level, it will suggest that bears are selling on rallies. The bears will then again try to sink the price below the moving averages.
If they succeed, the BCH/USD pair could drop to the $370 to $353 support zone. A bounce off this zone will keep the pair range-bound for a few more days, but a break below it could pull the price down to $275.
BNB/USD
Binance Coin (BNB) skyrocketed above the $50 psychological resistance on Feb. 1, indicating strong demand from the bulls. Another positive sign is that the altcoin has not given up much ground since then, which shows that traders are not booking profits in a hurry.
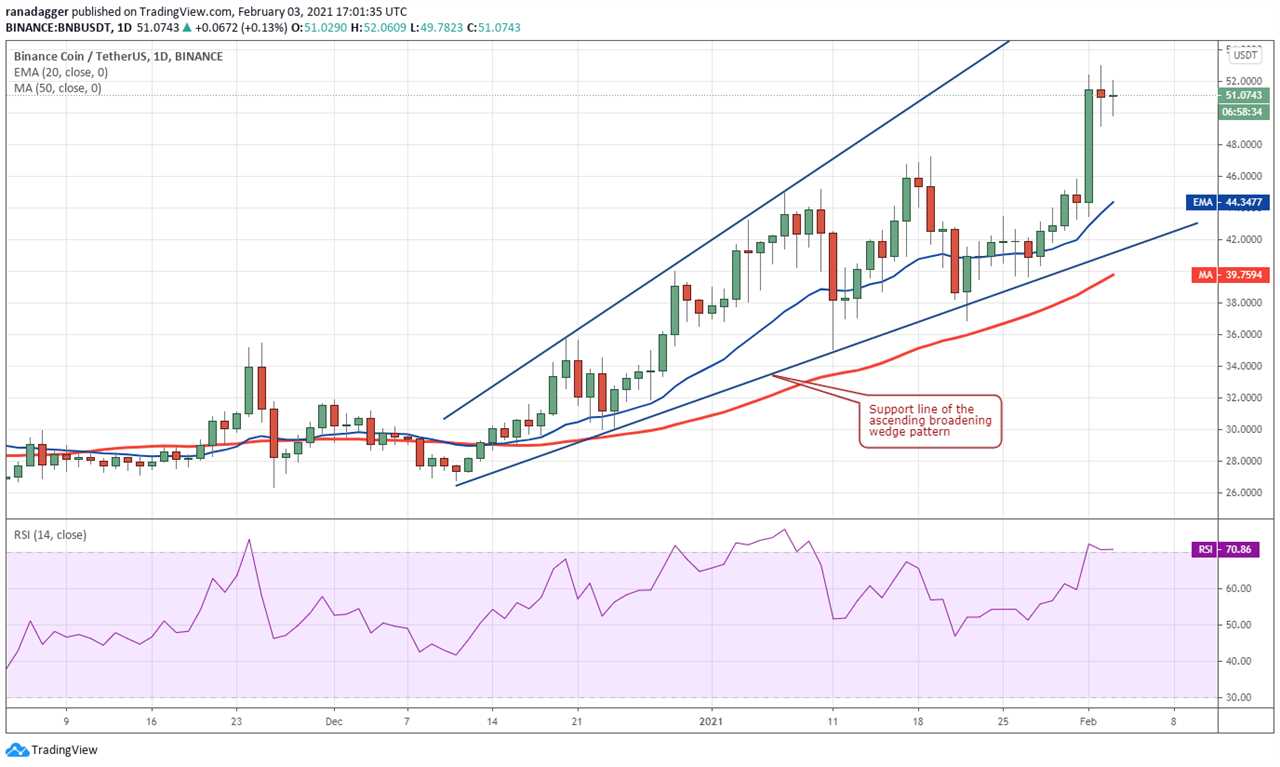
In a strong uptrend, corrections are usually shallow and last for one to three days. If the bulls can push the price above $53, the next leg of the up-move may begin. The next target objective on the upside is $60.
Contrary to this assumption, if the bears sink the price below $49, the BNB/USD pair could drop to $47. If the bulls can flip this previous resistance to support, the pair will again try to resume the uptrend.
The first sign of weakness will be a break below $47 and the trend could turn in favor of the bears if the 50-day SMA ($39.75) cracks.
XLM/USD
The bears have been defending the $0.325 to $0.35 overhead resistance zone for the past few days, but they have not been able to sink and sustain Stellar (XLM) below the 20-day EMA ($0.29). This suggests the bulls are buying at lower levels.
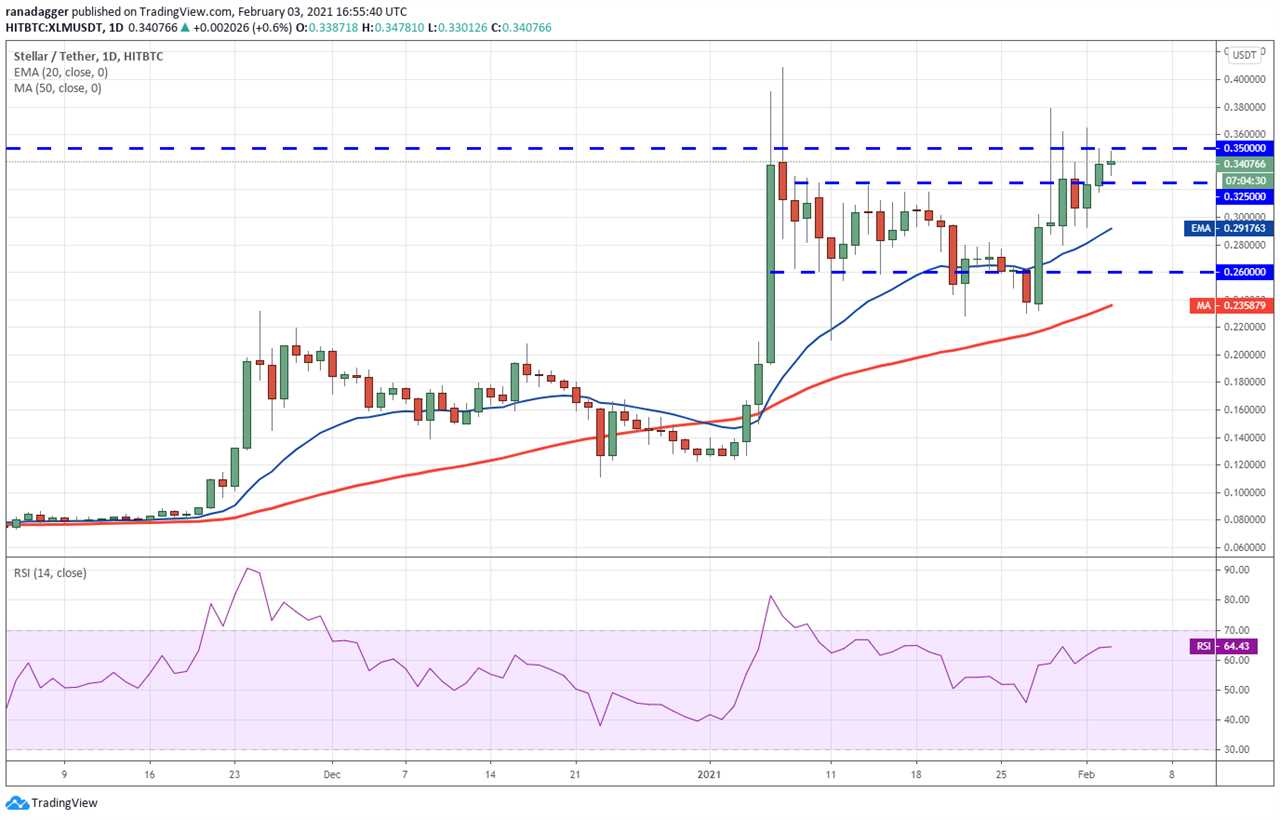
When the price repeatedly pierces a resistance level, it tends to weaken. Therefore, the possibility of an upward breakout in the XLM/USD pair is high. If the bulls can sustain the price above $0.35, the pair could rally to $0.409.
A breakout above this level will start the next leg of the uptrend that could reach $0.50. The rising moving averages and the RSI above 64 suggest the path of least resistance is to the upside.
Contrary to this assumption, if the pair breaks below the 20-day EMA, it will suggest a change in sentiment. That could result in a drop to the 50-day SMA ($0.235).
Market data is provided by HitBTC exchange.
Title: Price analysis 2/3: BTC, ETH, XRP, DOT, ADA, LINK, LTC, BCH, BNB, XLM
Sourced From: cointelegraph.com/news/price-analysis-2-3-btc-eth-xrp-dot-ada-link-ltc-bch-bnb-xlm
Published Date: Wed, 03 Feb 2021 20:30:00 +0000


