
Bitcoin (BTC) price plunged by about $3,400 in an hour, warning traders that corrections during a parabolic move are likely to be sharp. Data from Glassnode shows that the fall resulted in the liquidation of Bitcoin futures long positions worth about $190 million on Binance within an hour, the largest to date.
In a strong uptrend, corrections are swift but short-lived because investors who expect the rally to continue use the dips to buy.
Binance US CEO Catherine Coley believes the Bitcoin could climb to “$75,000 to $100,000” by the end of this year. Meanwhile, investor Raoul Paul is even more positive as he anticipates Bitcoin to hit anywhere between “$400,000 to $1.2 million” in 2021 if the bull trend continues.
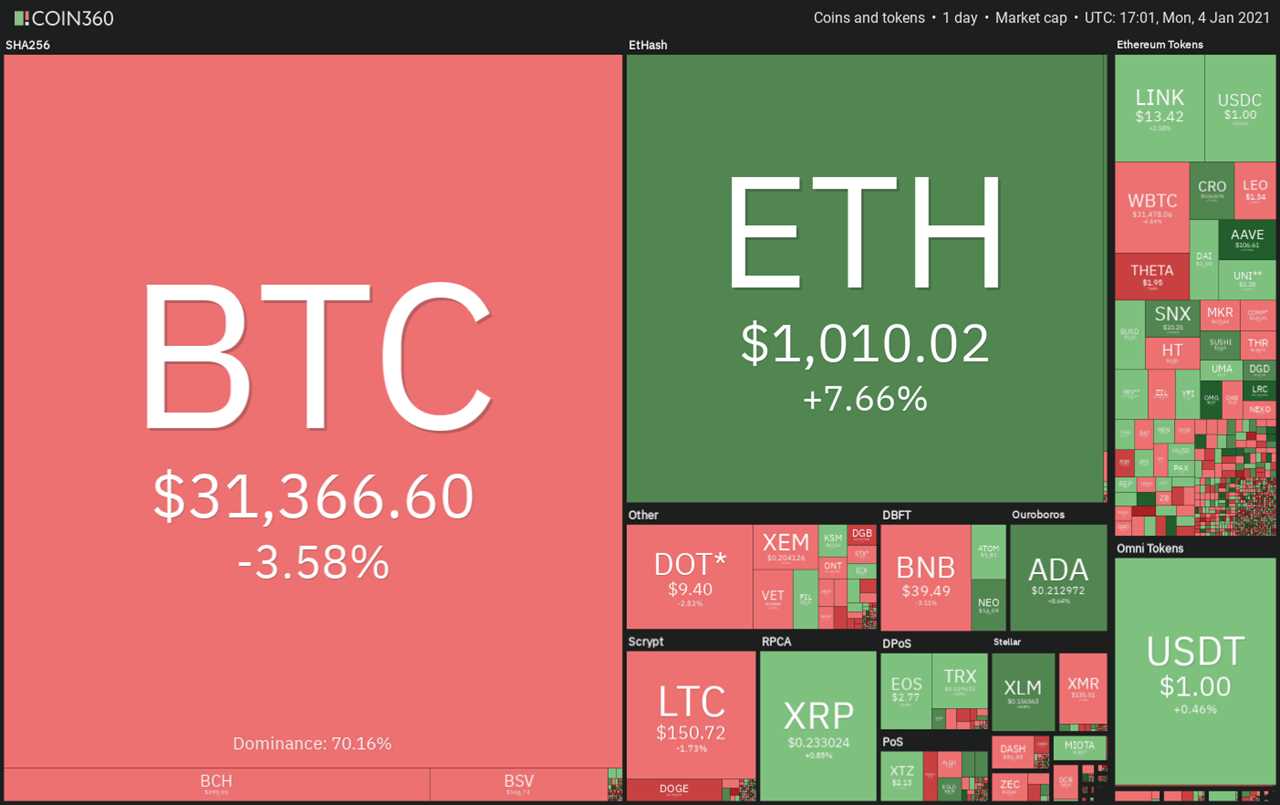
The huge bullish projection in BTC price is largely due to the institutional adoption of Bitcoin. In a recent interview with BBC, Galaxy Digital founder and CEO Mike Novogratz said: “As the institutions move in, there just is not a lot of supply [...] There are a lot more than 21 million millionaires out there.”
While the retail traders may have missed out on Bitcoin’s rally, they are coming back with a vengeance b buying altcoins that have surged to multi-year highs in the past few days. This has pulled Bitcoin’s dominance to below 69%.
However, will the rally in Bitcoin and the altcoins continue or is it time for a few days of consolidation or correction? Let’s analyze the charts of the top-10 cryptocurrencies to find out.
BTC/USD
Bitcoin's most recent leg of the uptrend had pushed the relative strength index (RSI) deep into the overbought territory, suggesting frenzied buying by the traders. Usually, such a phase is followed by a shakeout and that is what happened today.

The BTC/USD pair plummeted to an intraday low at $27,762.34, just below the 38.2% Fibonacci retracement level at $28,382.75. This sharp fall was aggressively purchased by the bulls as seen from the long tail on the day’s candlestick.
If the bulls manage to sustain the price above the 20-day exponential moving average ($26,737), it will suggest that the sentiment remains positive and the bulls are buying on dips.
However, after the large range day today, the pair may enter a period of consolidation for a few days before starting the next trending move. The pair may remain range-bound between $34,786.04 and $26,000.
Contrary to this assumption, if the price breaks below the 20-day EMA, it will suggest that traders are rushing to the exit and that could pull the pair to the 50-day simple moving average at $21,578.
ETH/USD
Ether (ETH) easily surmounted the $800 to $840.93 overhead resistance on Jan. 3, which shows aggressive buying by the bulls. The momentum continued today and the biggest altcoin reached an intraday high at $1,156.456.
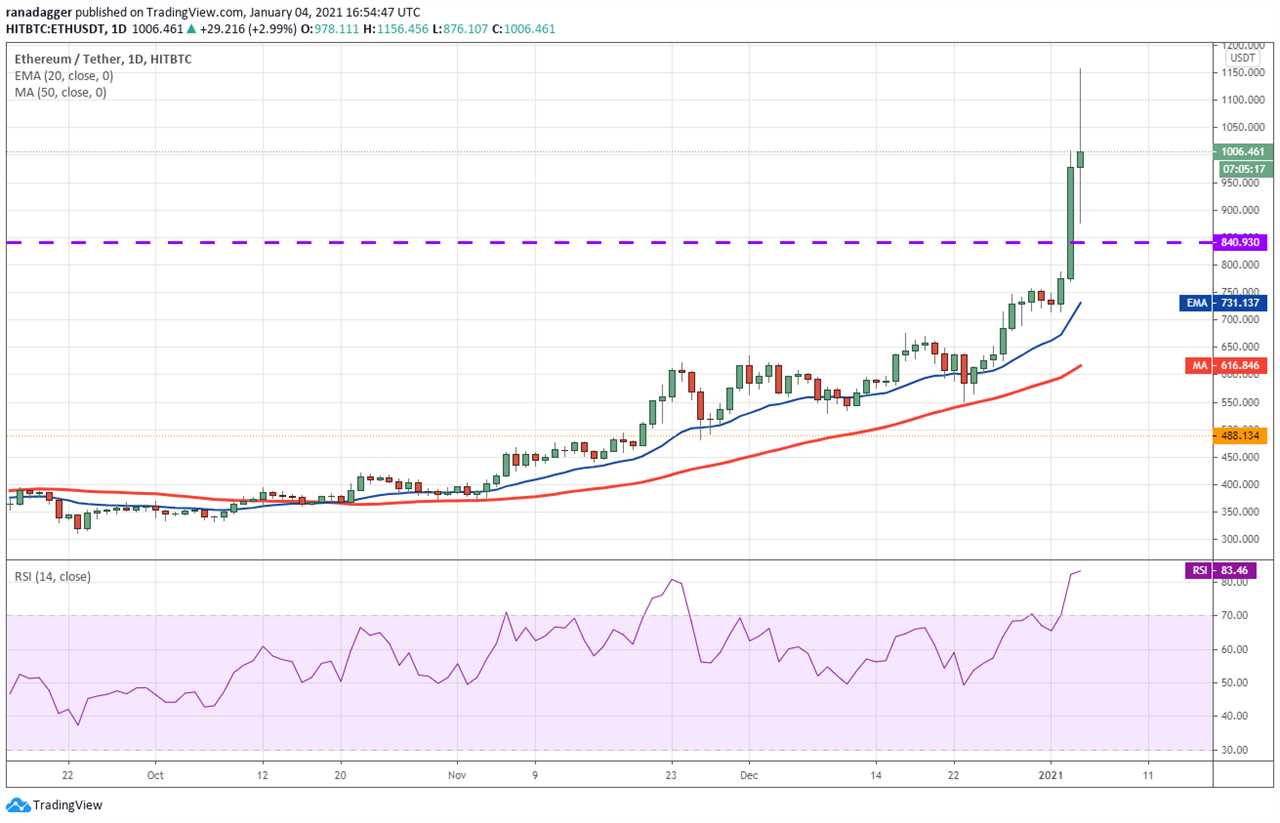
If the bulls can sustain the price above $1,000, it will increase the prospects for a rally to $1,260 and then to the all-time high at $1,420.
However, the long upper and lower shadows on today’s candlestick suggest profit booking at higher levels and accumulation at lower levels. After the large range today, the ETH/USD pair may consolidate in a tight range for a few days before starting the next trending move.
If the price does not dip below $840.93, it will suggest that traders are not closing their positions. In such a case, the bulls may attempt to resume the uptrend. This positive view will invalidate if the pair breaks below the 20-day EMA ($731).
XRP/USD
XRP is currently consolidating in a downtrend. After a sharp fall, if the price fails to rebound, it suggests a lack of urgency among traders to buy. A consolidation near the support increases the risk of a breakdown.
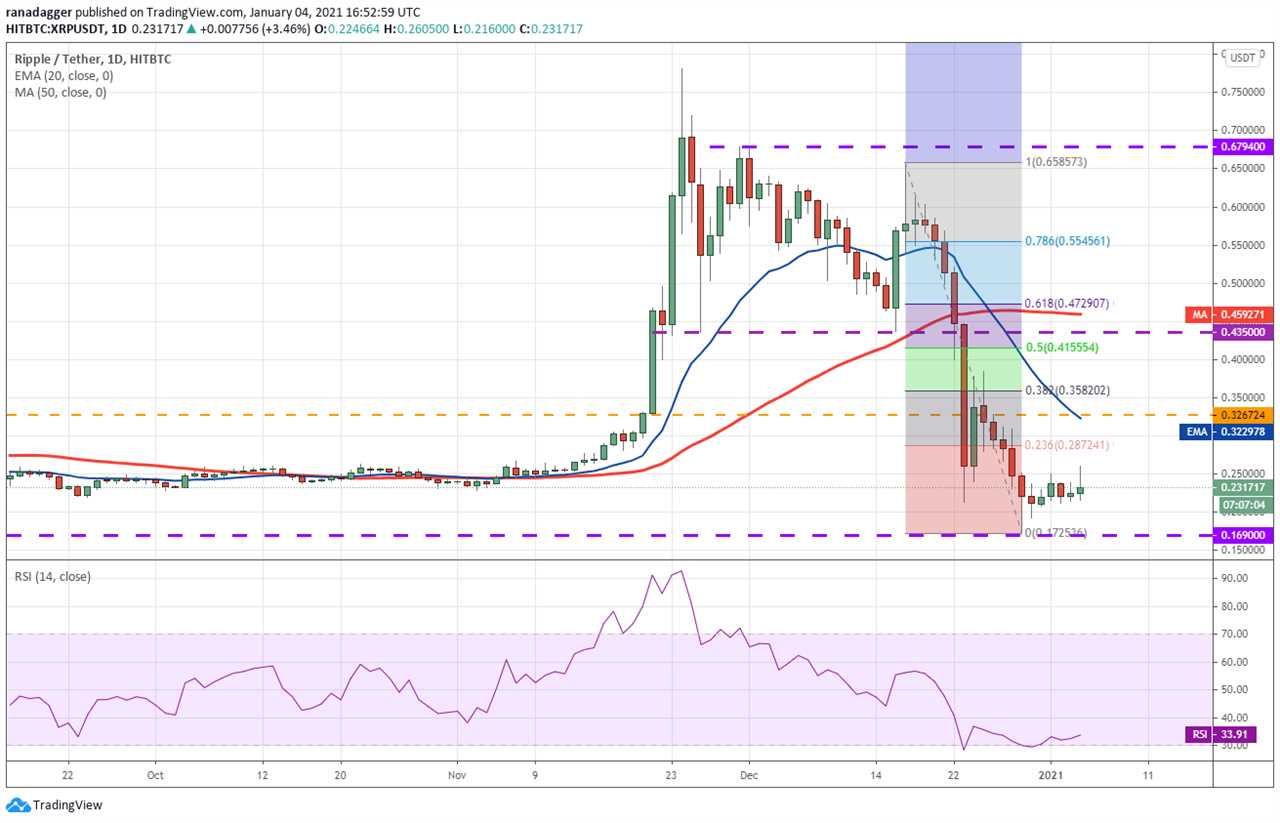
The downsloping 20-day EMA ($0.322) and the RSI near the overbought territory suggest that the path of least resistance is to the downside.
If bears sink the price below the $0.169 support, the XRP/USD pair could resume the downtrend towards the next target at $0.10.
Contrary to this assumption, if the consolidation resolves to the upside and the pair rises above the 20-day EMA, it will indicate that the selling has exhausted and a relief rally may be underway.
LTC/USD
Litecoin (LTC) bounced off the $124.1278 support on Jan. 2 and resumed the uptrend. The altcoin surged above the first target objective at $160 and hit an intraday high at $173.3312 today where it witnessed profit booking.
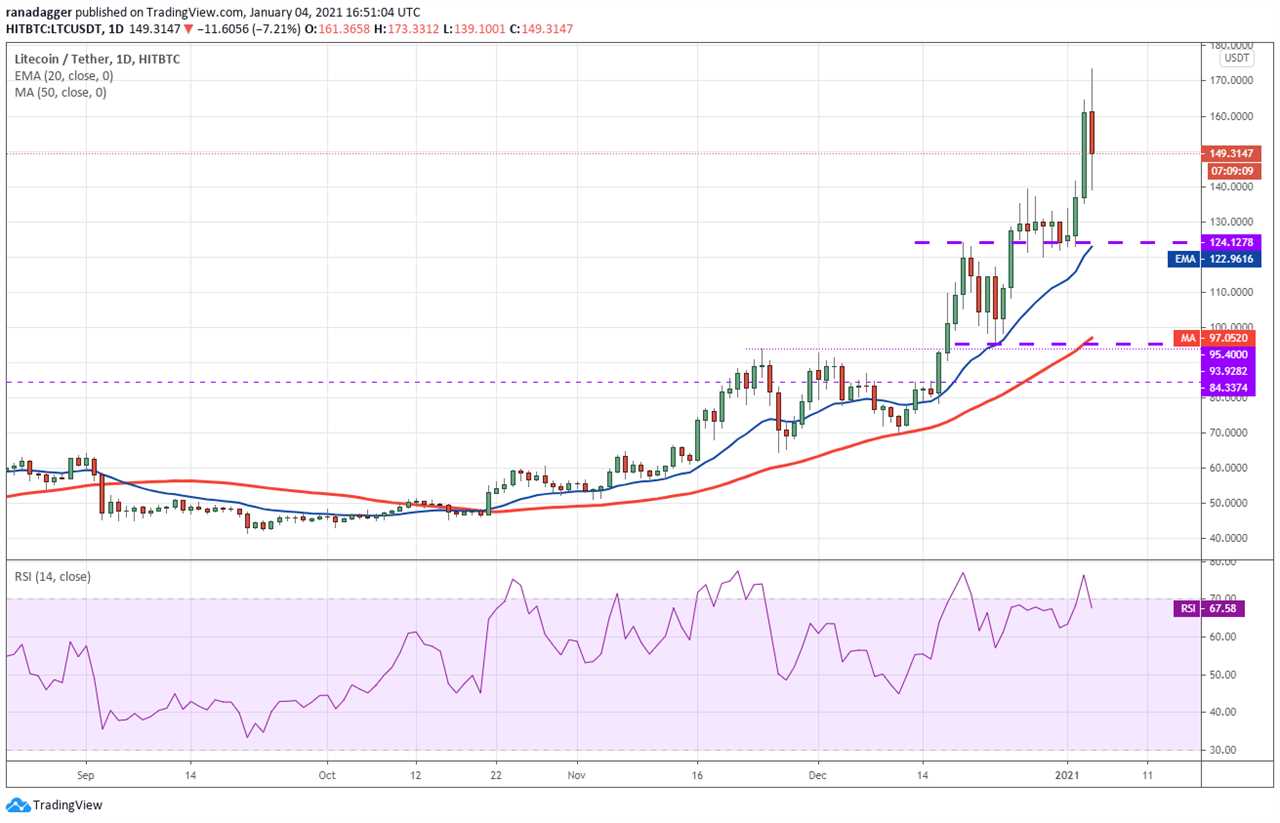
However, the positive thing is that the bulls aggressively purchased the dip to $140, which suggests that the sentiment remains positive. The rising moving averages and the RSI close to the overbought territory suggest bulls are in control.
After the large range day today, volatility may contract and the LTC/USD pair may consolidate in a tight range for the next few days.
If bulls can push the price above $173.3312, the pair could rally to $184.7940. The first sign of weakness will be a break below the 20-day EMA ($122.96).
DOT/USD
Polkadot (DOT) resumed the uptrend when it broke above the $9.50 to $9.89 overhead resistance on Jan. 3, but the rally hit a roadblock above $10.50 from where the price reversed direction today.

If traders buy the dip to the 38.2% Fibonacci retracement level at $8.4507, it will indicate strength. The bulls will then try to resume the uptrend. If they can push the price above $9.50, a retest of $10.5169 will be on the cards.
On the contrary, if the bears sink the price below the $8.4507 support, the correction could extend to the 50% retracement level at $7.8125. A break below this support will suggest that the momentum has weakened.
BCH/USD
Bitcoin Cash (BCH) bounced off the 20-day EMA ($340.94) on Jan. 2 and soared above the $370 overhead resistance on Jan. 3. That opened the gates for a rally to the $497 to $515.35 resistance zone.
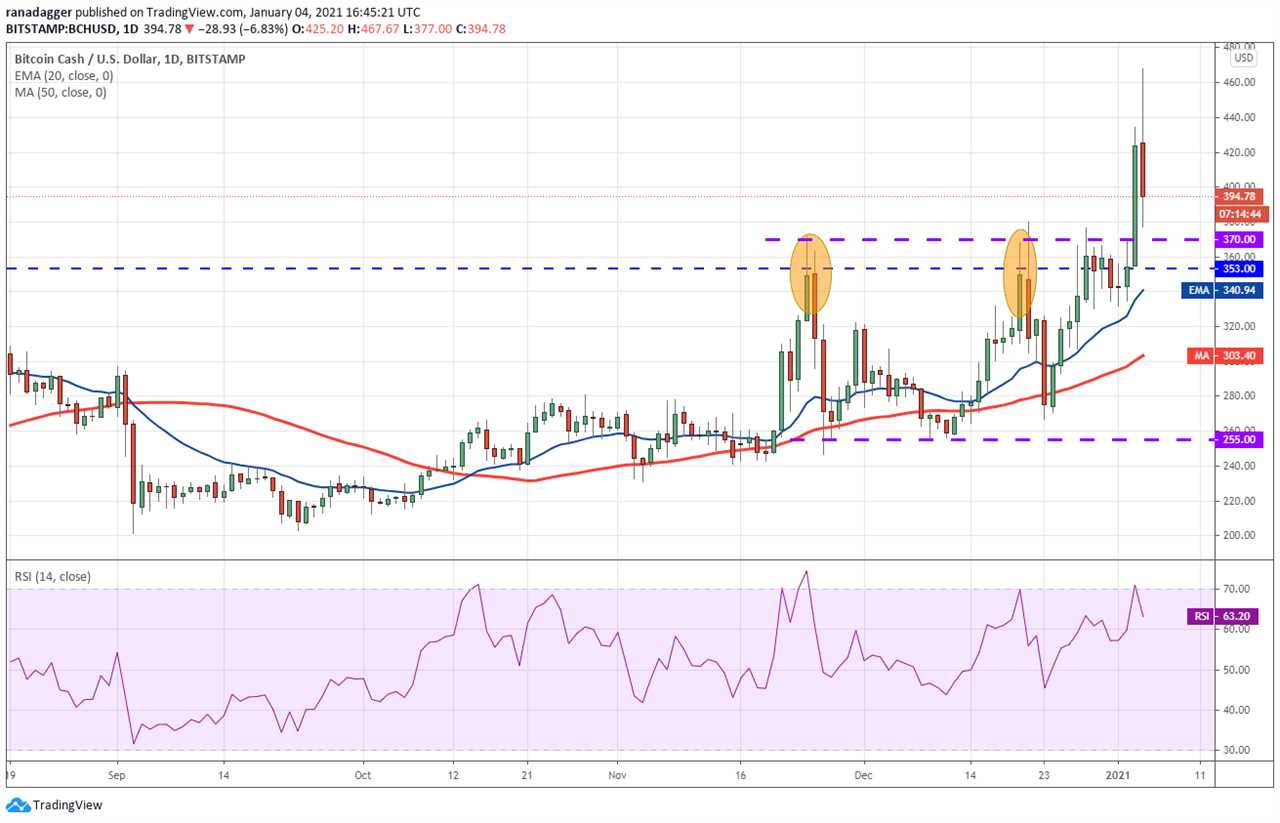
However, traders aggressively booked profits at higher levels today, which has dragged the price back towards the breakout level at $370.
The upsloping moving averages and the RSI in the positive territory suggest that bulls have the upper hand. If the BCH/USD pair rebounds off this support, the bulls may again attempt to push the price to $515.35.
This positive view will be invalidated if the bears sink and sustain the price below $353. Such a move will suggest that the markets have rejected the higher levels and that could lead to a range-bound action.
ADA/USD
Cardano (ADA) rebounded off the 20-day EMA ($0.173) on Jan. 2 and resumed the uptrend on Jan.3 when it broke above $0.1966315. Today, the altcoin surged to an intraday high at $0.2399022, but the bulls could not sustain the higher levels.
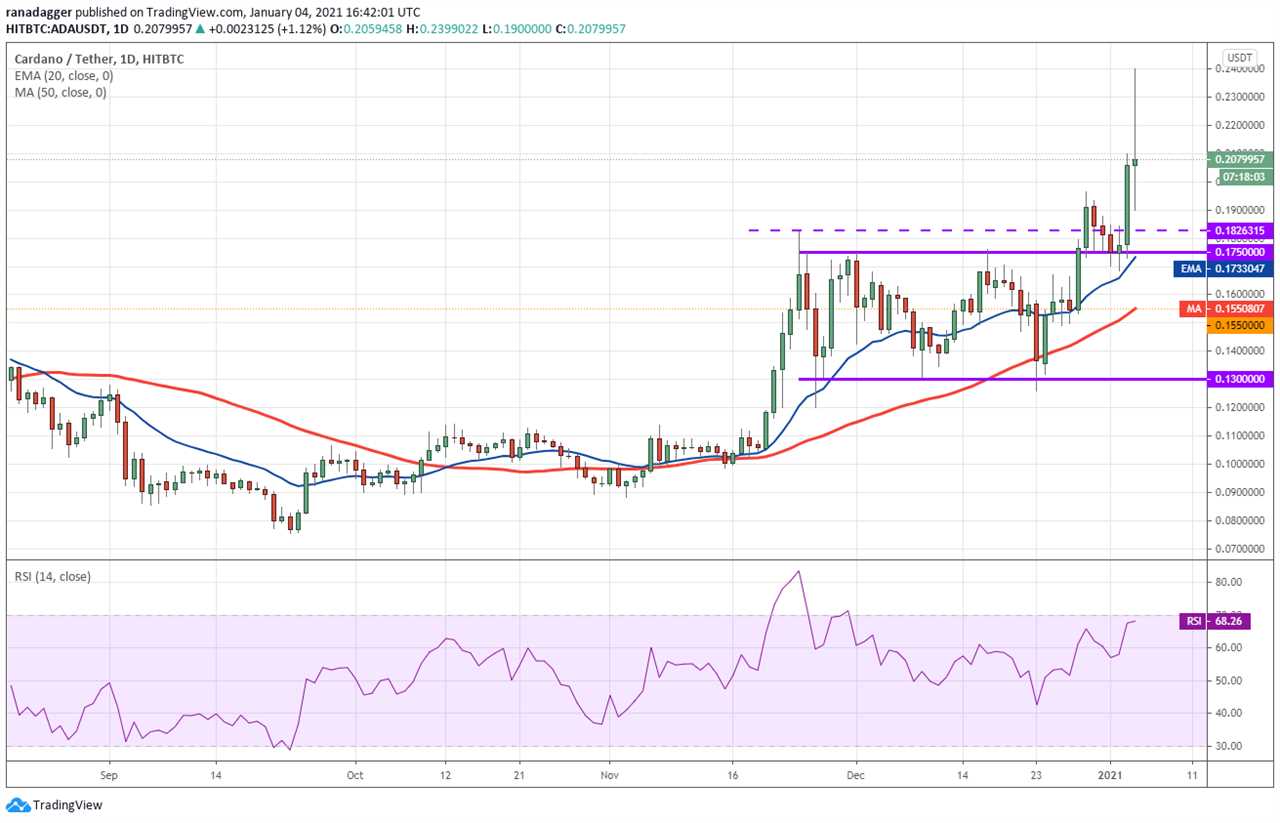
The Doji candlestick pattern today suggests indecision among the bulls and the bears. While the bears are selling at higher levels, the bulls continue to buy on dips.
After the large range day today, the volatility could subside in the next few days as the bulls and the bears battle it out for supremacy.
The upsloping moving averages and the RSI close to the overbought zone suggest advantage to the bulls. The ADA/USD pair may resume its up-move if the bulls can sustain the price above $0.21.
A break below the 20-day EMA will be the first sign of weakness and the correction could deepen if the 50-day SMA ($0.155) support cracks.
BNB/USD
Binance Coin (BNB) turned down sharply from the $43.2029 levels today, which suggests profit booking at higher levels. However, the upsloping moving averages and the RSI in the positive zone suggest that the trend remains up.
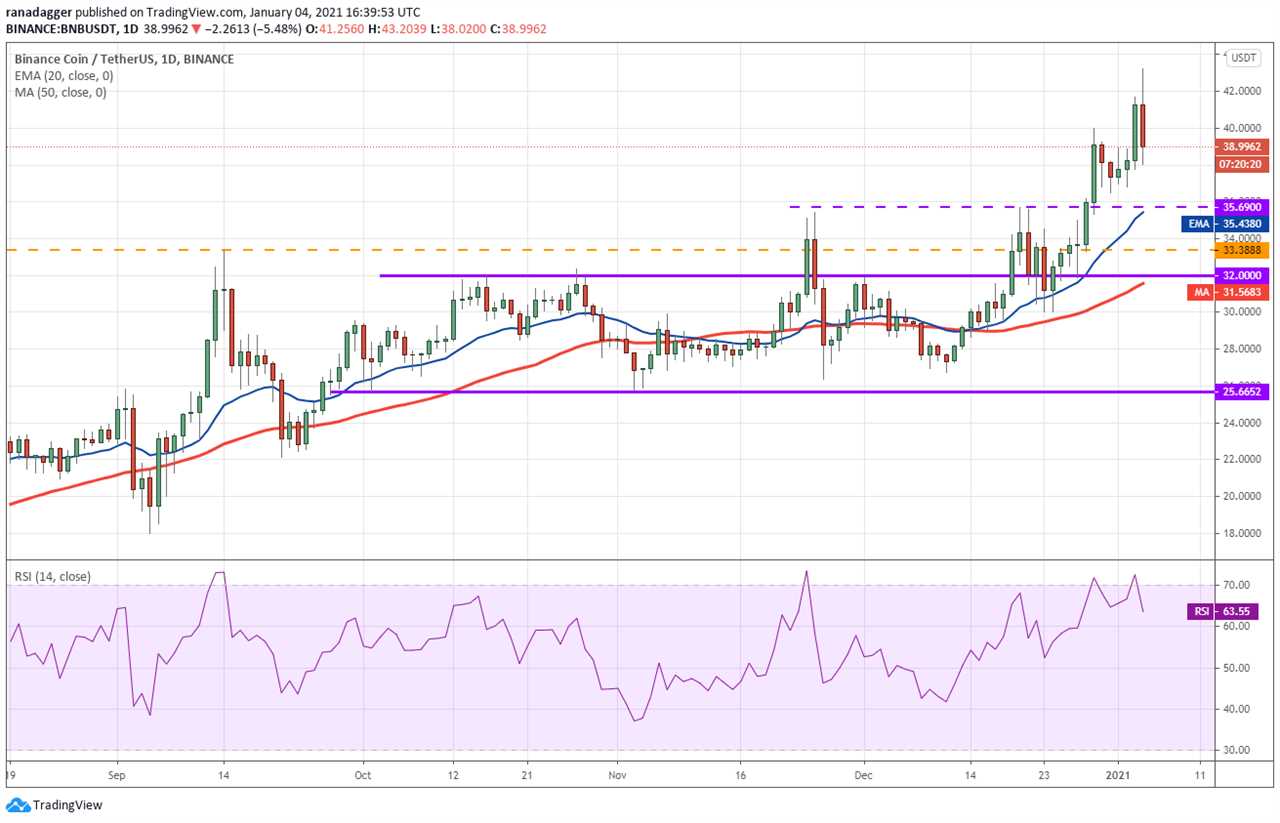
If the price rebounds off the 20-day EMA ($35), it will suggest that traders continue to accumulate on dips. The bulls will then try to resume the uptrend and propel the price to the target objective at $50.
Contrary to this assumption, if the bears sink and sustain the price below the 20-day EMA, it will suggest that the momentum has weakened and traders are not buying on dips. That could pull the price down to $32 and result in a few days of range-bound action.
LINK/USD
Chainlink (LINK) broke above the descending channel and the $13.28 overhead resistance on Jan. 3. This opened the doors for a rally to $16.39 and the altcoin hit an intraday high at $15.644 today.

However, the long wick on today’s candlestick shows that traders aggressively booked profits at higher levels but the positive sign is that the LINK/USD pair found buying support near the 20-day EMA ($12.36).
If the price sustains above $13.28, the bulls will again try to push the price to $16.39 and then to $20.1111. Conversely, if the price slides below the moving averages, the pair may drop to $11.29 and then to $10.
BSV/USD
The long wick on today’s candlestick suggests that the bulls failed to sustain Bitcoin SV (BSV) above the $181 overhead resistance as the bears defended this level aggressively.
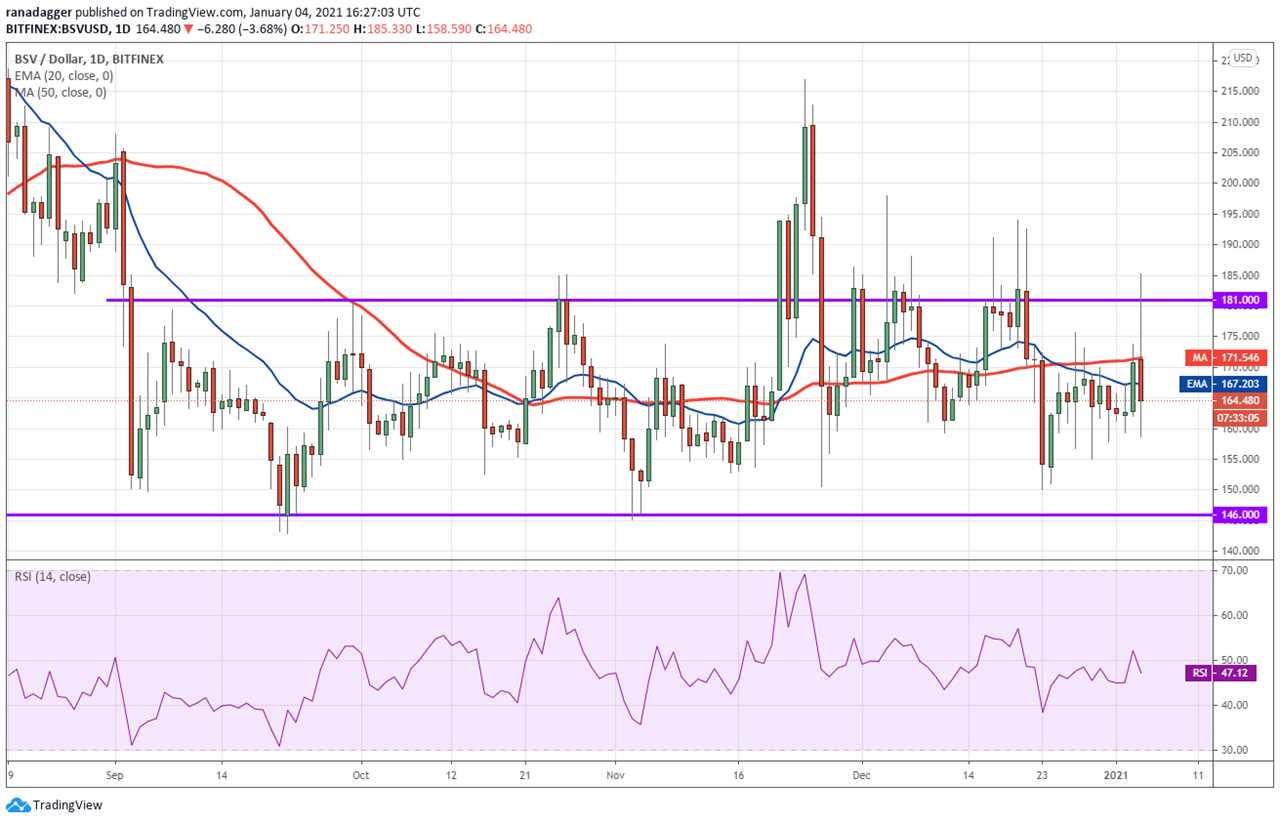
The price has currently dropped below the moving averages. If the bears sink the price below $160, the BSV/USD pair may drop to the support of the range at $146.
Conversely, if the price rebounds off the current levels and rises above $175, the bulls will make one more attempt to propel the pair above $181. If they succeed, a rally to $215 is possible.
However, the flat moving averages and the RSI just below the midpoint are not signaling an advantage either to the bulls or the bears.
Market data is provided by HitBTC exchange.
Title: Price analysis 1/4: BTC, ETH, XRP, LTC, DOT, BCH, ADA, BNB, LINK, BSV
Sourced From: cointelegraph.com/news/price-analysis-1-4-btc-eth-xrp-ltc-dot-bch-ada-bnb-link-bsv
Published Date: Mon, 04 Jan 2021 20:56:26 +0000
Did you miss our previous article...
https://trendinginthenews.com/crypto-currency/what-lies-ahead-for-crypto-and-blockchain-in-2021-experts-answer


