
Bitcoin (BTC) price hit a new all-time high above $19,892 on Dec. 1. This is a significant event because it proves that the rally in 2017 was ahead of fundamentals but not a bubble. Generally, when a bubble bursts, it takes several years for the price to cross the high made during the bubble.
For example, the Japanese stock market bubble came after a high was made way back in 1989 and that level has not been conquered yet. Similarly, silver’s high close to $50 per ounce was made in 1980 and the price came close to that level only in 2011. The NASDAQ made its high made during the dot-com bubble in 2000 and thi was only crossed in 2015.
Now that it has been established that Bitcoin was not in a bubble, the next question in the minds of traders is how high can BT price go?
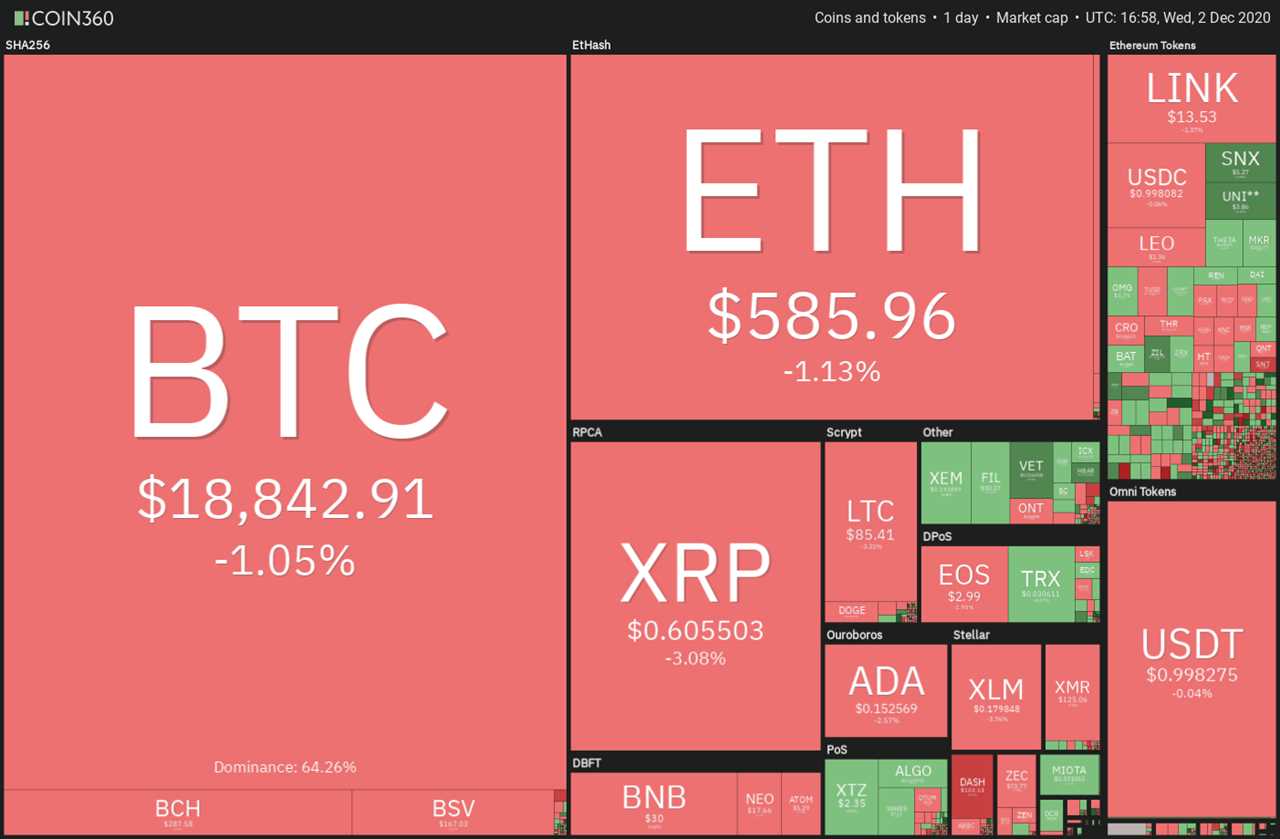
Several analysts have forecast target levels according to their assumptions and calculations. However, traders should not get carried away with lofty targets because even strong uptrends witness nerve-racking corrections. Traders should aim to trade with the major trend because it generally proves to be profitable.
The increasing interest from the institutional investors suggests that the uptrend could still have some steam left. Reports suggest that it took only three investors to raise $150 million in two separate cryptocurrency funds by the New York Digital Investment Group. While the fundamentals look strong, do the technicals also support a further rally?
Let’s analyze the charts of the top-10 cryptocurrencies to find out.
BTC/USD
Bitcoin (BTC) hit a new all-time high on Dec. 1 and quickly reversed direction, which shows profit booking at higher levels. However, the long tail on the day’s candlestick shows that the sentiment remains bullish because the bulls purchased the intraday dip.
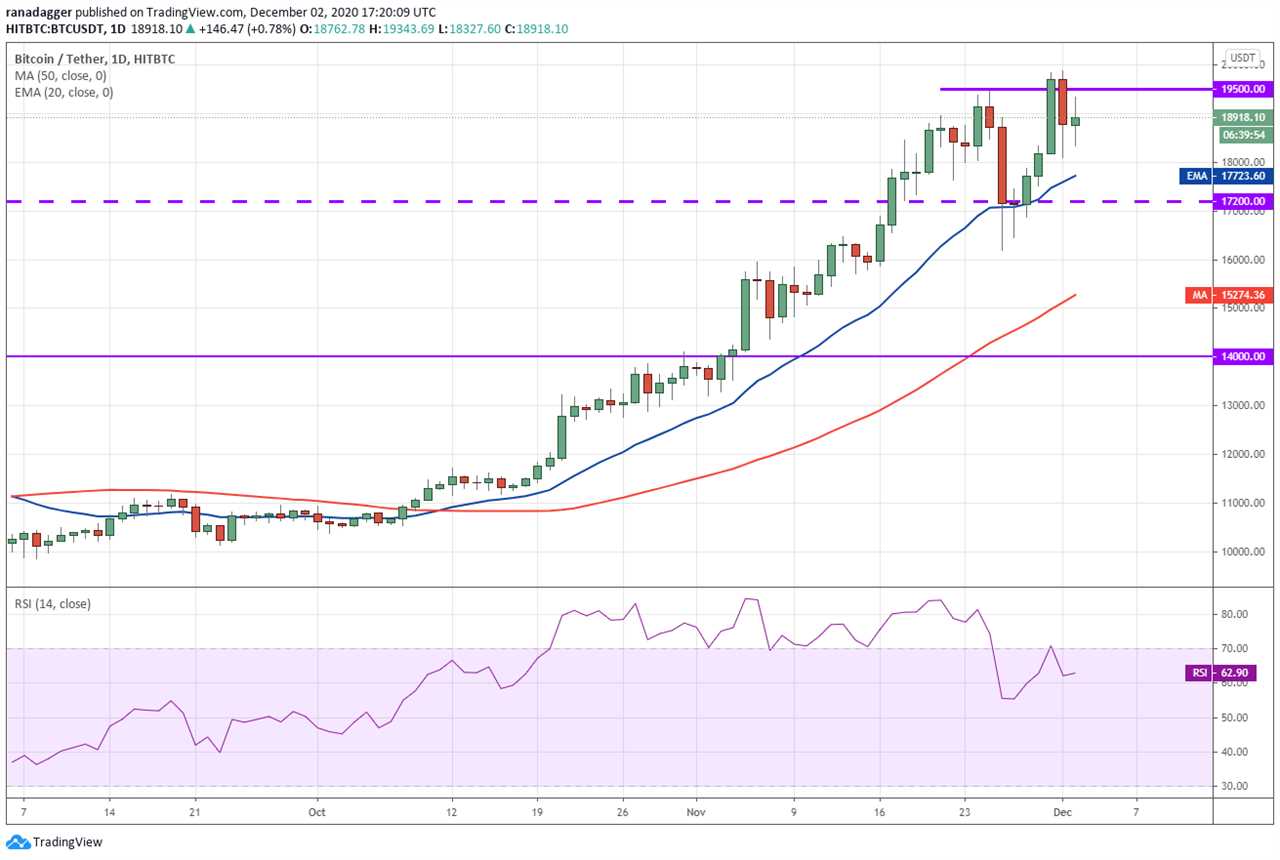
Both moving averages are sloping up and the relative strength index (RSI) in the positive territory suggests that bulls have the upper hand. The buyers will now try to propel the price above the $20,000 psychological resistance.
If they succeed, the momentum could pick up and the BTC/USD pair may rally to $22,727 and then to $25,000.
However, if the price turns around from the $19,500 to $20,000 resistance zone, it will suggest that the bears are aggressively selling at higher levels. In such a case, the pair may consolidate for a few days before attempting to resume the uptrend.
The first sign of a break in the bullish momentum will be a slide below the 20-day exponential moving average ($17,723). The advantage will shift in favor of the bears if the pair plummets below $16,191.
ETH/USD
Ether (ETH) broke above the $622.807 resistance and hit an intraday high of $635.456 on Dec. 1. However, the bulls could not sustain the breakout and that could have trapped a few aggressive buyers who closed their positions in a hurry.
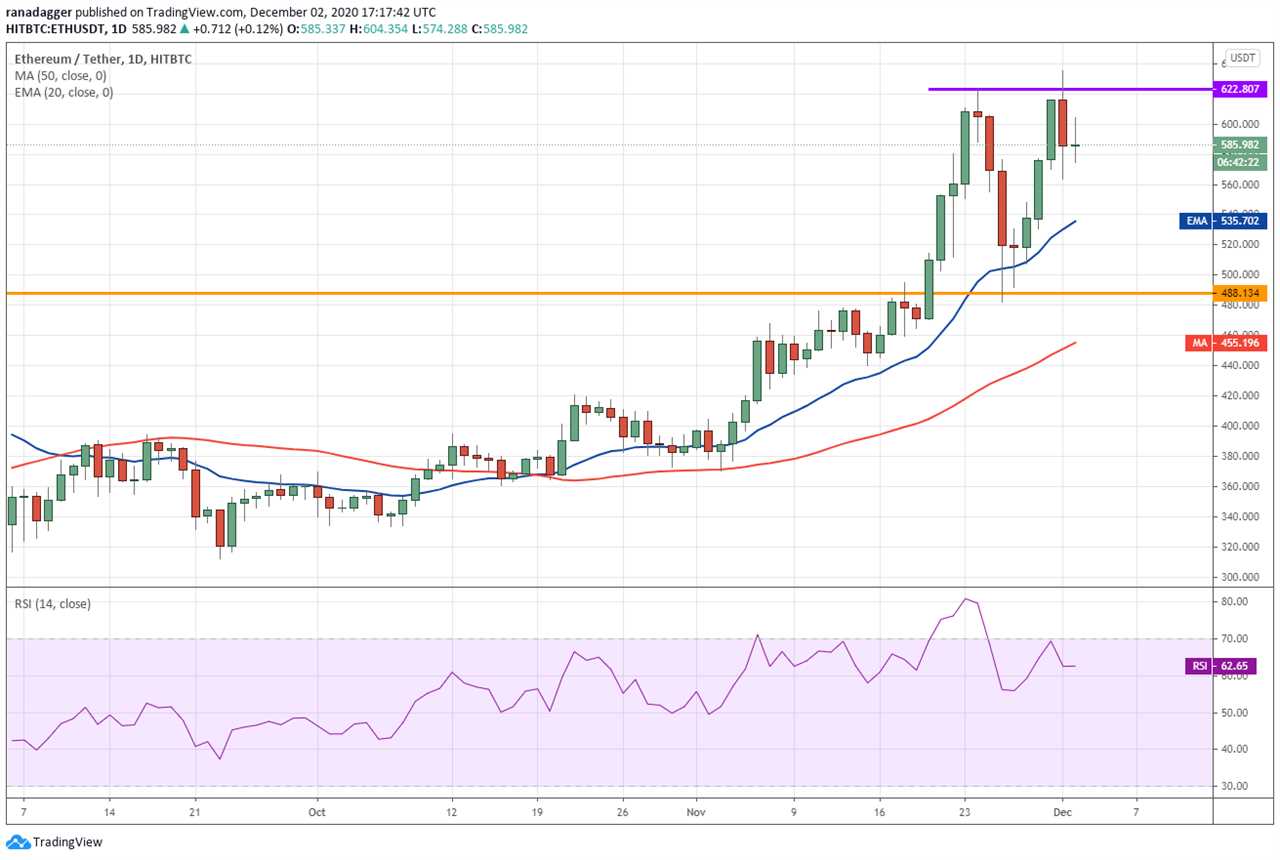
That pulled the price back below $600. The upsloping moving averages and the RSI in the positive zone suggest that bulls are in command.
However, the inside day Doji candlestick pattern today suggests indecision among the bulls and the bears. If the bulls push the price above the overhead resistance zone, the next leg of the uptrend to $800 could be on the cards.
Contrary to this assumption, if the bears sink the price below the 20-day EMA ($535), a drop to $488.134 is possible.
XRP/USD
XRP closed above the 61.8% Fibonacci retracement level of $0.649138 on Nov. 30 but the bulls could not capitalize on this strength. This shows that the bears are selling on rallies.
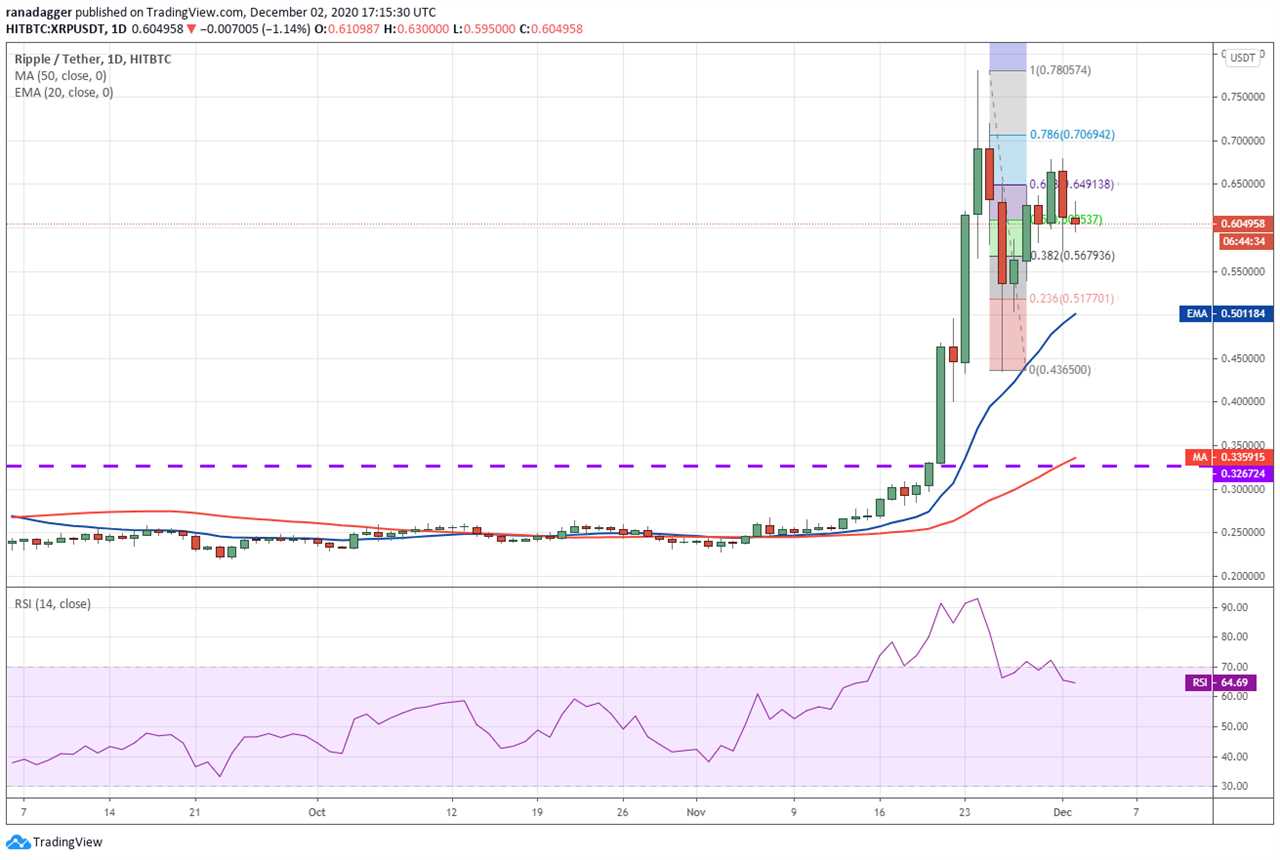
The XRP/USD pair turned down sharply on Dec. 1 but the long tail on the candlestick shows buying at lower levels. When bears sell on rallies and bulls buy on dips, it is an early sign of a range formation.
The pair has formed an inside day candlestick pattern today, which suggests indecision among the bulls and the bears about the next directional move.
If the bears sink the price below $0.565, a drop to the 20-day EMA ($0.50) is possible. However, if the bulls push the price above $0.68, the pair may rally to $0.780574.
LTC/USD
Litecoin (LTC) turned down from the $93.9282 resistance on Dec. 1 but the positive sign is that the bulls are buying the dips below $84.3374. This suggests that the sentiment is positive.
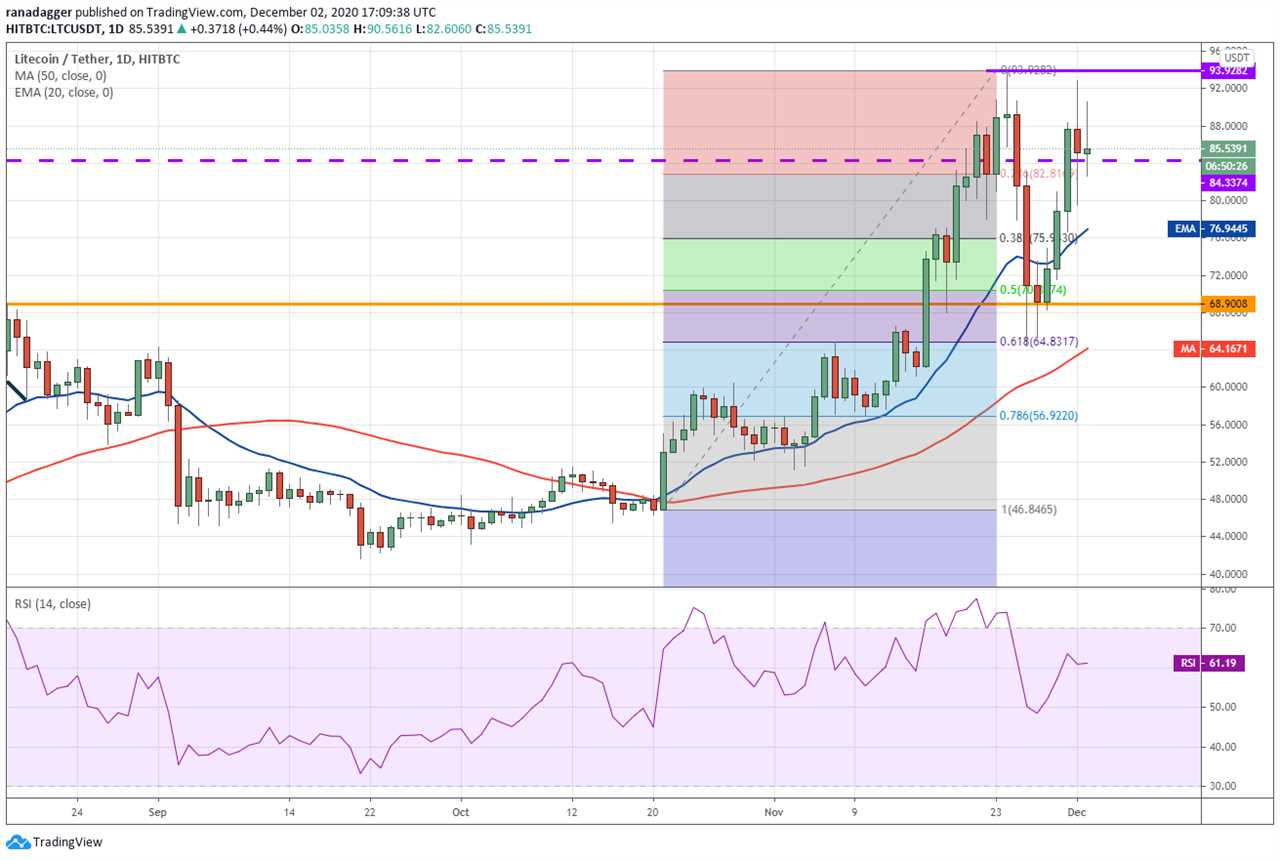
The rising moving averages and the RSI above 61 suggest that the bulls are in control. If the price sustains above $84.3374, the bulls will make another attempt to clear the overhead resistance.
If they succeed, the next leg of the up-move to $100 may begin. Conversely, if the price turns down from the overhead resistance, a few more days of range-bound action is possible.
A break below the 20-day EMA ($76) will be the first indication that the bears are making a comeback.
BCH/USD
The bulls could not push Bitcoin Cash (BCH) above the 61.8% Fibonacci retracement level at $324.01 on Nov. 30 and Dec. 1. This attracted profit booking and the altcoin plunged to the 20-day EMA ($283).
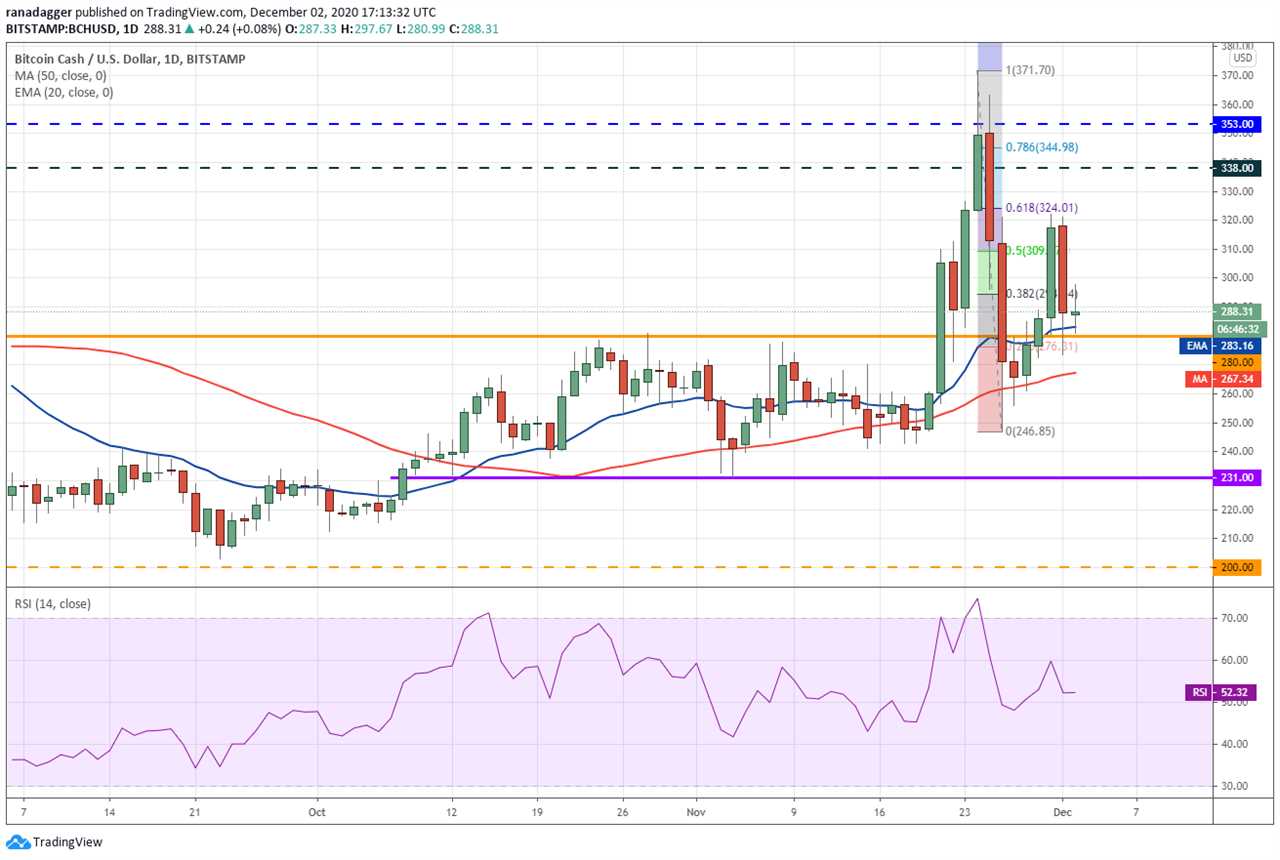
The weak rebound off the 20-day EMA suggests a lack of urgency among the bulls to buy at the current levels. If the BCH/USD pair does not pick up momentum, the possibility of a break below the $280 support increases.
If the bears sink the price below the 50-day simple moving average, the pair could drop to $246.85 and then to $231. This negative view will be invalidated if the pair picks up momentum and rises above $324.01. If that happens, a rally to $344.98 and then to $371.70 will be on the cards.
LINK/USD
Chainlink (LINK) rose above the 61.8% Fibonacci retracement level of $14.4433 on Dec. 1 but the bulls could not sustain the higher levels. This suggests that bears are selling on minor rallies.
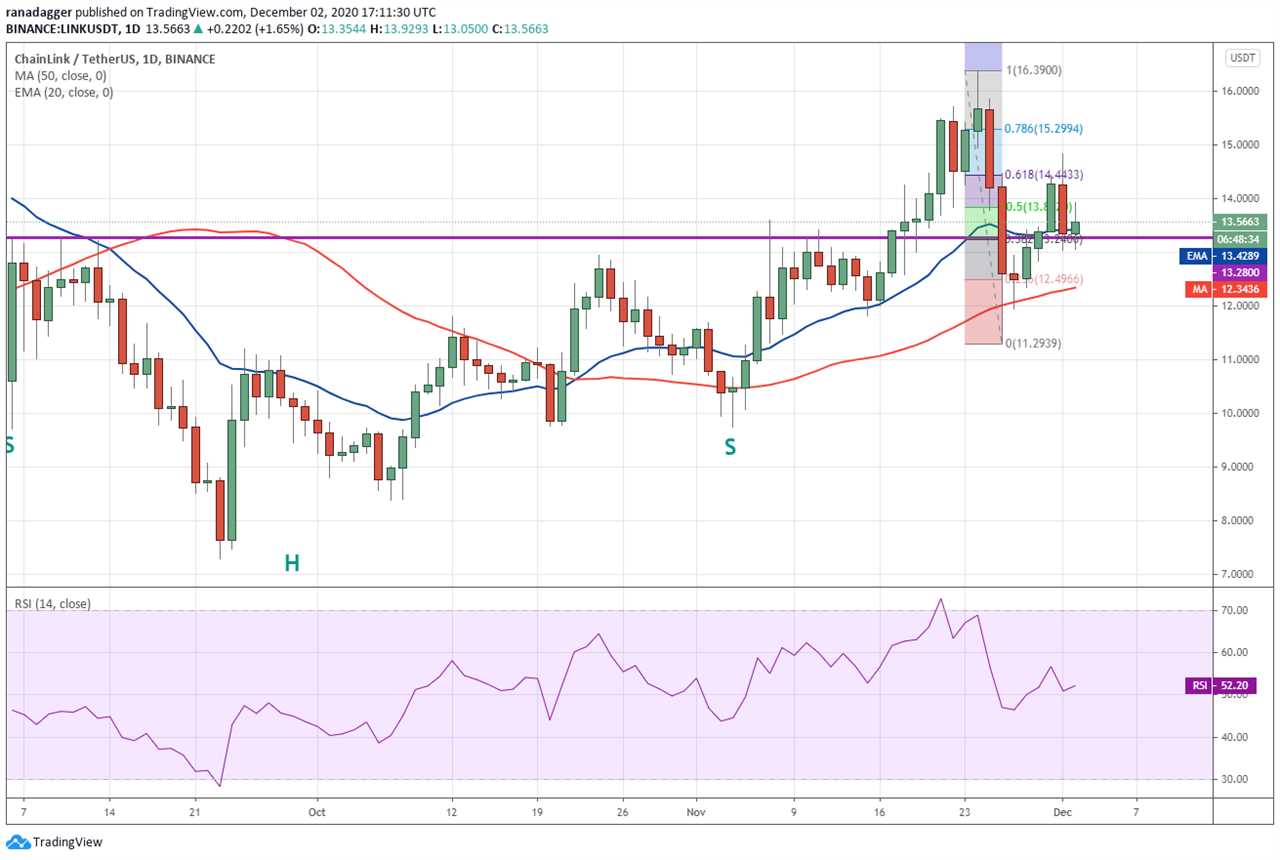
However, the failure of the bears to sink and sustain the price below the $13.28 support shows that lower levels are attracting buyers. The flat 20-day EMA ($13.43) and the RSI close to the midpoint suggest a few days of range-bound action.
If the bulls push the price above $14.8328, the LINK/USD pair could rise to $16.39. A breakout of this resistance could see the momentum pick up. On the contrary, if the bears sink the price below $13.28, a retest of 50-day SMA ($12.34) is possible.
DOT/USD
Polkadot (DOT) turned down from $5.5429 on Dec. 1, which shows that the bears are aggressively defending the $5.5899 resistance. However, a minor positive is that the altcoin has bounced off the 20-day EMA ($5.04).
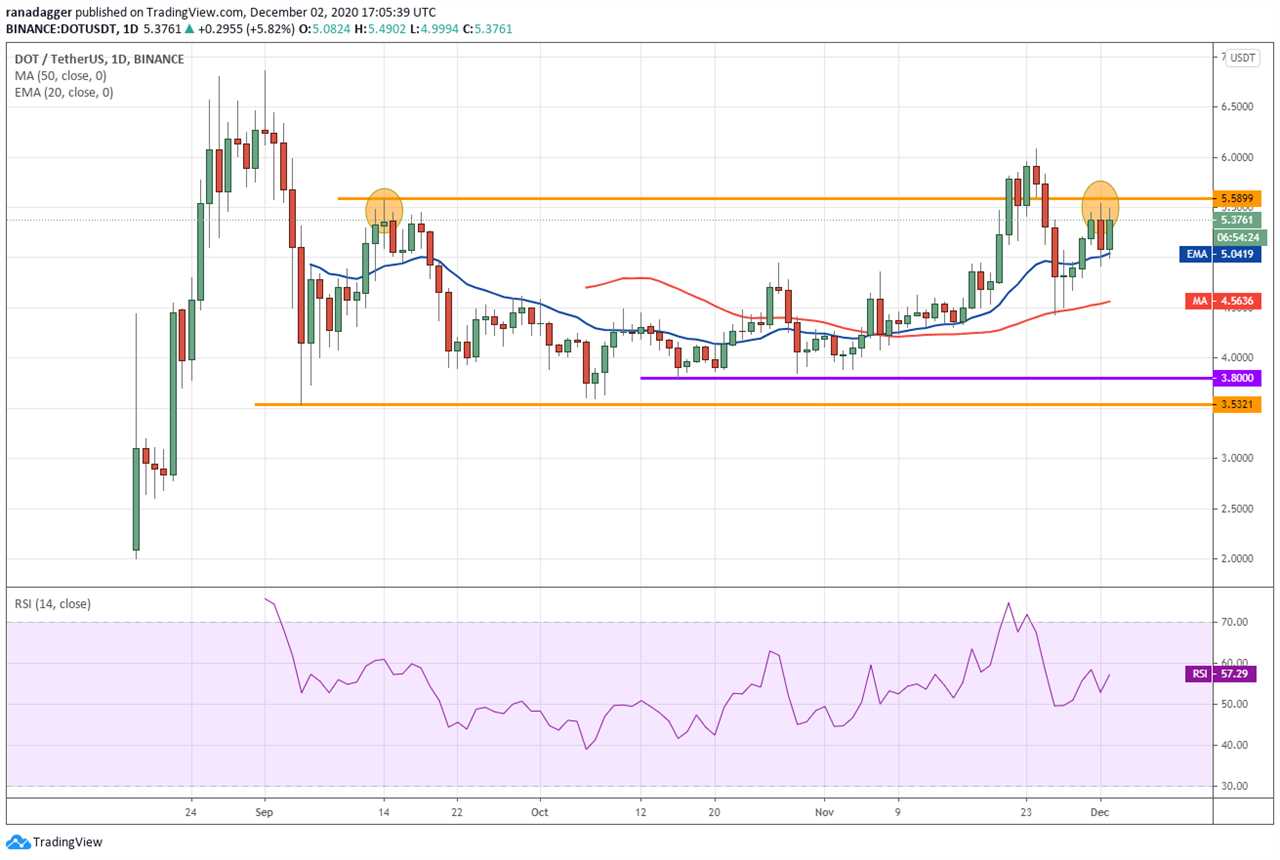
The gradually upsloping 20-day EMA and the RSI above 57 suggest a minor advantage to the bulls. The buyers will now again try to propel the price above the $5.5899 to $6.0857 resistance zone.
If they succeed, the next leg of the uptrend to $6.8619 and then to $7.64 may begin. This bullish view will be invalidated if the bears sink the price below the 20-day EMA. In such a case, the DOT/USD pair could drop to the 50-day SMA ($4.56).
ADA/USD
The bears are defending the $0.175 level in Cardano (ADA). The failure to rise above this resistance attracted profit booking on Dec. 1 and pulled the price down to the 20-day EMA ($0.140).
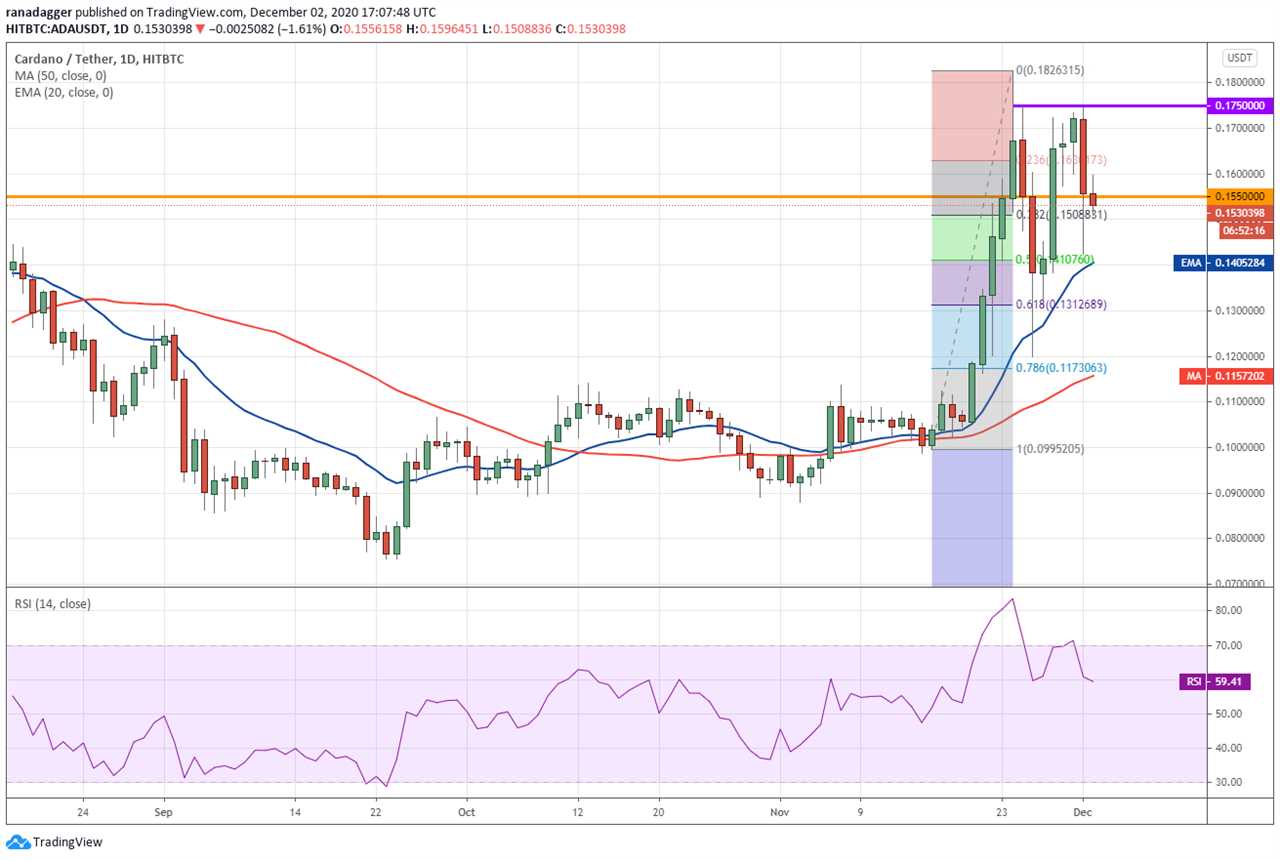
The bulls are aggressively buying the dips to the 20-day EMA and are trying to keep the price above $0.155. If they manage to sustain the price above this level, the ADA/USD pair may again reach $0.175.
If the price turns down from this resistance, a few days of range-bound action is possible. On the other hand, if the pair turns down from the current levels and breaks below the 20-day EMA, the correction could deepen to the 50-day SMA ($0.115).
BNB/USD
Binance Coin (BNB) turned down from the $32 overhead resistance on Dec. 1 and corrected to the moving averages. This shows that the bears are defending this resistance as they want to keep the altcoin range-bound between $25.6652 and $32.
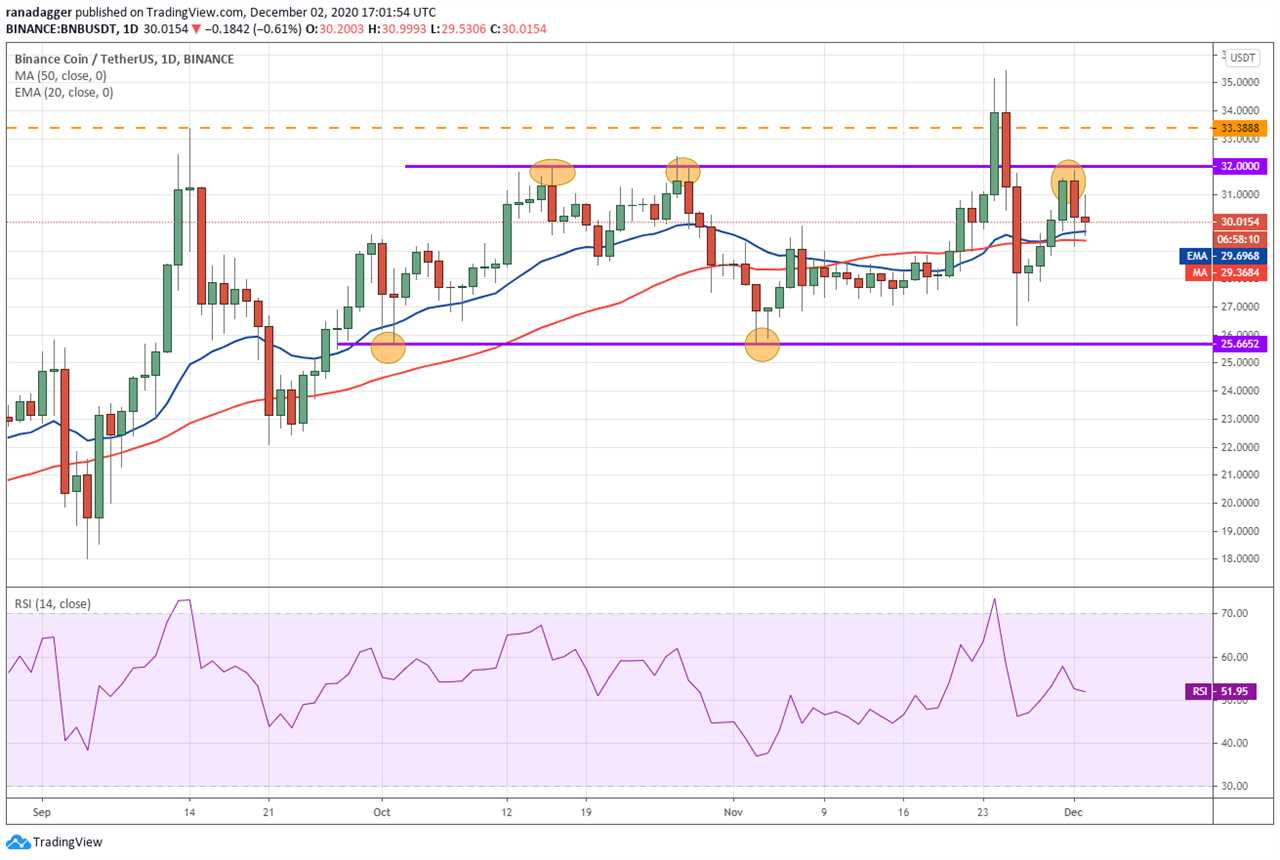
Although the bulls purchased the dip to the moving averages on Dec. 1, they have not been able to sustain the buying pressure today. This suggests hesitation to buy near the overhead resistance.
If the bears sink the price below the moving averages, the BNB/USD pair could drop to $25.6652.
The flat moving averages and the RSI above 51 do not indicate a major advantage to either the bulls or the bears. Hence, a few days of range-bound action is possible.
XLM/USD
Failure of the bulls to push the price above the downtrend line attracted profit booking in Stellar Lumens (XLM) on Dec. 1. However, the bears are not able to sustain the lower levels as seen from the long tail on the candlestick.
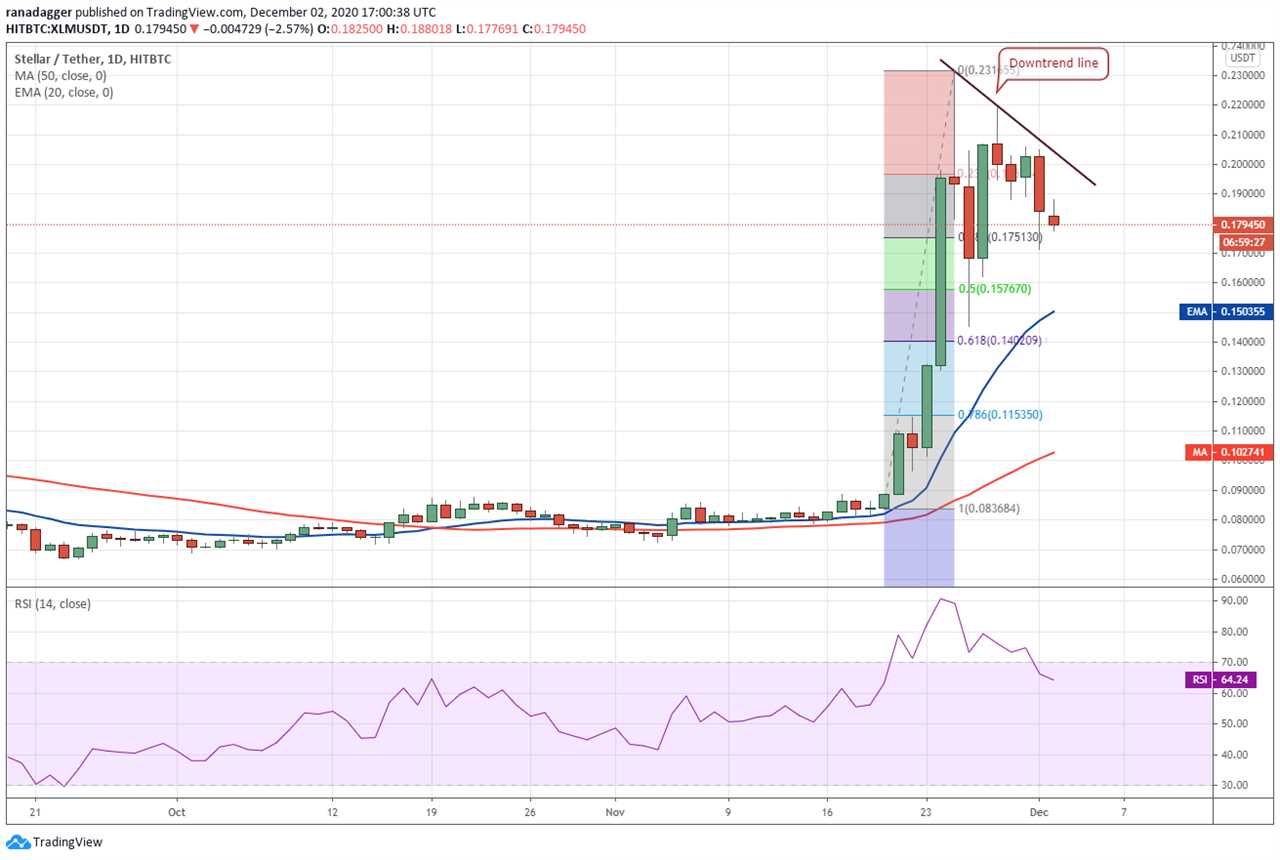
The inside day candlestick pattern today suggests indecision among the bulls and the bears about the next directional move. If the bulls again fail to propel the price above the downtrend line, a deeper correction to the 20-day EMA ($.0.15) is possible.
Both moving averages are sloping up and the RSI is in the positive zone. This suggests that the sentiment is positive and the bulls may buy the dips to the 20-day EMA. A strong rebound off this level could keep the XLM/USD pair range-bound for a few days.
A break above the downtrend line will signal strength and could result in a retest of the Nov. 25 high at $0.231655.
Market data is provided by HitBTC exchange.
Title: Price analysis 12/2: BTC, ETH, XRP, LTC, BCH, LINK, DOT, ADA, BNB, XLM
Sourced From: cointelegraph.com/news/price-analysis-12-2-btc-eth-xrp-ltc-bch-link-dot-ada-bnb-xlm
Published Date: Wed, 02 Dec 2020 18:37:04 +0000
Did you miss our previous article...
https://trendinginthenews.com/crypto-currency/multiutility-tokens-to-enable-web-30-by-providing-more-than-financial-value


