
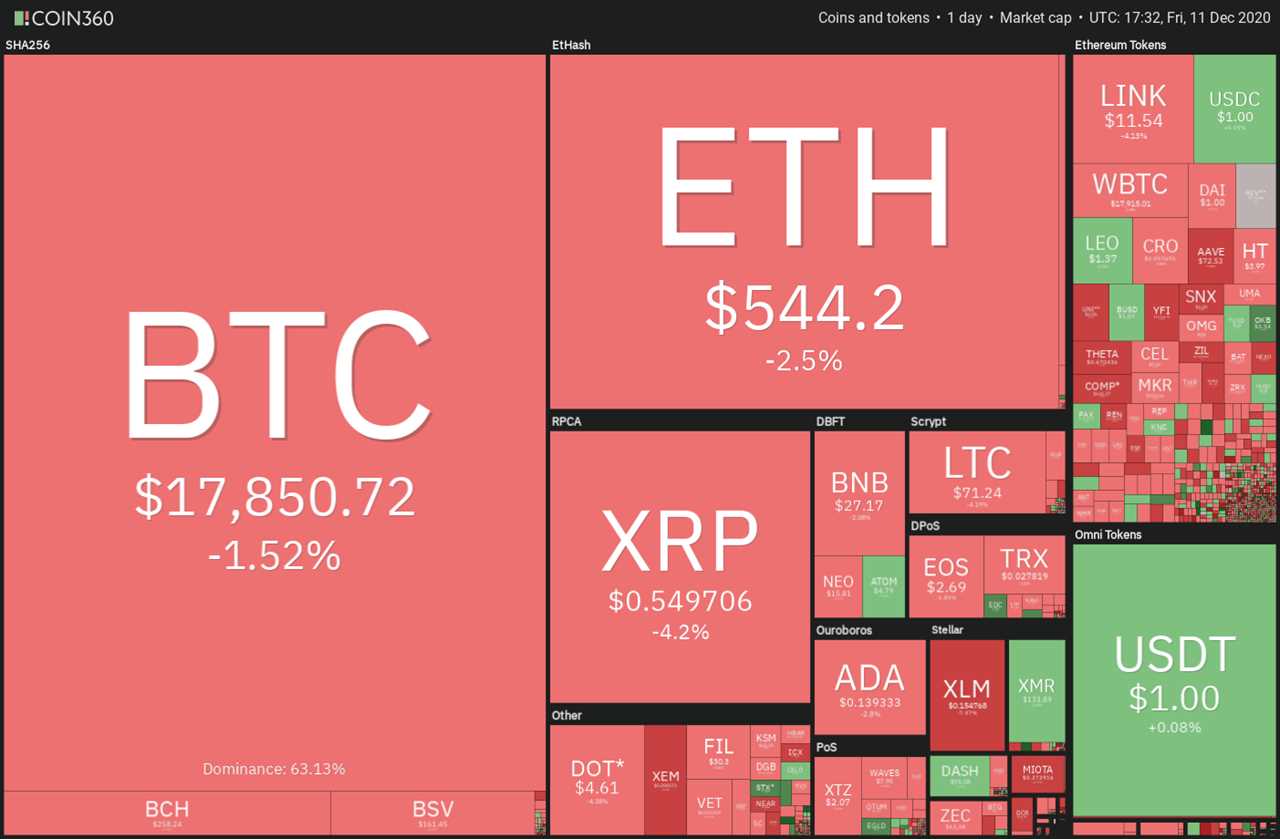
Bitcoin (BTC) price has been gradually giving up ground for the past few days and that has a few investors afraid that a sharp correction or a bear market similar to the one in 2018 could occur again. However, there are major differences between the previous bull market and the current one.
The most notable difference is the arrival of institutional investors. The latest institution to have taken a position in Bitcoin is Massachusetts-based insurance firm MassMutual, which recently purchased 5,470 BTC for roughly $100 million.
To date, a variety of institutional players ranging from hedge fund managers to publicly listed companies and now a 169-year old insurance company have purchased Bitcoin.
Usually, institutional investors do not dump their holdings with every correction because they buy only after considering the long-term fundamentals. Hence, most price drops are viewed as an opportunity to add to their holdings.
Ruchir Sharma, chief global strategist at Morgan Stanley Investment Management, has said that the dollar’s reign as the world’s reserve currency could be coming to an end and Bitcoin could be the beneficiary due to the “widening distrust in the traditional alternatives.”
With several institutional investors echoing a bullish view on Bitcoin, any correction is likely to attract more institutions who may take advantage of the fall to buy.
Let’s analyze the top-10 cryptocurrencies and spot the critical support levels where buyers may step in.
BTC/USD
The long tail on Dec. 9 candlestick shows that the bulls purchased the dip below the 20-day exponential moving average ($18,283) but they could not sustain the momentum on Dec. 10. Bitcoin (BTC) again succumbed to selling pressure and closed below the 20-day EMA.
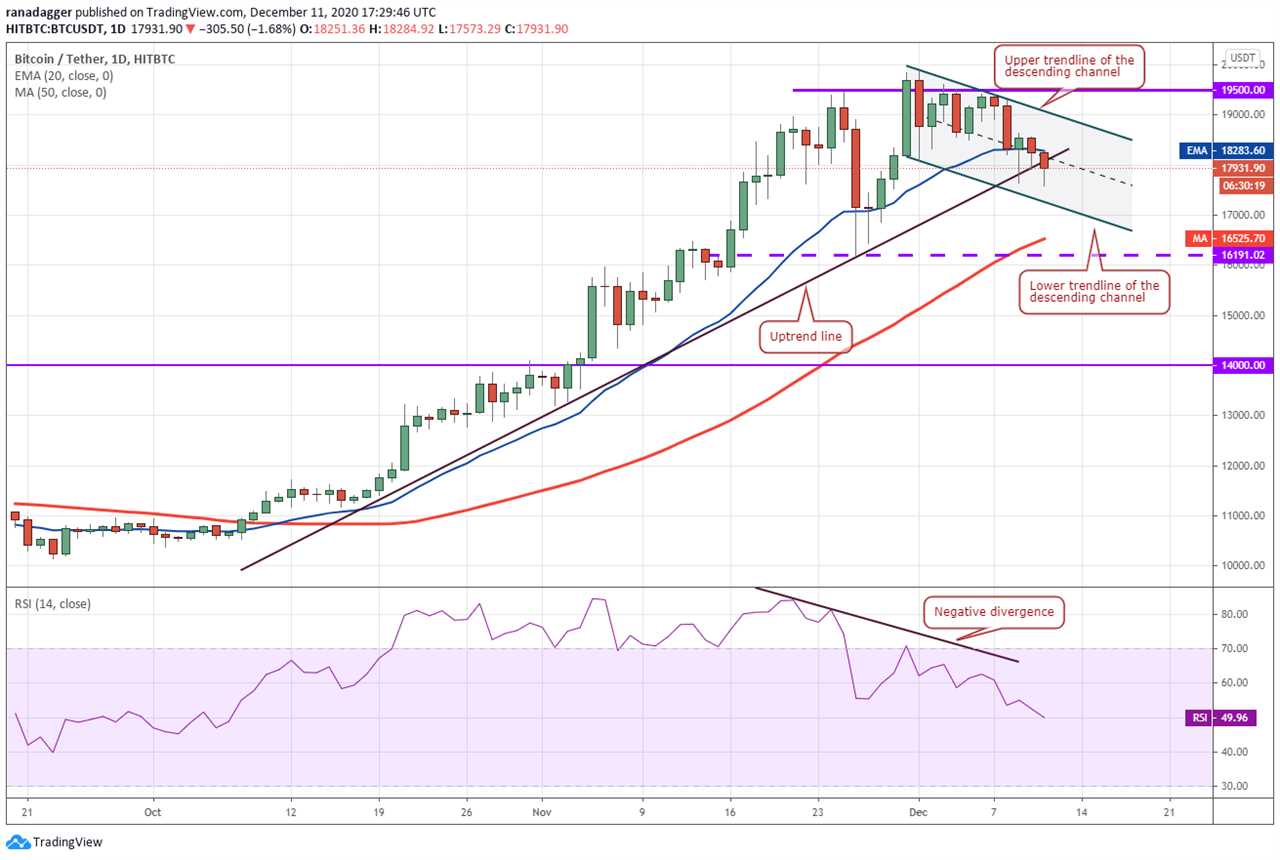
Today, the bulls are again buying on dips as seen from the long tail on the candlestick. This shows that lower levels continue to attract buyers. The 20-day EMA has flattened out and the relative strength index (RSI) is close to the midpoint, which suggests a short-term consolidation.
The BTC/USD pair is currently trading inside a descending channel. If the bears sink the price below the uptrend line, the next support is at the lower trendline of the descending channel. If this support also cracks, the decline could extend to the 50-day simple moving average at $16,525.
The bulls are likely to defend the $16,191.02 level aggressively. If the price rebounds off this support, it will indicate a possible consolidation in a large range. On the other hand, if the bulls can sustain the recovery and push the price back above the 20-day EMA, the pair could rise to the upper trend line of the channel.
A breakout of the channel could again result in a retest of the $19,500 to $20,000 overhead resistance zone.
ETH/USD
Ether (ETH) is currently trading inside a descending channel. The bulls could not build on the Dec. 9 rebound and the price turned down once again on Dec. 10. This shows that traders are selling on relief rallies.
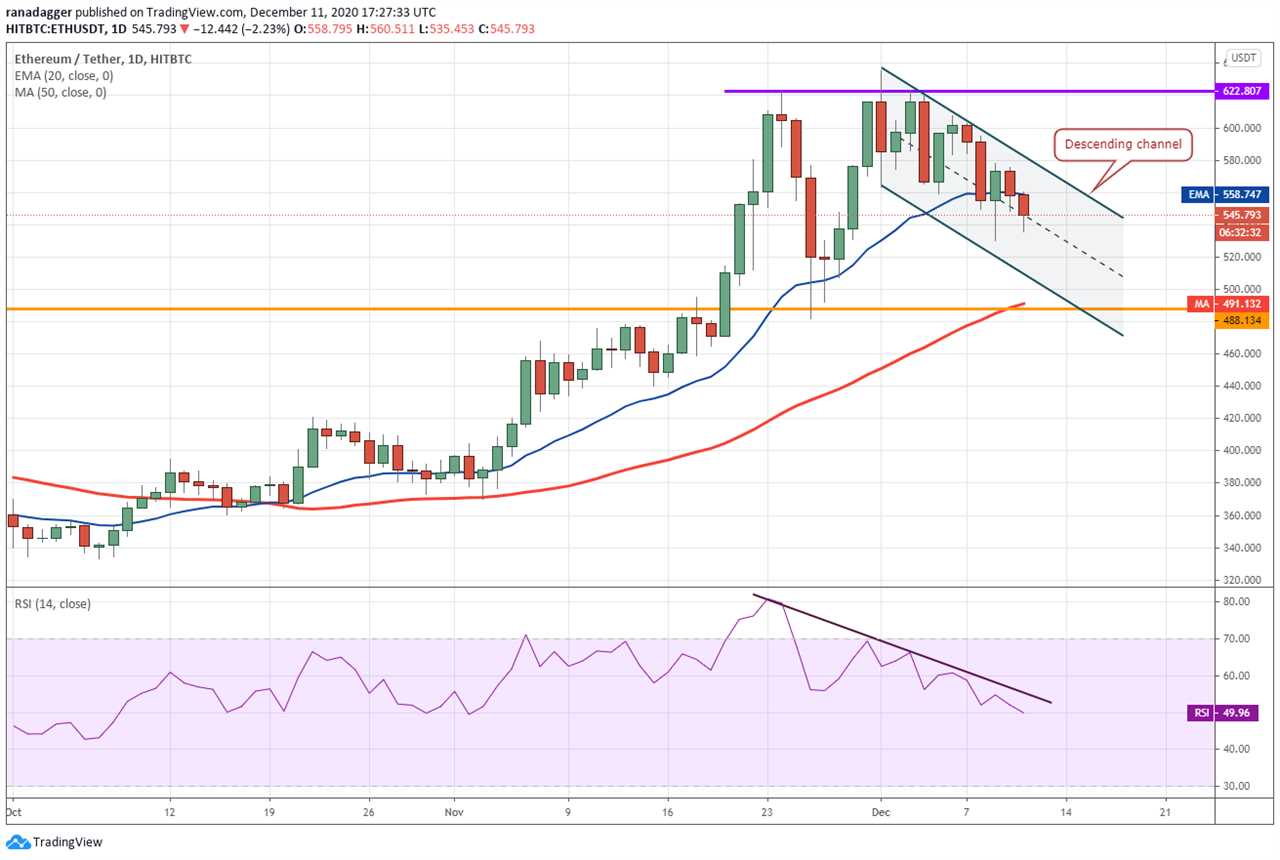
The bears are currently attempting to sustain the price below the 20-day EMA ($558). If they succeed, the ETH/USD pair could decline to the next major support at $488.134, just below the 50-day SMA at $491. The bulls are likely to defend this zone aggressively.
If the pair rebounds sharply from this zone, it will suggest a large trading range between $488.134 and $622.807.
Contrary to this assumption, if the price turns up from the current levels and breaks above the channel, then it will indicate that the correction could be over. The bulls will then try to push the price to the overhead resistance at $622.807.
Both possibilities have an equal likelihood of occurring because the flat 20-day EMA and the RSI near the midpoint suggest a balance between the bulls and the bears.
XRP/USD
XRP rebounded off the $0.50 support and closed above the 20-day EMA ($0.54) on Dec. 9. The price again turned down today but the bulls are attempting to defend the 20-day EMA.
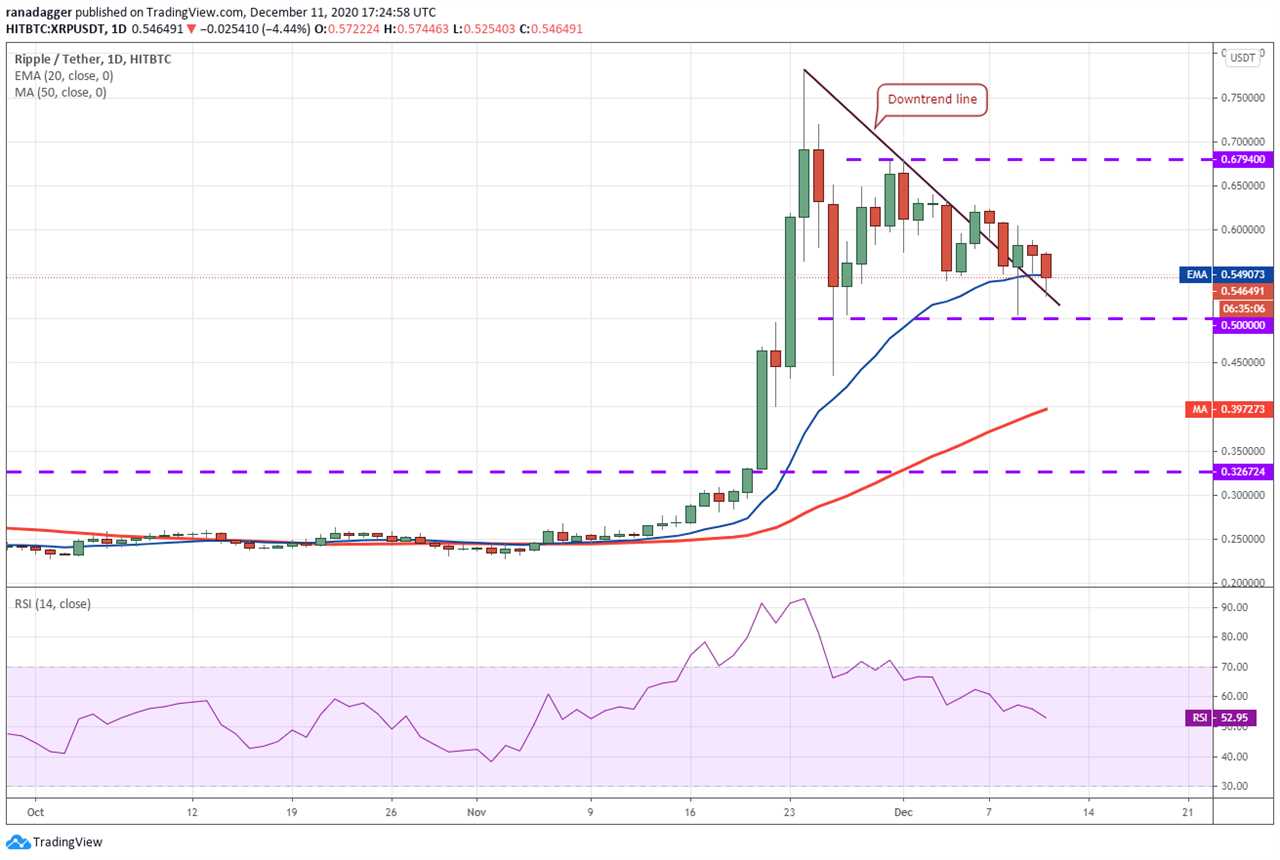
If the price sustains above the 20-day EMA, it will suggest that the bears are losing their grip. The flat 20-day EMA and the RSI above 52 suggest a balance between supply and demand.
If the bulls push the price above $0.60, the XRP/USD pair could remain range-bound between $0.50 and $0.679 for a few days.
This view will be invalidated if the bears sink the price below $0.50. If that happens, the pair could drop to the 50-day SMA at $0.39.
LTC/USD
Litecoin’s (LTC) rebound on Dec. 9 only lasted for a day and the price again turned down on Dec. 10. This shows that bears are selling on every minor rally.
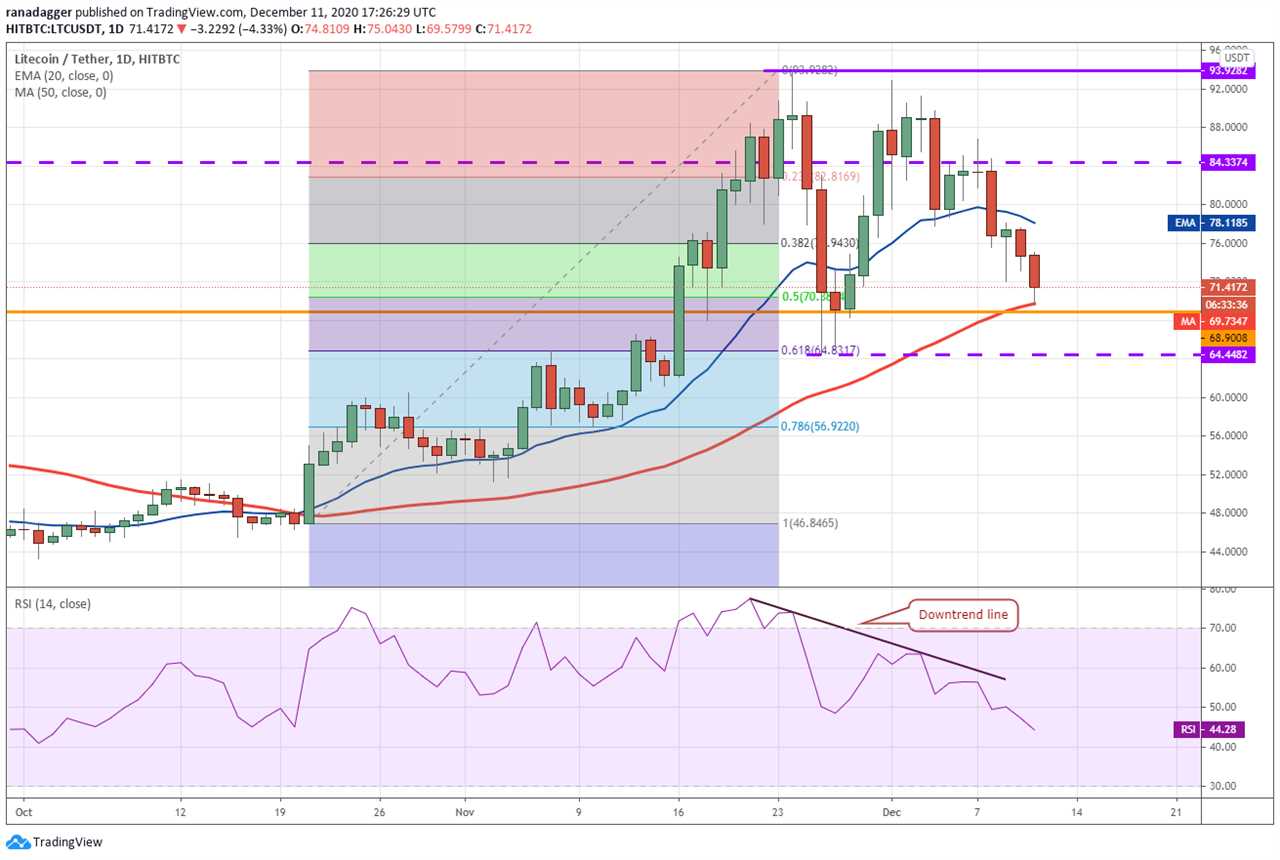
The bulls are currently attempting to defend the 50-day SMA ($69.73), which is just above the $68.9008 horizontal support. If the price rebounds off this support and rises above the 20-day EMA ($78), the LTC/USD pair could consolidate in a large range for a few days.
On the other contrary, if the rebound again turns down from the 20-day EMA, the pair may decline to the $64.4482 support. The downsloping 20-day EMA and the RSI below 45 suggest bears have the upper hand.
BCH/USD
The moving averages act as support in an uptrend but behave as resistance when the sentiment turns bearish. Bitcoin Cash (BCH) attempted a recovery on Dec. 9 but could not rise above the 50-day SMA ($271).
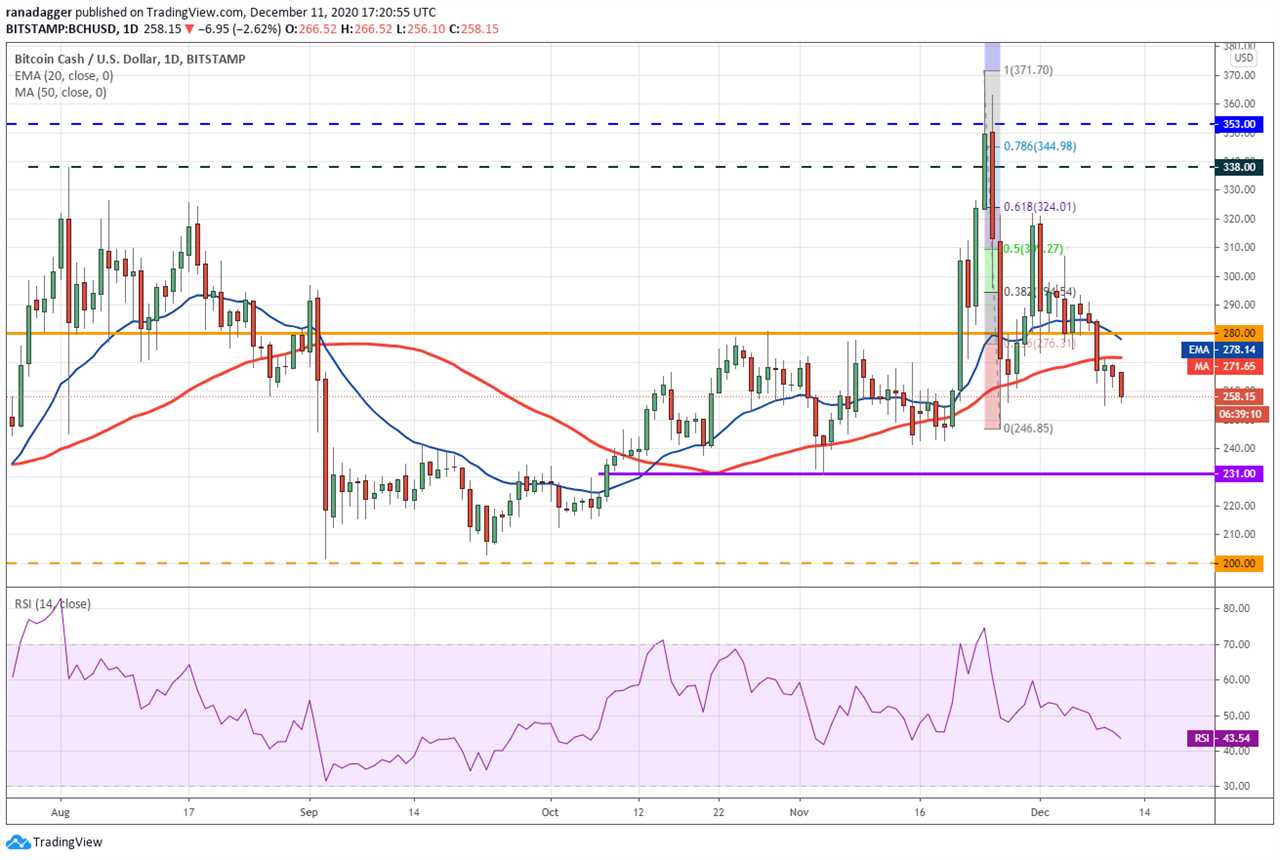
This shows that traders sold on pullback to the 50-day SMA and the price has resumed its down move today. There is minor support in the $254.82 to $246.85 zone. A break below this zone could sink the price to $231.
If the price rebounds off this support, the BCH/USD pair could remain range-bound between $231 and $280 for a few days. But if the $231 support cracks, the pair may plummet to $200.
The downsloping 20-day EMA ($278) and the RSI in the negative zone suggest advantage to the bears. This bearish view will be invalidated if the price breaks and sustains above the $280 resistance.
LINK/USD
Chainlink’s (LINK) bounce off the uptrend line turned down from the 50-day SMA ($12.69) on Dec. 10. The failure to rise above the downtrend line has attracted further selling that has pulled the price below the uptrend line.
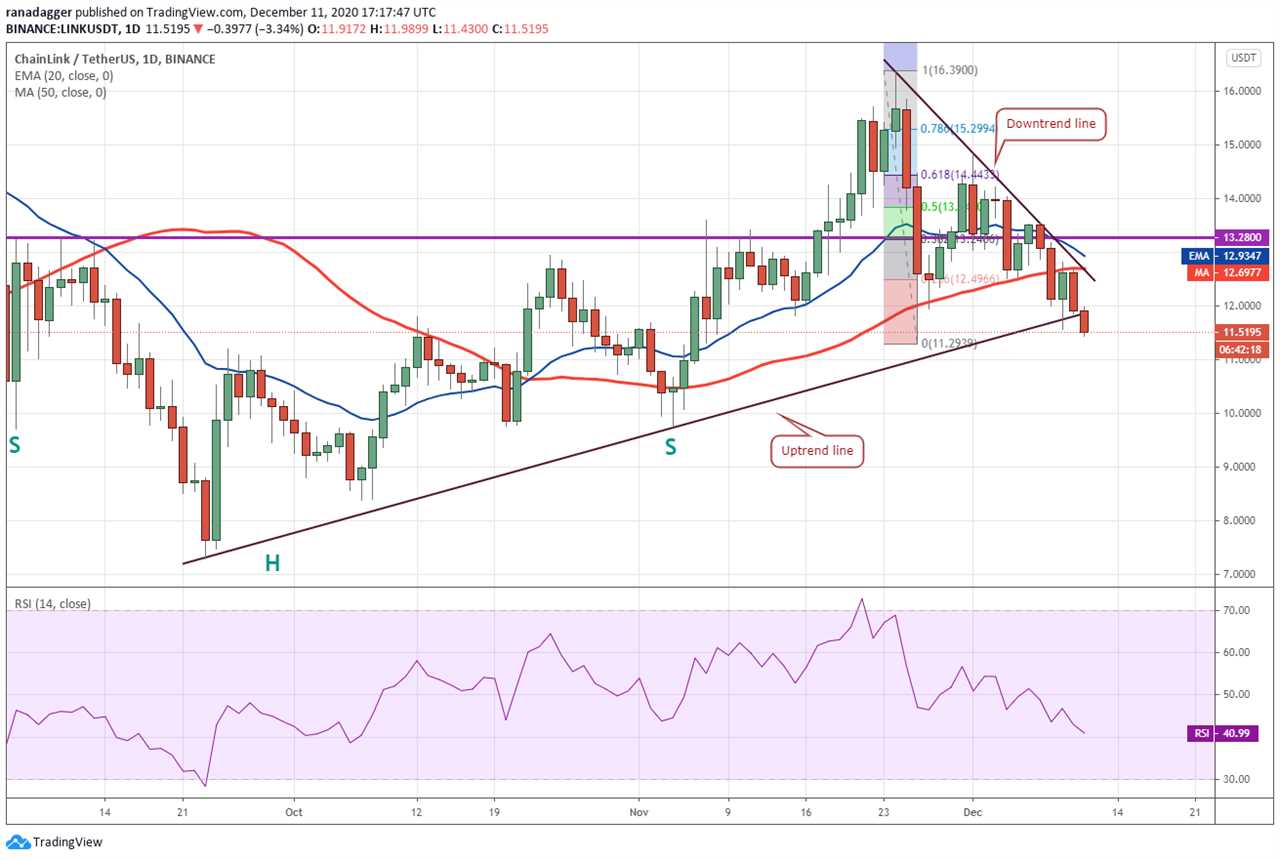
The moving averages are on the verge of a bearish crossover and the RSI has dipped below 41, which suggests that bears are in control. If the LINK/USD pair closes below the uptrend line, the drop could extend to $9.75.
This negative view will be invalidated if the price turns around and breaks above the moving averages. Such a move will suggest strong buying at lower levels.
ADA/USD
The bulls could not build up on the sharp rebound in Cardano (ADA) on Dec. 9. This shows that the sentiment has turned negative and the traders are now selling on rallies to the 20-day EMA ($0.145).
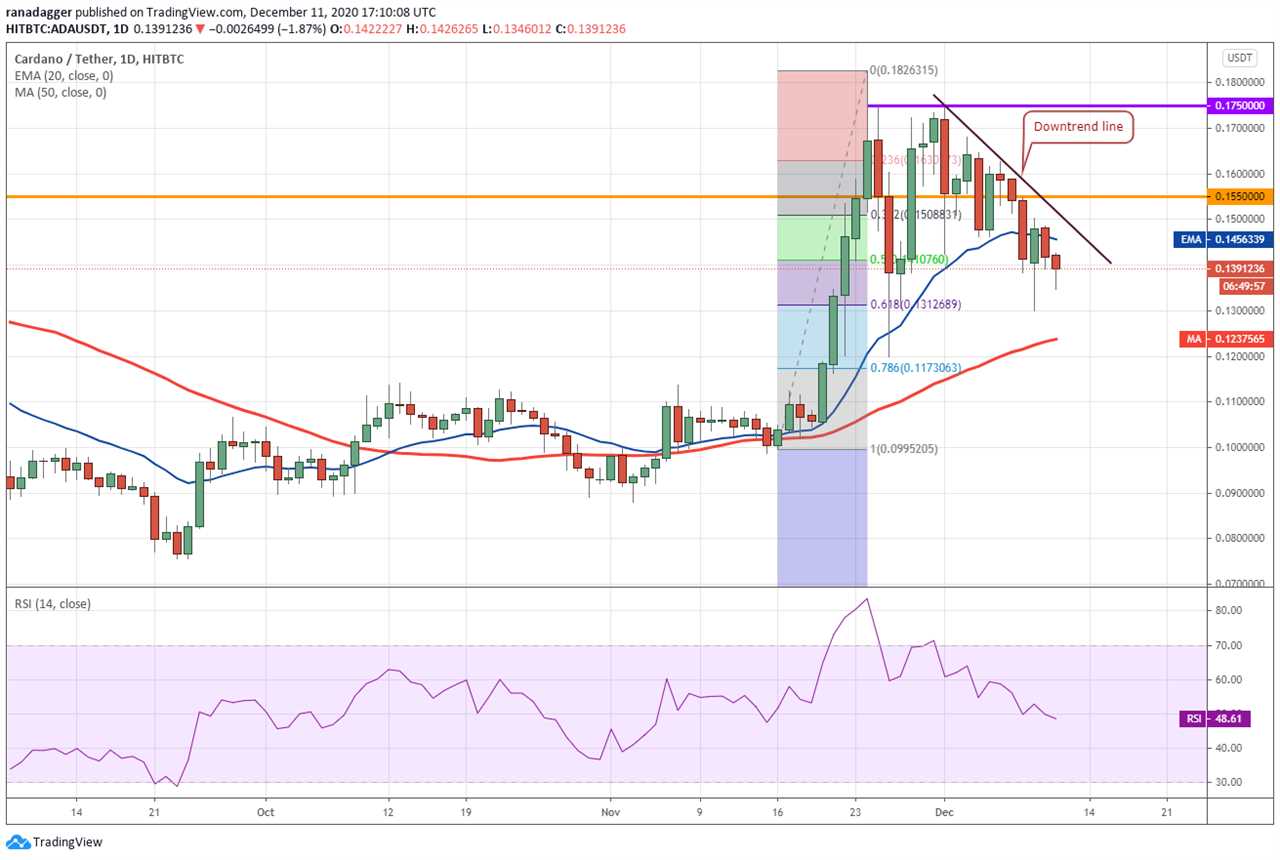
The ADA/USD pair has a strong support at $0.13. If the price rebounds off this level and rises above the downtrend line, it will suggest that the short-term correction could be over. The next move on the upside could be to $0.155.
Both moving averages are flattening out and the RSI just is below the midpoint, which suggests a few days of range-bound action.
This view will be invalidated if the bears sink the price below the $0.13 support and the 50-day SMA ($0.123). If that happens, the pair may slide to $0.117 and then to the $1 support.
DOT/USD
Polkadot (DOT) rebounded off the 50-day SMA ($4.73) on Dec. 9 but the bulls could not even extend the recovery to the 20-day EMA ($4.97). This shows that traders are selling on every minor rally.
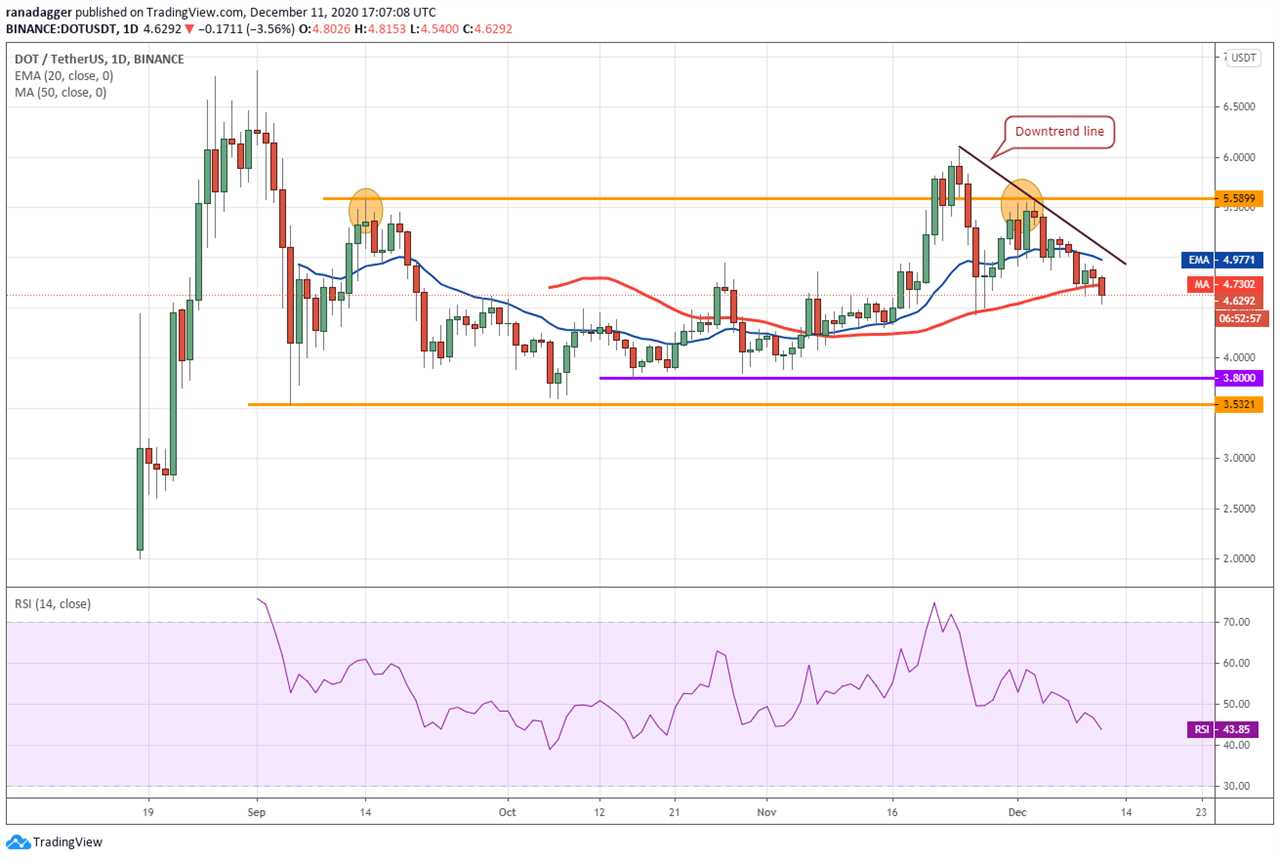
The price turned down on Dec. 10 and has broken the 50-day SMA today. There is a minor support at $4.4342 but if the bulls fail to hold this level, the DOT/USD pair could drop to the $3.80 to $3.5321 support zone.
The falling 20-day EMA and the RSI in the negative territory suggest that bears have the upper hand. This negative view will be invalidated if the pair turns around from the current levels and breaks above the downtrend line.
BNB/USD
The recovery attempt on Dec. 9 fizzled out at $28.3853 and Binance Coin (BNB) has again resumed its journey towards the critical support at $25.6652. This level could attract buyers as it has held twice before.
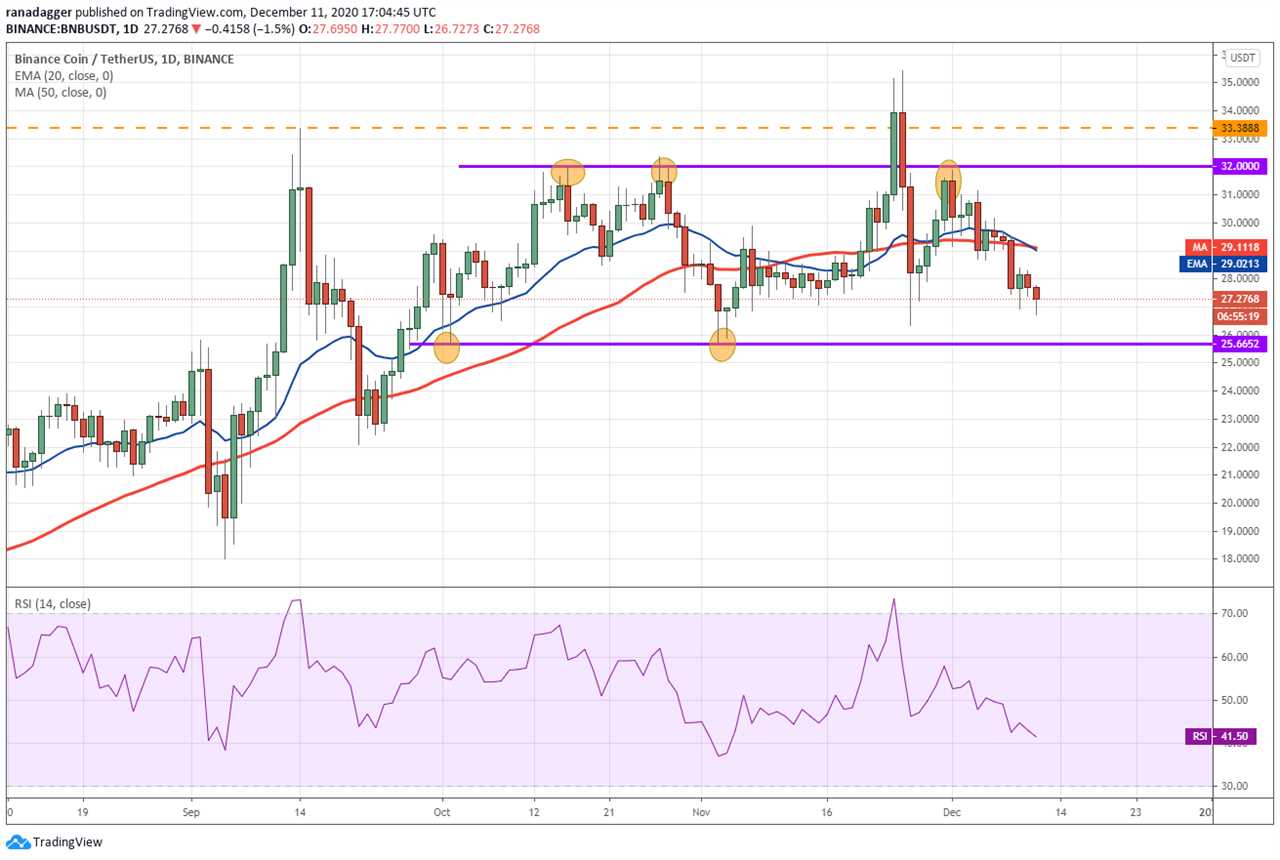
A strong rebound off the critical support could keep the BNB/USD pair range-bound between $25.6652 and $32 for a few more days.
On the other hand, if the bears sink and sustain the price below $25.6652, the pair could drop to $22 and then to $18. The gradually downsloping 20-day EMA ($29) and the RSI below 41 suggest that bears have the upper hand at the moment.
XLM/USD
Stellar Lumens (XLM) rebounded sharply on Dec. 9 and recovered to the downtrend line but the bulls could not push the price above the $0.18 resistance. This again attracted selling and the price has dipped below the 20-day EMA ($0.159).
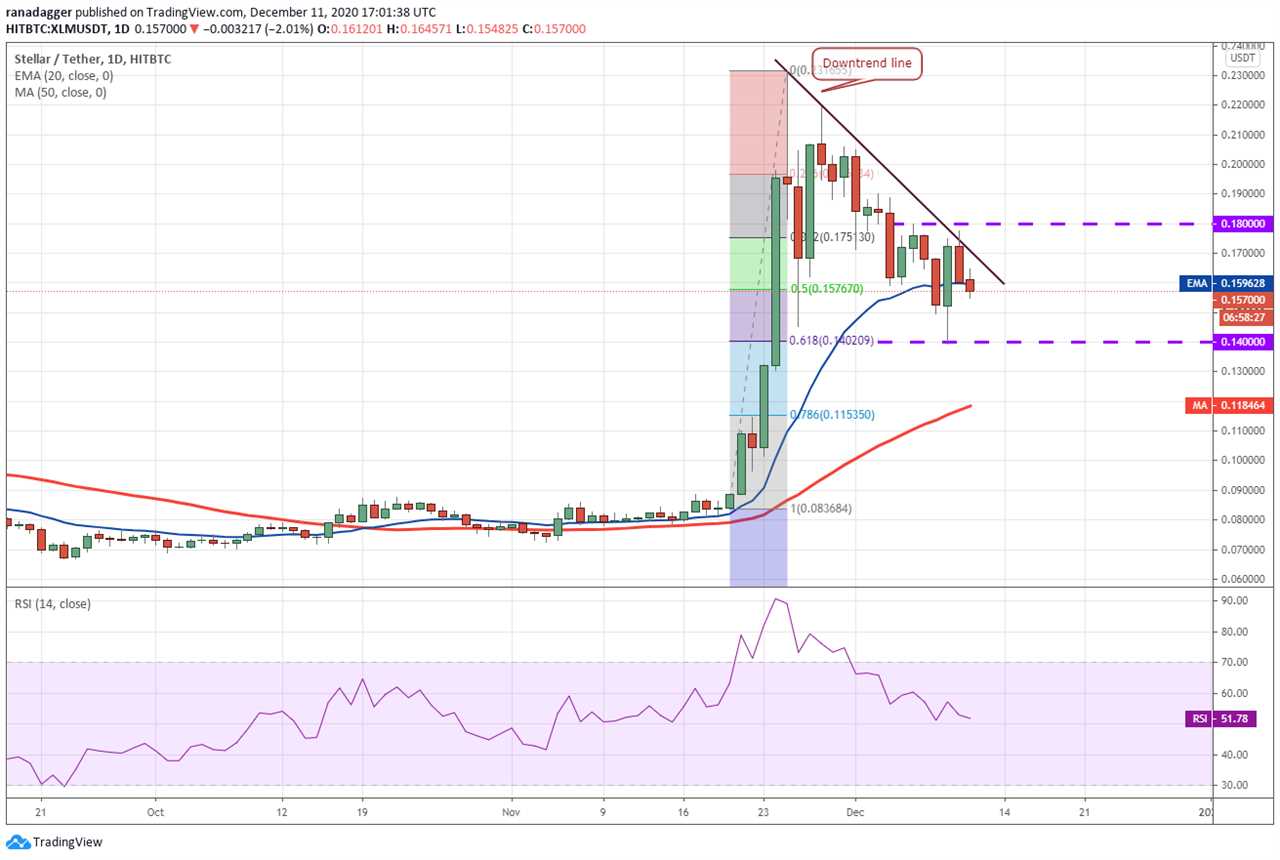
The flat 20-day EMA and the RSI close to the midpoint suggest a few days of range-bound action between $0.14 and $0.18. A break above $0.18 will signal advantage to the bulls and could result in a move to $0.21.
Conversely, if the XLM/USD pair breaks below $0.14, the selling may intensify and the decline could extend to the 50-day SMA ($0.118).
Market data is provided by HitBTC exchange.
Title: Price analysis 12/11: BTC, ETH, XRP, LTC, BCH, LINK, ADA, DOT, BNB, XLM
Sourced From: cointelegraph.com/news/price-analysis-12-11-btc-eth-xrp-ltc-bch-link-ada-dot-bnb-xlm
Published Date: Fri, 11 Dec 2020 18:59:44 +0000


