
Bitcoin’s (BTC) current rally has largely been led by investments from institutional investors and public listed companies. Data from Bitcointreasuries shows that companies hold about 4.54% of the current Bitcoin supply.
A survey of 700 high-net-worth individuals chosen from across the globe shows that about 73% of respondents either own or want to own cryptocurrencies before the end of 2022. The proposed influx of money from large investors could boost demand and drive crypto prices higher.
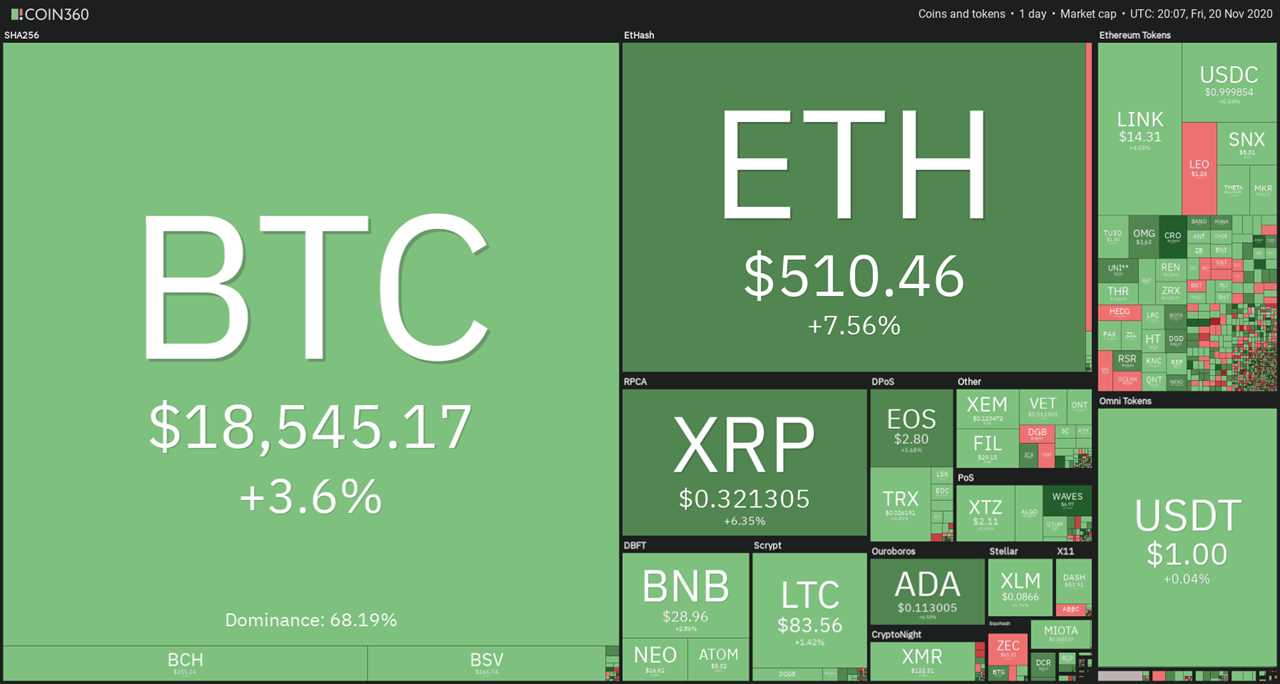
Bloomberg Intelligence strategist Mike McGlone believes that if history repeats itself, Bitcoin could rally to $170,000 over the next two years. McGlone pointed out that Bitcoin’s volatility versus gold was the lowest on record and while volatility in risky assets across the globe has been increasing, Bitcoin’s volatility has been in decline. However, in the short term, McGlone expects Bitcoin to consolidate before zooming higher.
In an interview with Cointelegraph, Nugget’s News CEO Alex Saunders said that Bitcoin’s price could rally to “$100,000 in the next five years” and if it becomes the global reserve currency, then it could reach $1 million by 2035.
When markets are bullish, it is easy to get sucked into the rally due to greed. However, every bull phase witnesses periodic corrections, hence, traders should be careful and protect their paper profits with a suitable stop loss.
Let’s analyze the top-10 cryptocurrencies to spot the critical resistance and support levels to watch over the coming days.
BTC/USD
Bitcoin’s (BTC) correction from $18,466.14 was short-lived as the bulls defended the $17,200 support and have currently pushed the price to a new 52-week high. This suggests that the uptrend is strong and the bulls are firmly in control.
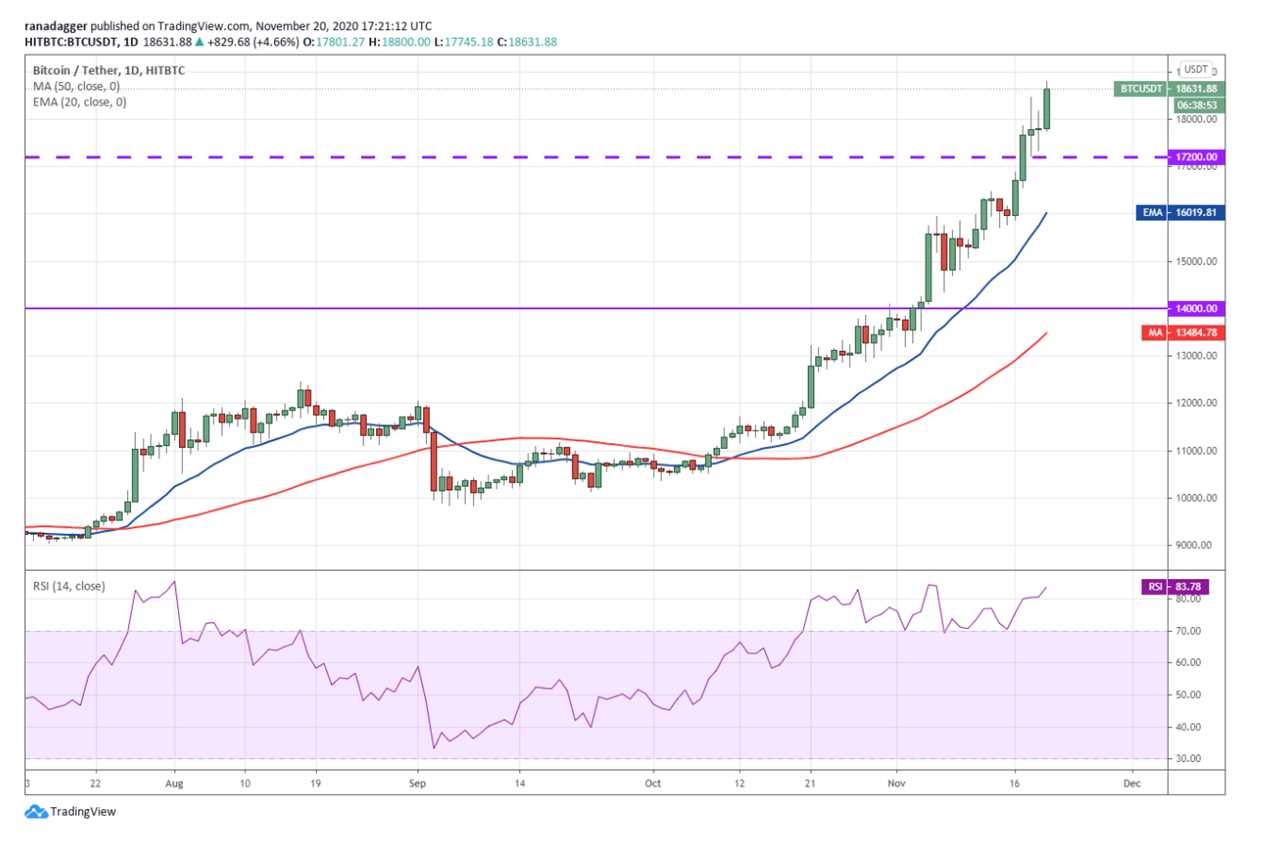
The next resistance on the upside is the all-time high at $19,531.90 and then the psychological level at $20,000. If the bulls can propel the price above $20,000 in the current leg of the uptrend, the momentum could further pick up and make a blow-off top.
Usually, vertical rallies are followed by waterfall declines. The first support in an uptrend is the 20-day exponential moving average ($16,019) but if this support cracks, the correction could reach $14,000.
The relative strength index (RSI) has risen deep into overbought territory, suggesting a pullback may occur anytime.
However, when the momentum is strong, the price can stay overbought for an extended period, hence, investors should not try to call a top but protect their position with a suitable trailing stop-loss according to their trading strategy.
ETH/USD
As Bitcoin rallied to a mulit-year high, Ether (ETH) broke out of the $488.134 resistance and cleared the psychological level at $500 for the first time since July 2018. This shows aggressive buying at higher levels.
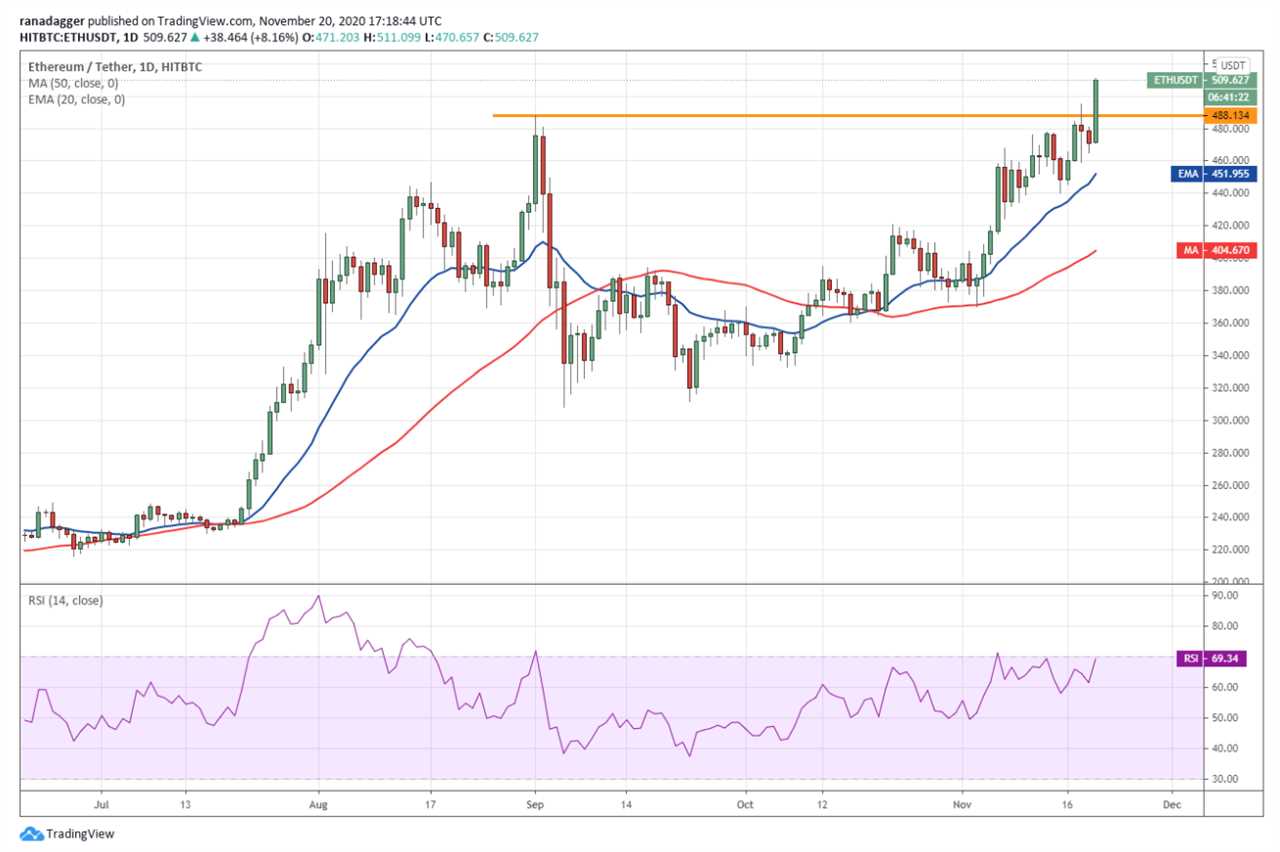
The upsloping moving averages and the RSI close to the overbought territory suggest that bulls are in control. If the bulls can flip $488.134 to support during the next pullback, the ETH/USD pair may start its journey to $550 and then to $625.
Contrary to this assumption, if the bears can pull the price below $488.134 during the next correction, it will indicate profit booking at higher levels. A break below the 20-day EMA ($451) may suggest that the short-term bullish momentum has ended.
XRP/USD
The long tails on the Nov. 18 and 19 candlesticks suggest that bulls are buying on dips. So far they have managed to push XRP above the $0.303746 resistance and next they will try to drive the price above the overhead resistance at $0.326113.
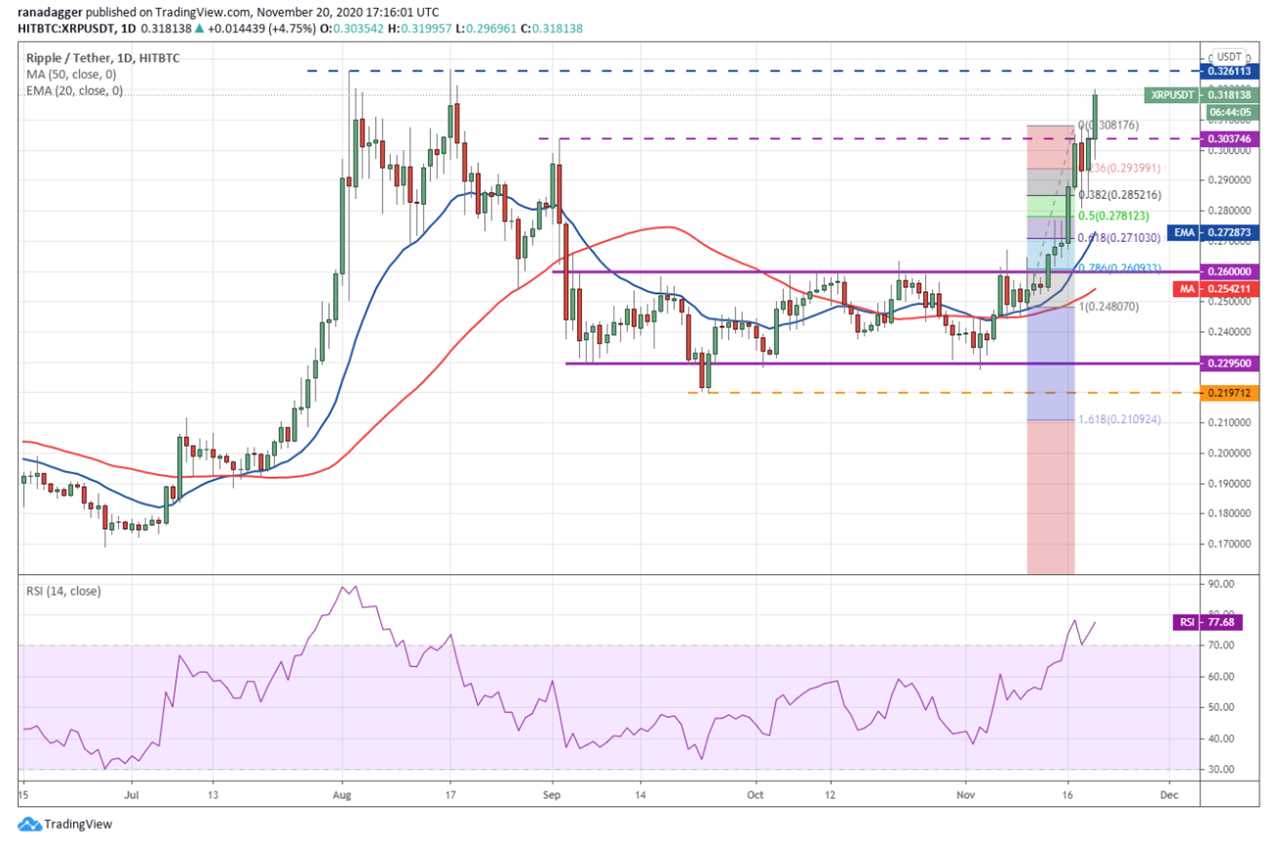
If they succeed, the XRP/USD pair could rally to $0.40. The upsloping moving averages and the RSI in the overbought zone suggest that the path of least resistance is to the upside.
Contrary to this assumption, if the bears defend the overhead resistance, the pair may consolidate between $0.303746 and $0.326113 for a few days.
A break below the $0.303746 support could suggest a lack of buyers at higher levels. The bears will then try to sink the pair below the 20-day EMA ($0.272) and gain the upper hand.
LINK/USD
Chainlink (LINK) broke out and closed above the $13.28 resistance on Nov. 18, which completed a bullish inverse head and shoulders setup. This new uptrend has a pattern target of $19.2731.
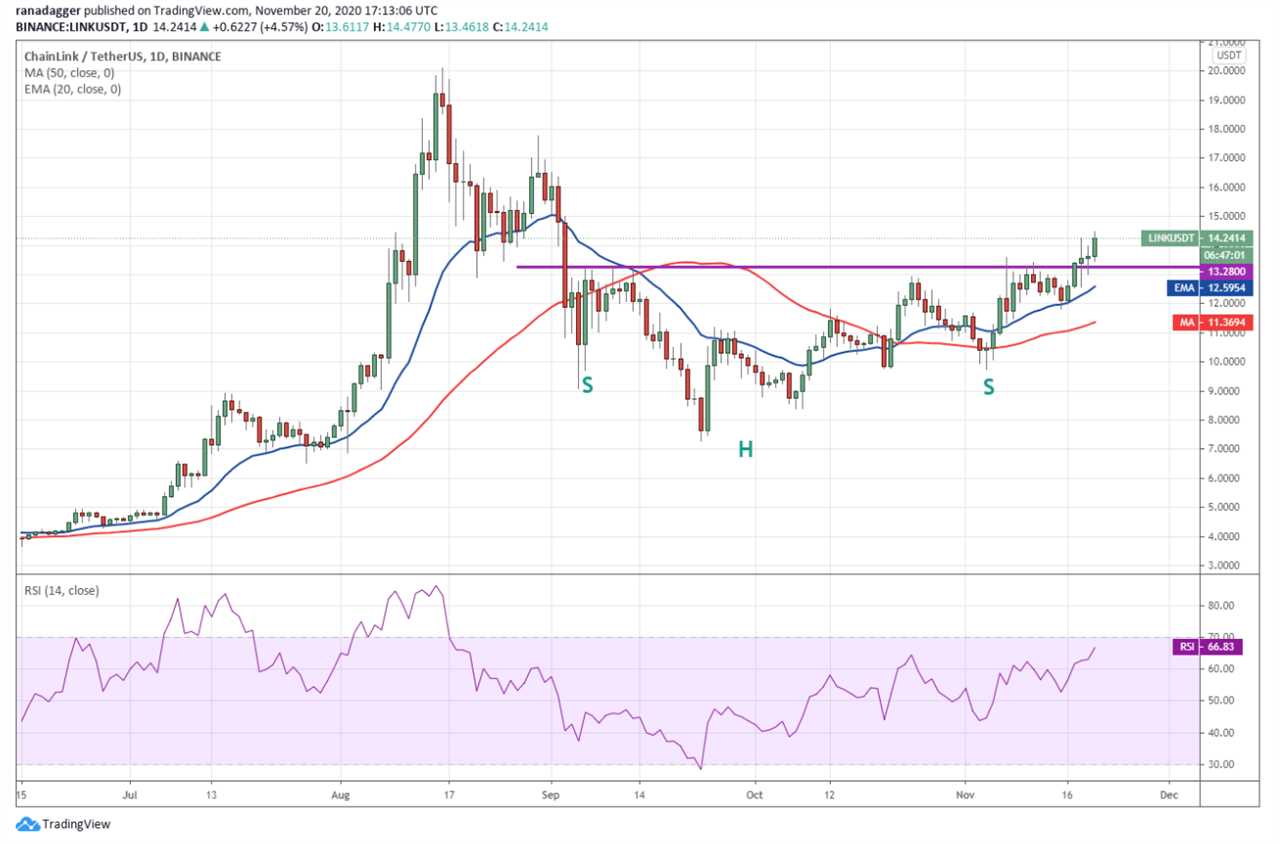
However, the bears will try to stall the up-move close to $16 and pull the price back below the breakout level of $13.28. If they can sink the price below $11.80, it will suggest that the current breakout was a bull trap.
In an uptrend, the sentiment is to buy the dips. The rising moving averages and the RSI above 66 suggest that the bulls are in command. Hence, they are likely to buy the dip to the breakout level of $13.28 and flip it to support. If that happens, the uptrend could resume.
LTC/USD
Litecoin (LTC) has hit a new 52-week high today, above the overhead resistance at $84.3374. The strong rebound off the $68.9008 support on Nov. 18 shows that the bulls aggressively purchased the dip to the breakout level.
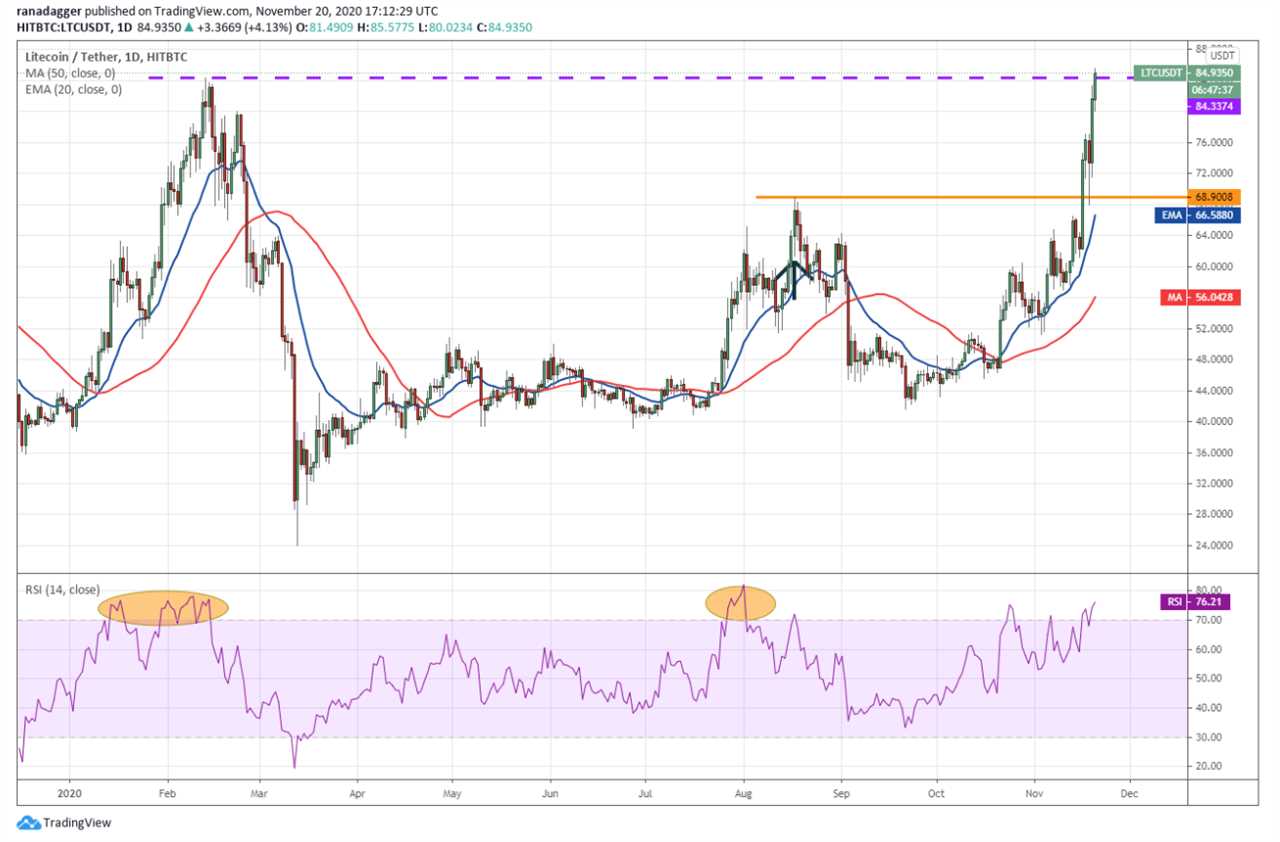
Both moving averages are sloping up and the RSI has risen into the overbought zone, indicating that the bulls are in control. If the price sustains above $85, the rally may extend to $100. This level may act as a hurdle but if crossed, the rally could reach $140.
However, during the previous two instances, a reading of close to 80 on the RSI resulted in a correction. Hence, traders should look out for the possibility of a minor correction in the next few days.
The trend in the LTC/USD pair could turn negative if the bears pull the price back below the breakout level of $68.9008.
BCH/USD
Bitcoin Cash (BCH) held the $242 support for the past two days, which shows that bulls are buying at lower levels. If the buyers can push the price above $260, the altcoin may start its journey to the $272 and $280 resistance zone.
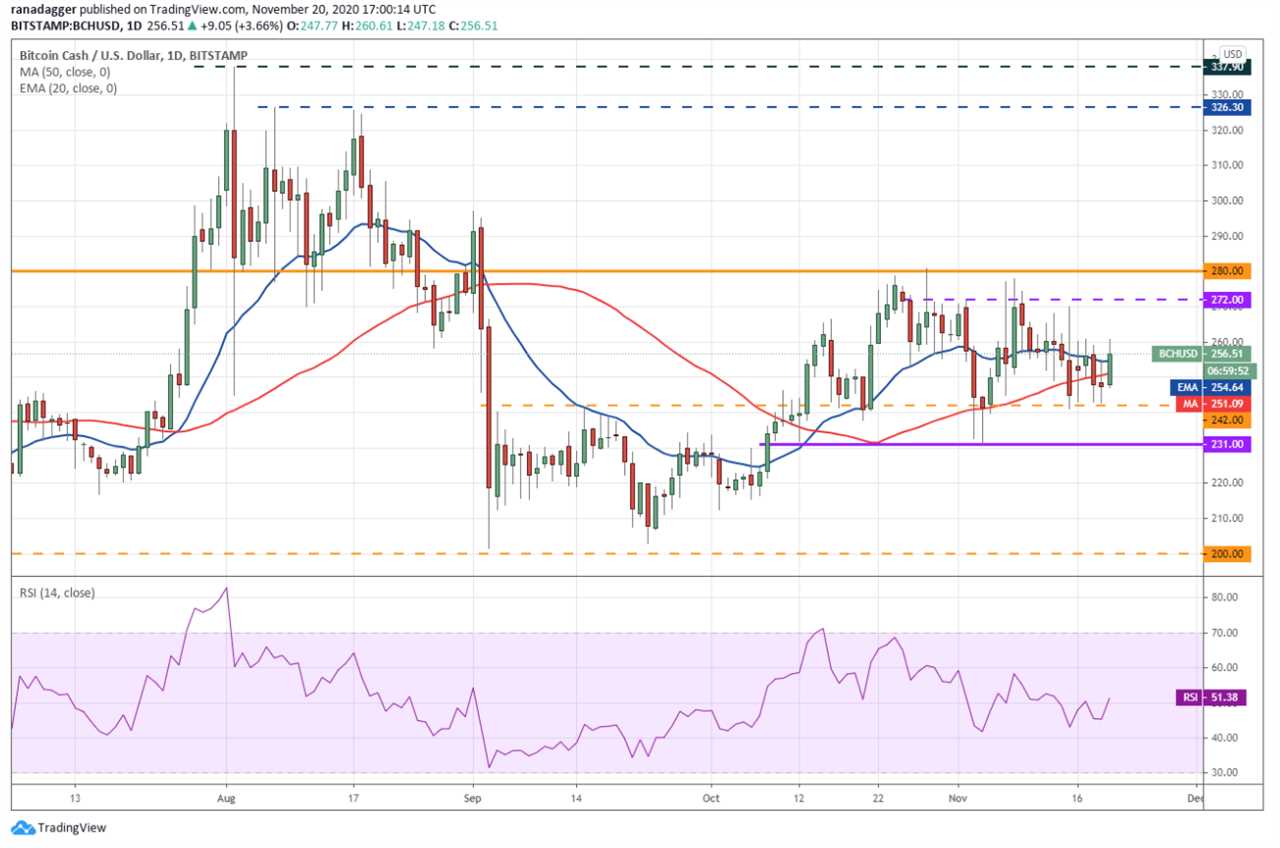
The overhead zone may act as a stiff hurdle but if the bulls can push the price above it, the BCH/USD pair could rally to $326.30 and then to $337.90.
However, the flat 20-day EMA ($254) and the RSI near the midpoint suggest that the range-bound action between $242 and $272 may continue for a few more days.
The advantage will shift in favor of the bears if the pair turns down from the current levels and slips below the $231 support.
DOT/USD
Polkadot (DOT) took support at the 20-day EMA ($4.54) for the past two days and has broken above the overhead resistance at $4.95 today. The upsloping 20-day EMA and the RSI in the overbought zone suggest that bulls are in command.
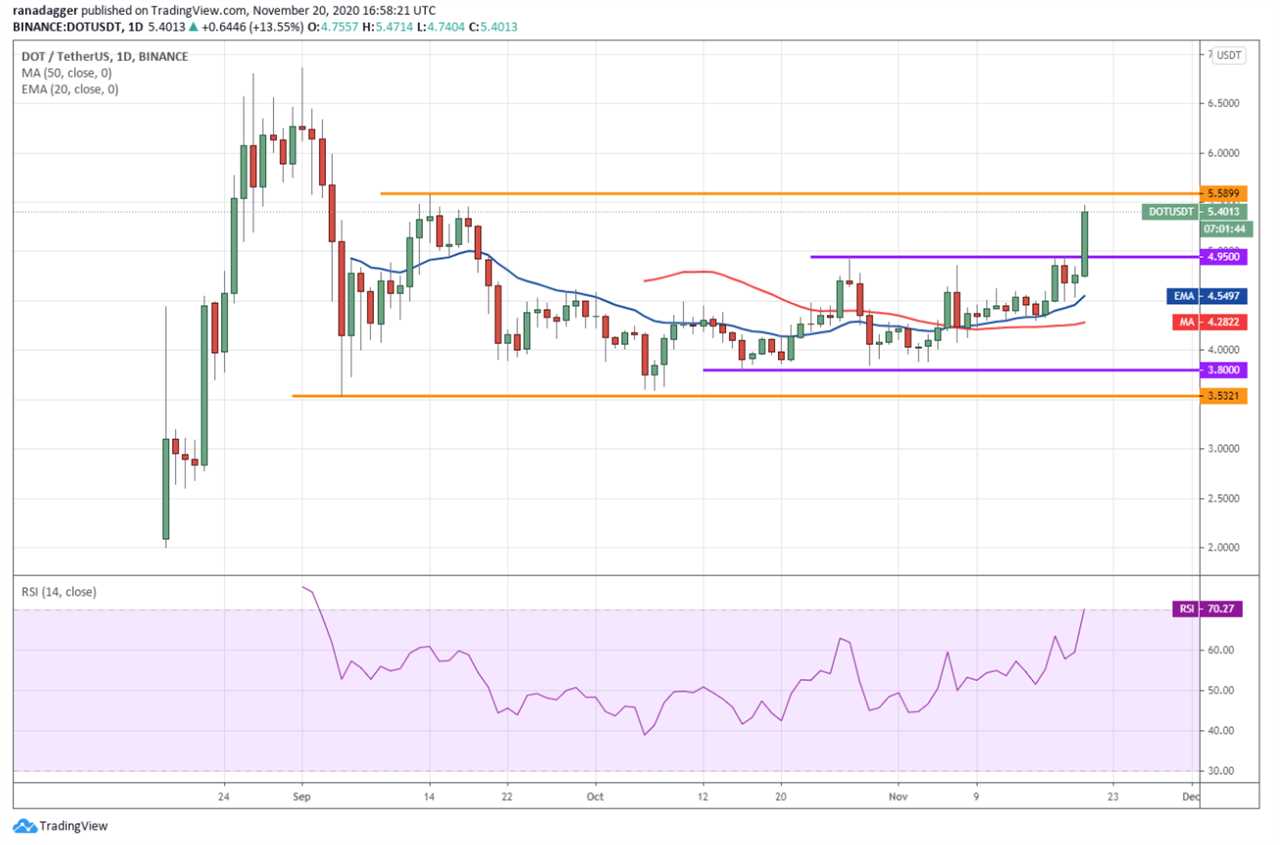
If the buyers can propel the price above $5.5899, the DOT/USD pair may rally to $6.25 and then to the highs at $6.8619.
However, the bears are unlikely to throw in the towel easily. They will try to stall the current rally at $5.5899. If they manage to do that, the pair could consolidate between $4.95 and $5.5899 for a few days.
This bullish view will be invalidated if the bears drag the price back below the breakout level of $4.95 and the 20-day EMA.
BNB/USD
Binance Coin (BNB) has broken out of the $27.30 to $28.97 range it had been stuck in for the past few days but the bulls are struggling to sustain the higher levels. This suggests that bears are attempting to keep the price inside the range.
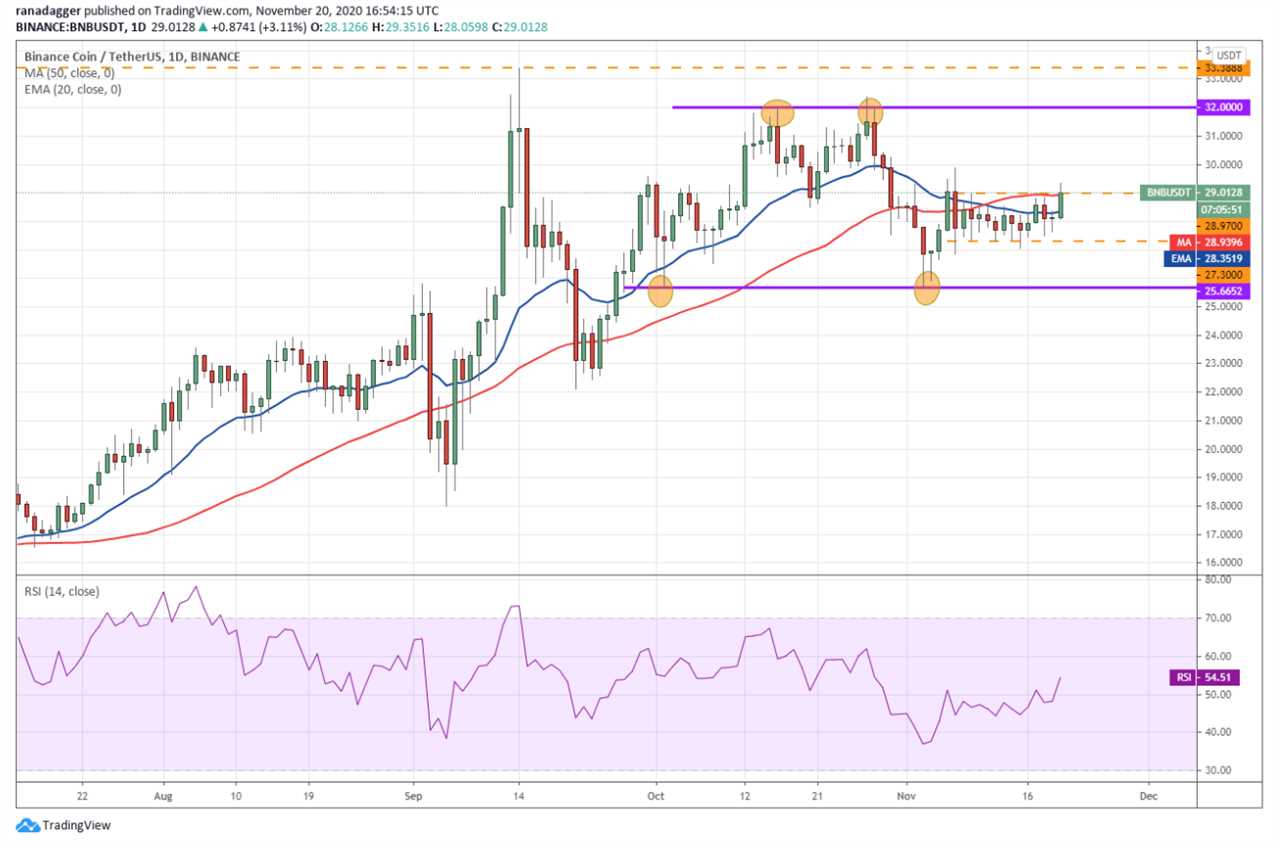
However, if the bulls can sustain the breakout, a new up-move to the $32 to $33.3888 zone is possible. If the price turns down from this zone, the BNB/USD pair may extend its stay inside a large range.
On the other hand, if the bulls can thrust the price above the resistance zone, the pair could retest the all-time highs at $39.5941.
This positive view will be invalidated if the bulls fail to sustain the current breakout. In that case, the bears will try to pull the price below the $27.30 support and if they succeed, the pair could drop to $25.6652.
ADA/USD
The bulls did now allow Cardano (ADA) to slip below the moving averages and the downtrend line in the past two days. This is a positive sign as it shows buying at lower levels. The altcoin has resumed its journey to the top of the range at $0.114241.
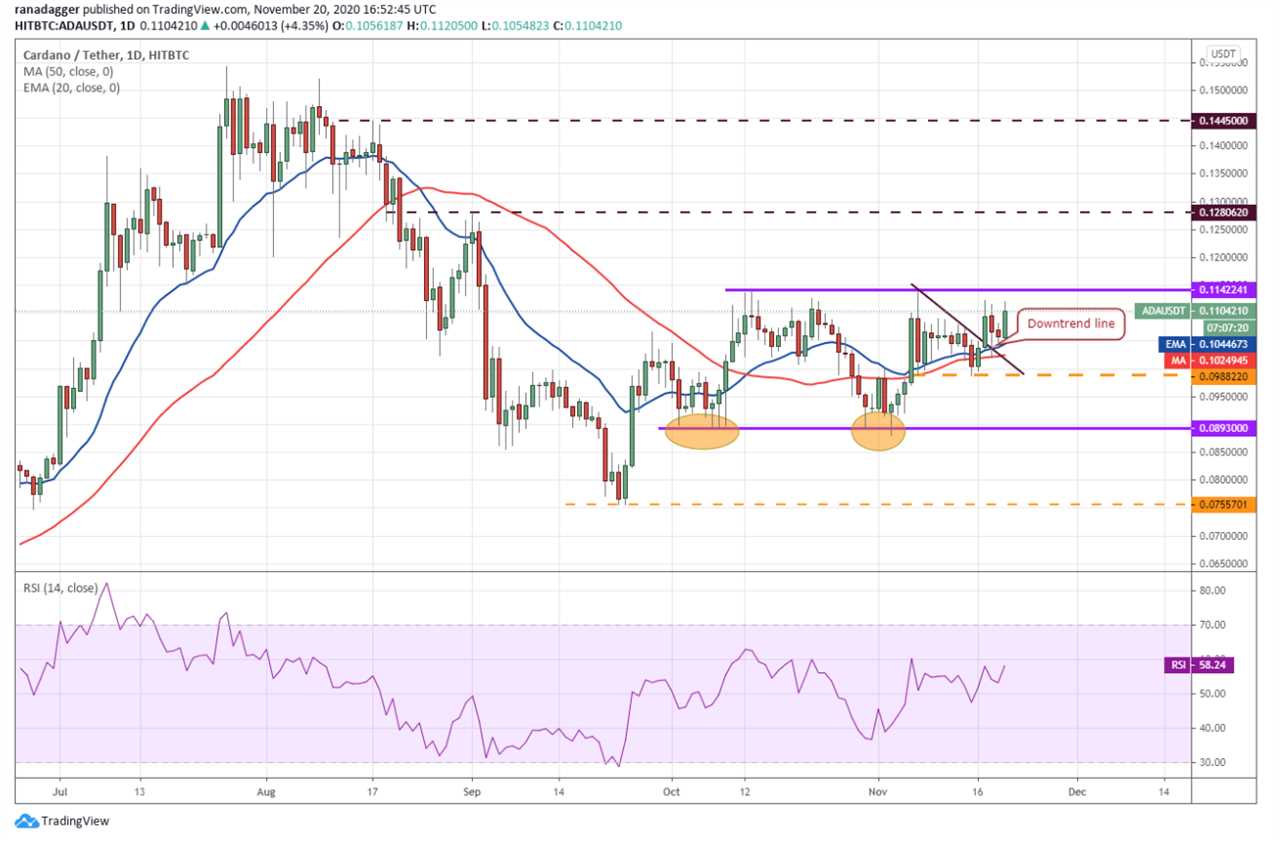
If the bulls can drive the price above $0.1142241, the ADA/USD pair could start a new uptrend that can rally to $0.1280 and then to $0.1445.
The upsloping moving averages and the RSI in the positive zone suggest that bulls have the upper hand. Traders can watch the RSI because a break above 60 could suggest that the rally may pick up momentum.
However, if the pair once again turns down from the overhead resistance, the range-bound action could continue for a few more days.
BSV/USD
The bears could not sustain Bitcoin SV (BSV) below the downtrend line for the past two days. This shows that the bulls are accumulating at lower levels and they have pushed the price back above the moving averages today.
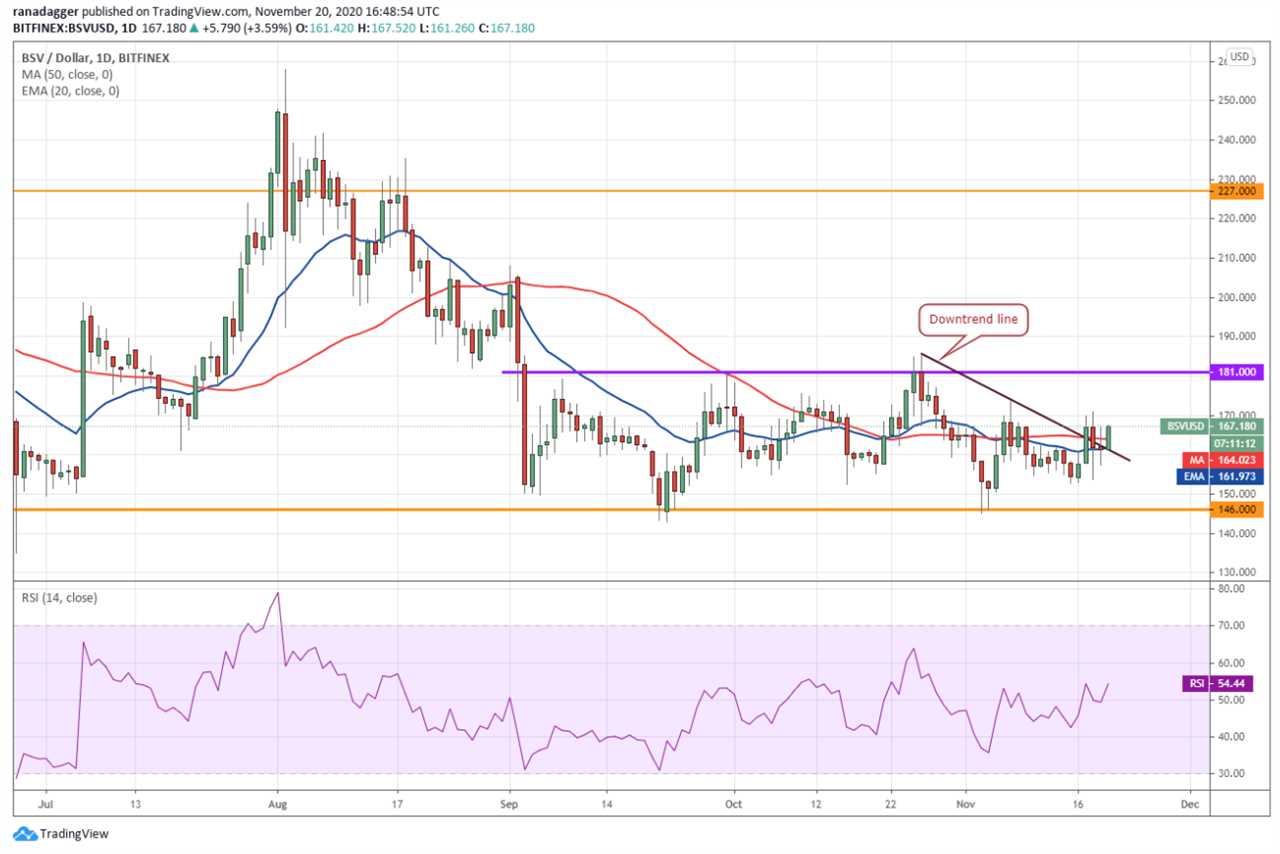
The BSV/USD pair could now move up to $181. If the bears defend this resistance aggressively, the pair may extend its stay inside the range for a few more days. The flat moving averages and the RSI close to 54 suggest a balance between supply and demand.
However, if the bulls can drive the price above $181, the pair could start a new uptrend that has a target objective of $216. This positive view will be invalidated if the price turns down and plummets below the moving averages.
Market data is provided by HitBTC exchange.
Title: Price analysis 11/20: BTC, ETH, XRP, LINK, LTC, BCH, DOT, BNB, ADA, BSV
Sourced From: cointelegraph.com/news/price-analysis-11-20-btc-eth-xrp-link-ltc-bch-dot-bnb-ada-bsv
Published Date: Fri, 20 Nov 2020 20:25:47 +0000
Did you miss our previous article...
https://trendinginthenews.com/crypto-currency/singapore-ready-to-launch-wholesale-cbdc-local-exec-says


