Bitcoin remains steady while altcoins show signs of recovery
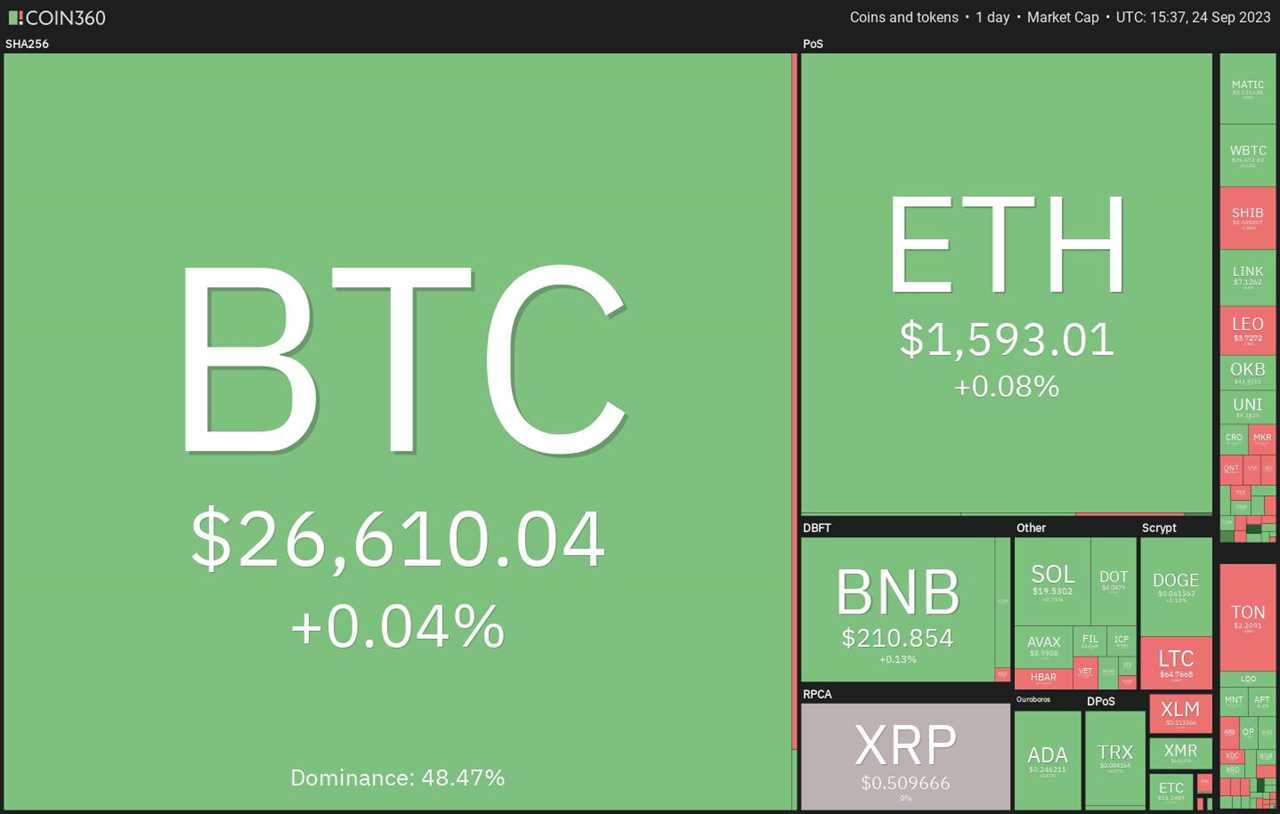
Bitcoin (BTC) has stayed in a narrow trading range for the past three days, indicating that cryptocurrency traders are not panicking and rushing to exit. This is a positive sign for the market. Meanwhile, several altcoins are showing signs of a potential recovery in the near term.
Could Bitcoin's slumber spark an altcoin rally?
The uncertainty surrounding Bitcoin's next move may have kept traders cautious, leading to subdued price action in many large altcoins. However, there is a possibility that Bitcoin could see a bullish move in the near future, which could act as a catalyst for an altcoin rally. Let's take a look at the charts of the top altcoins that may lead this charge higher.
Bitcoin price analysis
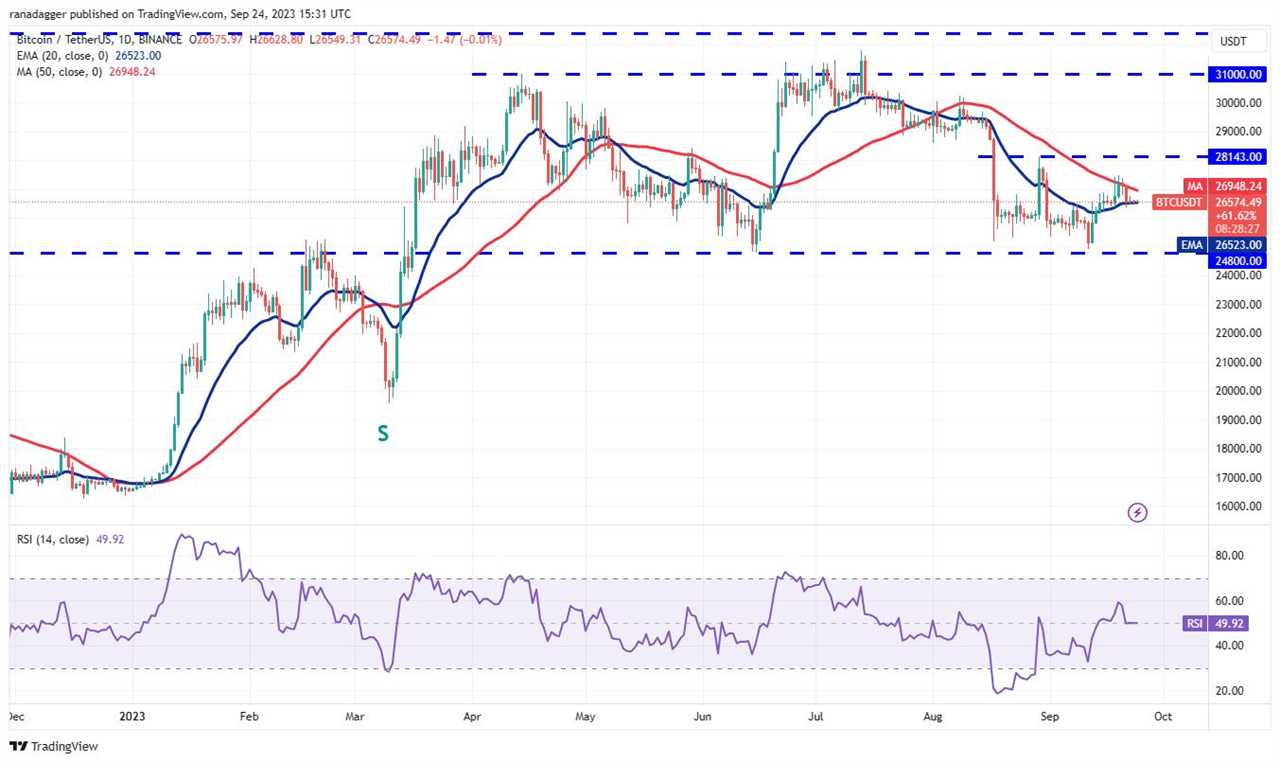
The price of Bitcoin has managed to stay above the 20-day exponential moving average ($26,523), but a strong rebound has yet to be seen. This suggests a lack of demand at higher levels. If the price falls below the 20-day EMA, it could signal an advantage for the bears. On the other hand, a rise above the 50-day simple moving average ($26,948) would suggest that buyers are regaining control.
Bitcoin has been trading below the moving averages on the 4-hour chart, but selling pressure seems to be drying up at lower levels. If buyers can push the price above the moving averages, Bitcoin could rally to $27,400 and then to $28,143. However, if bears gain control, they will need to sink the price below $26,200 to pave the way for further declines.

Chainlink price analysis
Chainlink (LINK) recently broke above a downtrend line, indicating a potential trend change. The moving averages have also made a bullish crossover, and the RSI is in positive territory, suggesting that buyers are in control. If the price corrects, the bulls are likely to buy the dips near the 20-day EMA ($6.55). A strong rebound from this level could pave the way for an up-move towards $8 and eventually $8.50.
Maker price analysis
Maker (MKR) faced resistance at $1,370, suggesting that bears are trying to defend this level. The 20-day EMA ($1,226) is a crucial support to watch, and if the price rebounds from this level, it could indicate further upside potential. On the other hand, a break below the 20-day EMA could keep the pair range-bound between $980 and $1,370 for some time.
Arbitrum price analysis
Arbitrum (ARB) is currently in a downtrend, but the bulls are holding their ground as they anticipate a possible move higher. The RSI is gradually turning positive, and if buyers push the price above the 20-day EMA ($0.85), it could signal the start of a sustained recovery. On the downside, support levels are at $0.80 and $0.78. A break below this zone could resume the downtrend.
Theta Network price analysis
Theta Network (THETA) has shown signs of a comeback, with the bulls absorbing the supply and attempting to push the price higher. The 20-day EMA ($0.61) is a key support to watch, and if the price turns up from this level and climbs above the 50-day SMA ($0.64), it could lead to further gains. However, a downside break of the 20-day EMA may result in a potential retest of $0.57.

Note: This article does not contain investment advice or recommendations. Readers should conduct their own research before making any investment decisions.
Did you miss our previous article...
https://trendinginthenews.com/crypto-currency/miss-universe-organization-denies-association-with-coin-project-at-philippine-blockchain-week


