
Bitcoin (BTC) is facing a rare chart phenomenon which has historically resulted in 50% price drawdowns, new data shows.
In a tweet on April 25, popular account Nunya Bizniz noted a fresh warning sign from two key moving averages on BTC/USD.
Analyst: BTC could spend 6 months recovering from dip
For only the third time in its history, Bitcoin’s 20-week and 50-week moving averages (WMAs) have both started to slope downwards.
While that may look harmless at glance, the result of the first two events — in late 2014 and late 2018 — was BTC/USD losing over 50%.
BTC weekly:
— Nunya Bizniz (@Pladizow) April 25, 2022
On 3 occasions the slope of both the 20 & 50ma turned negative.
The first 2 lead to 50%+ corrections.
This time? pic.twitter.com/eIMsQ6dk8H
Both came at similar points in Bitcoin’s four-year halving cycles, and while slightly ahead of time, it has now been nearly as long since the 2018 dip, this bottoming out at $3,100.
“I think this chart draws valid parallels,” longtime commentator and macro investor Tuur Demeester commented on the findings.
“If bitcoin could not capitulate this time and hold above $35k, it would be an incredibly bullish sign. My base case scenario however, given how weak global markets look, is a downwards slide and 3-6 months of price recovery.”
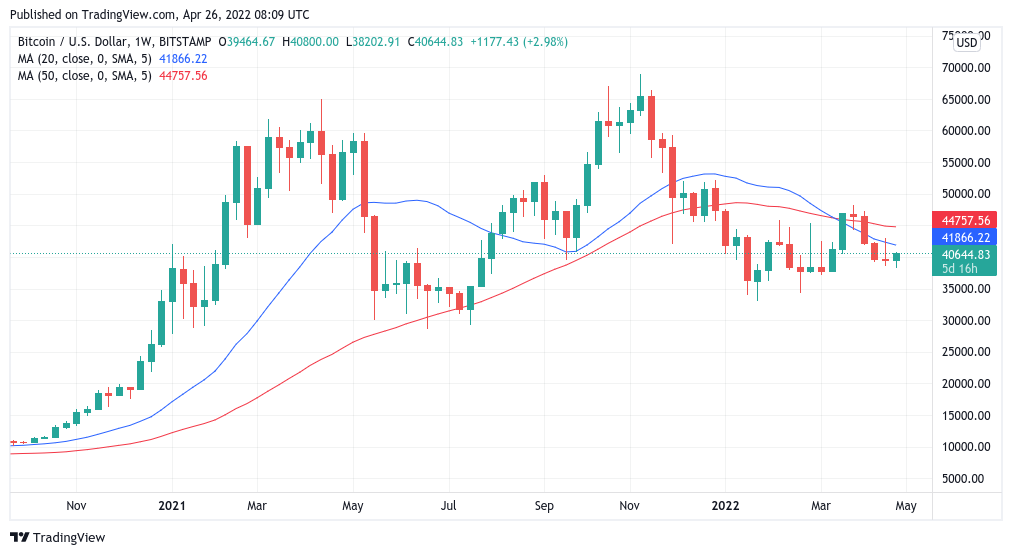
In mid-March, the 20WMA crossed under the 50WMA, data from Cointelegraph Markets Pro and TradingView shows, in what is commonly known as a "death cross" move among chartists. Despite its name, the phenomenon has not always resulted in significant losses.
Dollar strength sparks increasing suspicion
As Cointelegraph reported, consensus continues to form over a protracted period of price weakness for Bitcoin, which should come in line with a correction on heavily-correlated global stock markets.
Related: Bitcoin spoofs $39.5K breakout at Wall St open as Elon Musk Twitter takeover nears
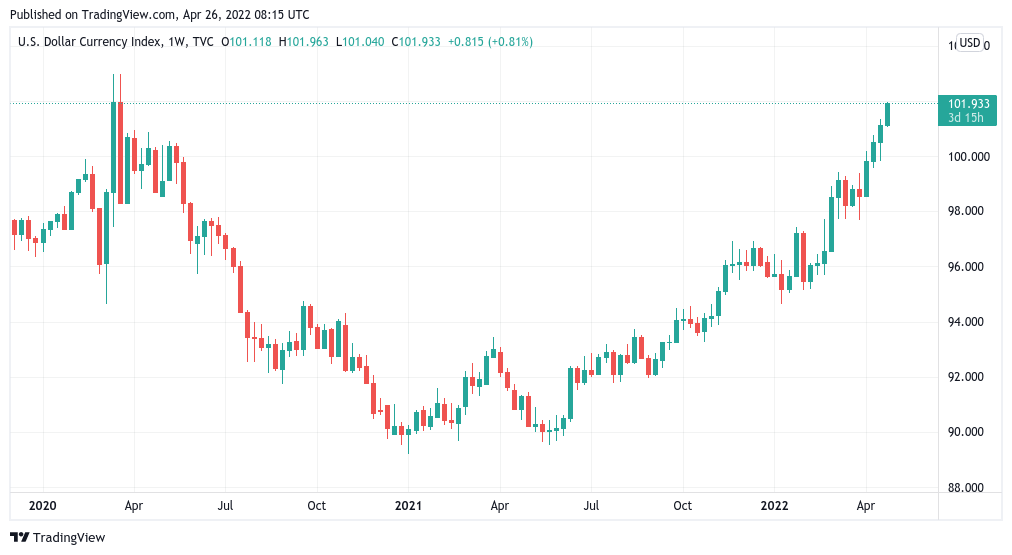
The strength of the U.S. dollar in the face of anti-inflation maneuvers by the Federal Reserve is also in focus as a preemptive warning sign for those forecasting a shock event after two years of liquidity printing.
“DXY approaching multi-decade highs,” analyst Dylan LeClair continued in a fresh Twitter thread on the topic Monday.
“The USD continues to strengthen against foreign fiat currencies, tightening financial conditions. A breaking point for a historically over-leveraged economic system is approaching, by design.”
For LeClair, it is very much a case of short-term pain, long-term gain for BTC hodlers. The recovery will come via a “pivot” by the Fed, which will be unable to sustain inflation-busting monetary tightening for long.
“Fed will eventually be forced to switch back to easing, as a deep global recession will follow any sustained period of monetary tightening,” he forecast.
“Supply chain wreckage from Ukraine conflict & China lockdowns with this level of global indebtedness = sovereign defaults. BTC will fly.”
com. Every investment and trading move involves risk, you should conduct your own research when making a decision.
Title: Bitcoin repeats rare weekly chart signal that resulted in 50% BTC price dips
Sourced From: cointelegraph.com/news/bitcoin-repeats-rare-weekly-chart-signal-that-resulted-in-50-btc-price-dips
Published Date: Tue, 26 Apr 2022 09:21:14 +0100