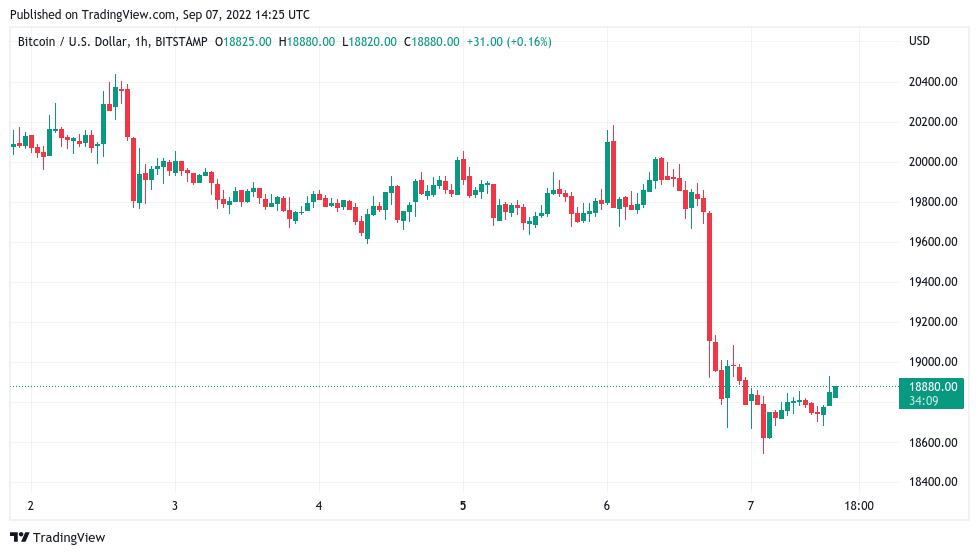
Bitcoin (BTC) provided a long awaited breakout into Sept. 7 as BTC price action dashed bulls’ hopes of a recovery.

$23,000 relief bounce "still likely" says trader
Data from Cointelegraph Markets Pro and TradingView captured snap losses for BTC/USD later on Sept. 6, with overnight lows coming in at $18,540 on Bitstamp.
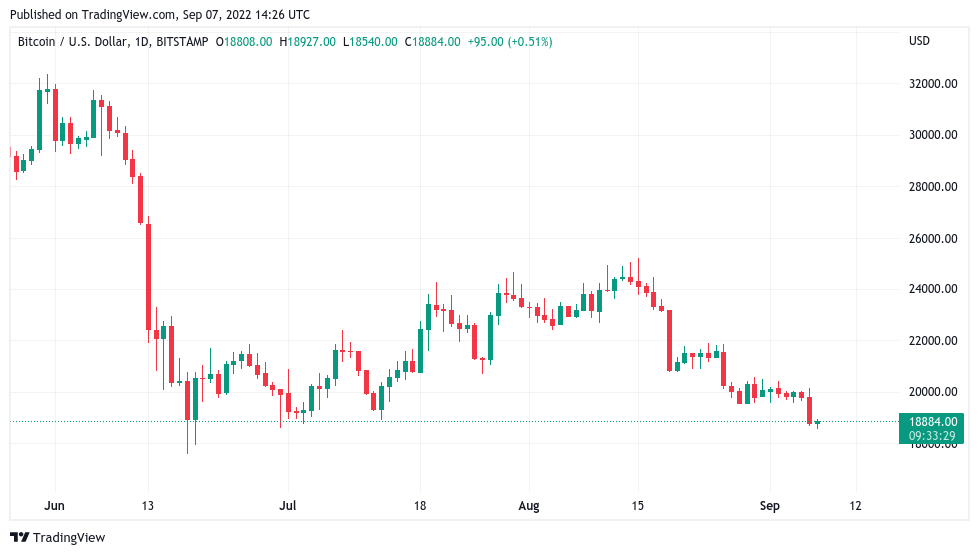
The pair put in its lowest levels since June 30, taking liquidity from the July floor and only marginally recovering on the day.

Downside price action followed almost a week of sideways movements and volatility was nowhere to be seen as market participants gritted their teeth hoping for an exit to the upside.
In the event, they were left disappointed, but for popular trader Il Capo of Crypto, there was still reason to believe that a relief bounce would occur.
“First of all, price is right now sitting above major daily support (range low, 18,500–19,000),” he argued in a Twitter thread.
“It's where the last bear market rally started, indicating there's strong demand here. A bounce from here to the supply zone (22500–23000) would form a perfect H&S.”
Il Capo of Crypto added that each breakdown had been accompanied by waning volume, suggesting that sellers were having to work increasingly against the tide to take prices lower.
“Funding also indicates that shorts are getting trapped on every leg down and that there's a lot of fuel for a short squeeze,” he added.
For this not to occur, consolidation would need to begin under the late June levels near $18,500.
“Summary: short squeeze to 22,500–23,000 is still likely,” the thread concluded.
“Most people are bearish and arrogant, but charts show otherwise. Don't get confident with your short positions. I'm still mostly on USDT but hedging for this potential move. Time will tell.”
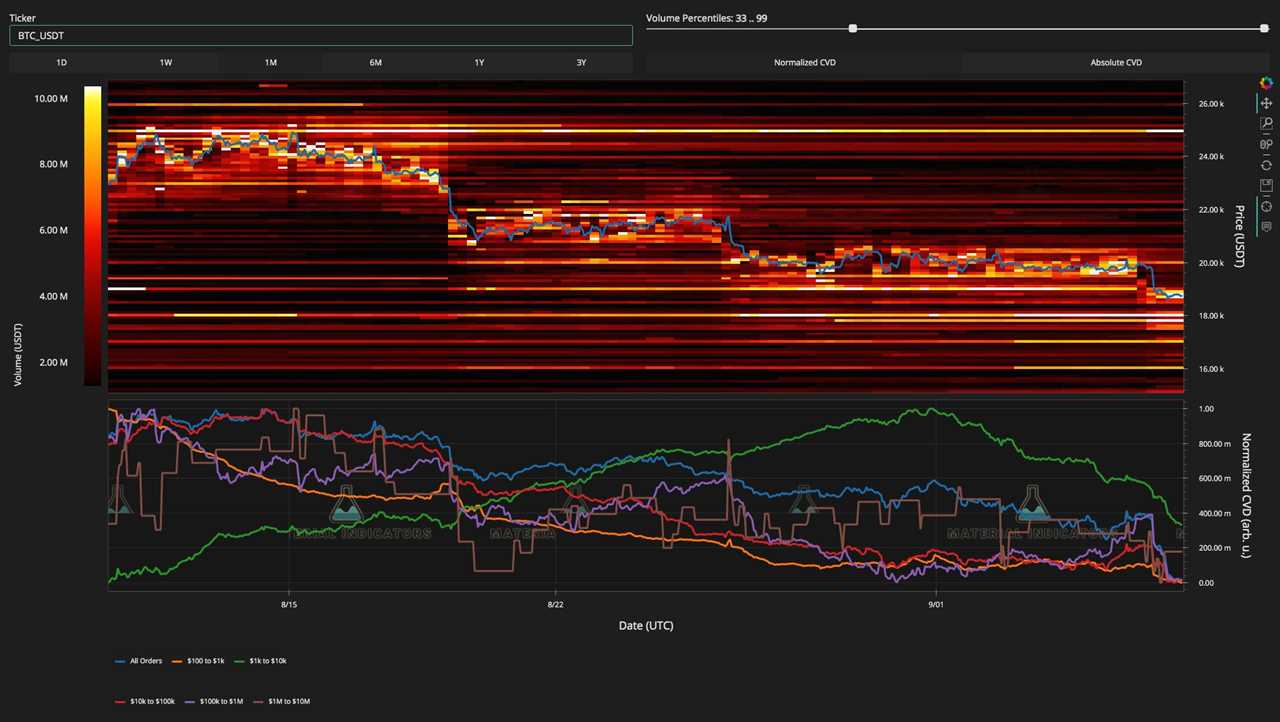
Data from the Binance BTC/USD order book uploaded by on-chain monitoring resource Material Indicators confirmed that Bitcoin is acting in an area of major liquidity.

DXY gets 120 target after "major correction"
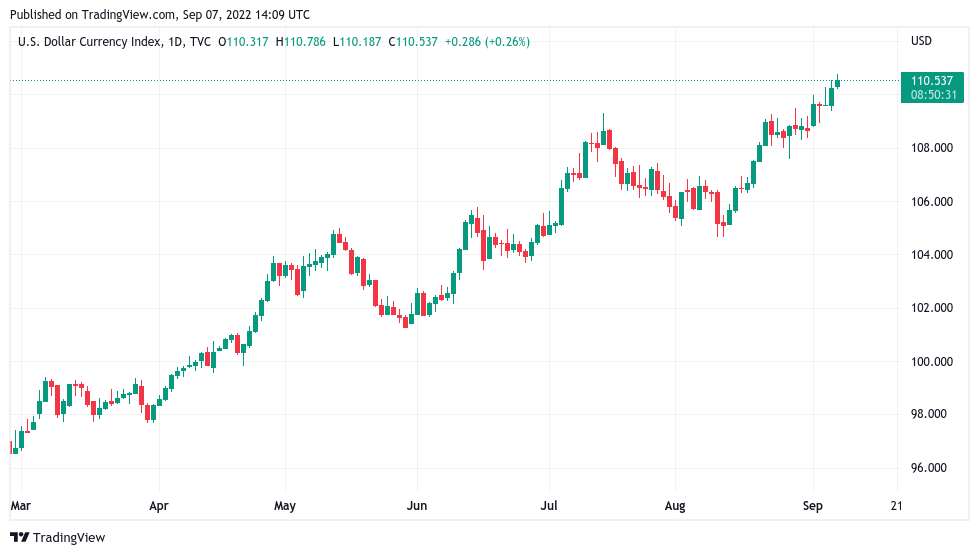
Macro markets meanwhile provided interesting viewing on the day as the U.S. dollar raged higher.
The U.S. dollar index (DXY) set new twenty-year highs of 110.78, this accompanied by a deeper dive on the euro and yen, continuing a grim trend from recent months.
Related: Bitcoin price falls under $19K as data shows pro traders avoiding leverage longs

For macro economist Henrik Zeberg, a brief retracement was not to be celebrated, as the greenback would then come back with a vengeance to head to 120, a level last reached in January 2002.
Nonetheless, he predicted, the correction would mean crypto would be “flying.”
IT IS ALL ABOUT THE #DXY
— Henrik Zeberg (@HenrikZeberg) September 7, 2022
Reversal soon for major correction - swift - before bottom and new painful rally up to my final target of ~120
Correction will last few months and will send Risk Assets flying #equities #crypto etc. = BLOW-OFF-TOP pic.twitter.com/2hs6b5lKIA
By contrast, WTI crude oil hit its lowest levels since the start of the year in what popular trading account Blockchain Backers called the start of “the capitulation of oil.”
U.S. equities opened modestly higher, with the S&P 500 and Nasdaq Composite Index gaining 0.3% and 0.65% in the first hour’s trading, respectively.
com. Every investment and trading move involves risk, you should conduct your own research when making a decision.
Title: Bitcoin price hits 10-week low amid 'painful' US dollar rally warning
Sourced From: cointelegraph.com/news/bitcoin-price-hits-10-week-low-amid-painful-us-dollar-rally-warning
Published Date: Wed, 07 Sep 2022 16:39:03 +0100


