The price of Bitcoin (BTC) faces two crucial events on Dec. 1 right after the weekly and monthly candles close. The upcoming weekly candle close is particularly noteworthy because it could mark the first red weekly candle since late September.
The monthly candle will be significant since it would mark the highest close in Bitcoin’s history if the price remains over $13,791.
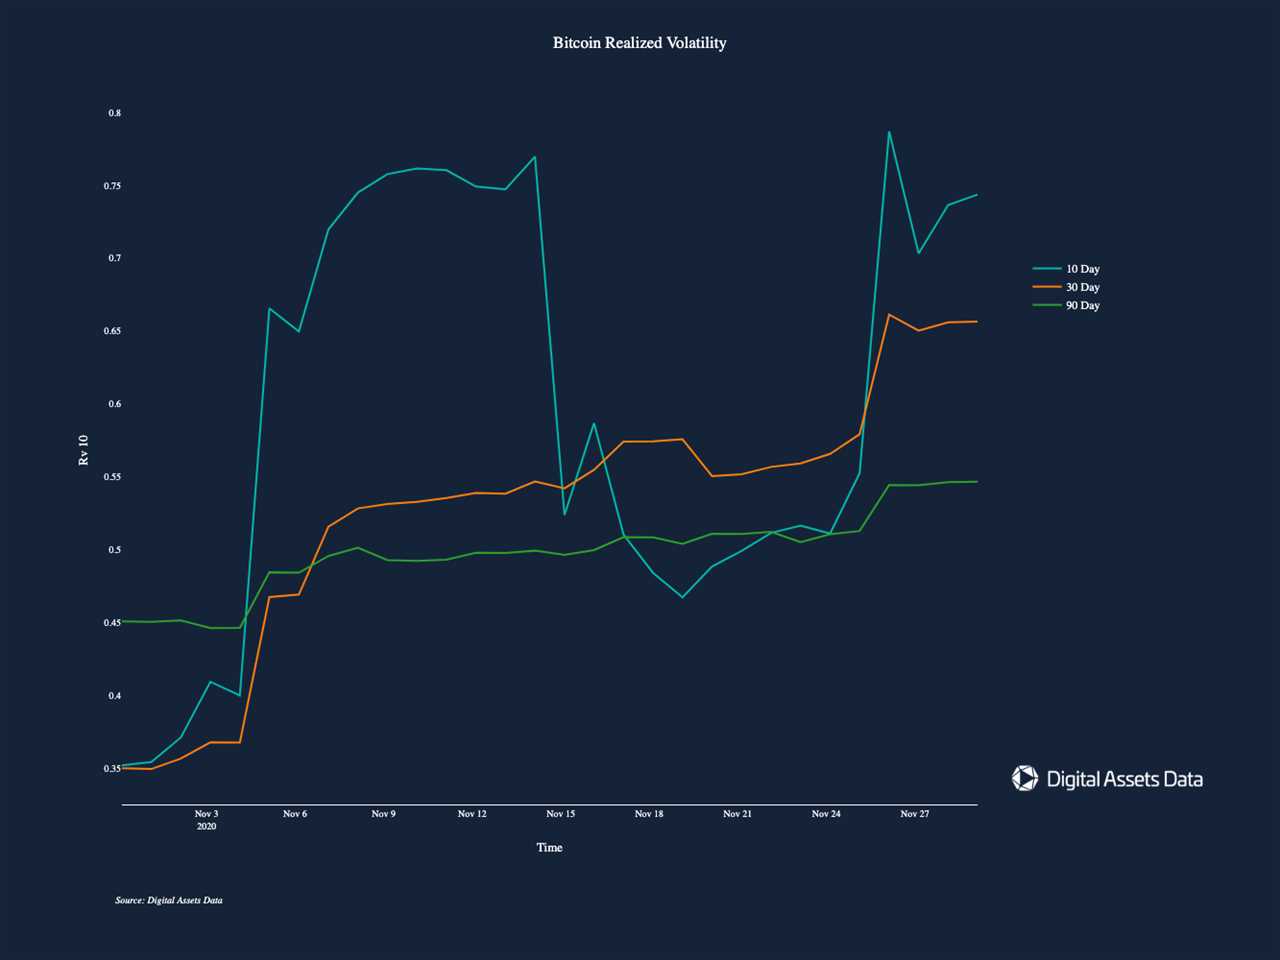
There are three key factors that could cause the volatility of Bitcoin to spike upon the weekly and monthly candle close. The factors are general uncertainty around the BTC price, record-high futures trading activity and open interest, as well as the overextended weekly chart.
Meanwhile, traders have turned cautious anticipating a pullback in the near term despite the rebound in price from around $16,500 on Nov. 28.
There are two key trends that could be fueling the recovery of BTC. First, Guggenheim Investments, a global asset management firm with over $233 billion in assets under management, secured the right to invest $500 million in the Grayscale Bitcoin Trust.
In the U.S., where a Bitcoin exchange-traded fund (ETF) does not exist, the Grayscale Bitcoin Trust is the first point of entry for most institutional investors. Deribit reported that the news triggered significant buying activity in the options market. The firm said:
“Reports of Behemoth Guggenheim Macro Opps fund seeking to designate $500mn, promulgated over the weekend, caught shorts +TA pullback allocators by surprise as BTC bounced 2k from lows. The quiet wknd options market was ignited. Dec Calls bought, funded by Puts; hedges unwound.”
Second, high-net-worth investors and whales might be buying the dip in anticipation of Monday. In recent weeks, as quantitative traders pointed out, most of the buyer demand came from the U.S.
Some speculate that the demand is coming from Time-weighted Average Price (TWAP) algorithms, typically used by institutions and funds. Since TWAP algorithms would get activated again on Monday, this could add to the buyer demand for BTC.
Traders are generally uncertain about BTC price direction
There is a high degree of uncertainty in the cryptocurrency market at the moment as traders are divided on where the price will go next.
Some are confident that BTC likely bottomed during the weekend due to market trends. For instance, Avi Felman, the head of trading at BlockTower, said that on Coinbase the recent pullback caused BTC to transfer to stronger hands.
Sell-offs during a bull market can become overextended, especially because traders often look for reasons to sell. As such, overleveraged buyers get caught at local tops, leading to cascading liquidations. But BTC frequently tends to recover right when traders expect more downside and market sentiment reaches a low point. Felman explained:
“Decent and extended Coinbase selling at the local bottom for the first time this rally suggests to me that retail is slowly picking up. Fairly obvious transfer from weak hands to strong hands over the last 48 hrs. Pullbacks in bull markets always hand you a silver platter of reasons to sell.”
Additionally, various technical indicators signal that Bitcoin is neither overbought nor oversold across lower timeframes.
On the daily chart, as an example, the Relative Strength Index (RSI) of BTC is at around 55. An asset is considered oversold on the RSI indicator if it drops below 35. Hence, Bitcoin is in an awkward position because high time frame charts, like the weekly chart, remain overbought.
This has led traders to predict a potential correction to the $13,000 to $14,000 support range could soon occur. This high level of uncertainty in the market could cause volatility to increase as the new weekly and monthly candles open.
The open interest across futures exchanges would likely increase again, raising the probability of big price movements.
Whales becoming more active in BTC futures
Throughout the rally of Bitcoin in recent weeks, the trading activity on major BTC futures exchanges has continuously increased. Despite the recent drop, the open interest on top futures trading platforms remains above $1 billion. When the open interest is high, the likelihood of a short or long squeeze increases, which may result in large spikes in volatility.
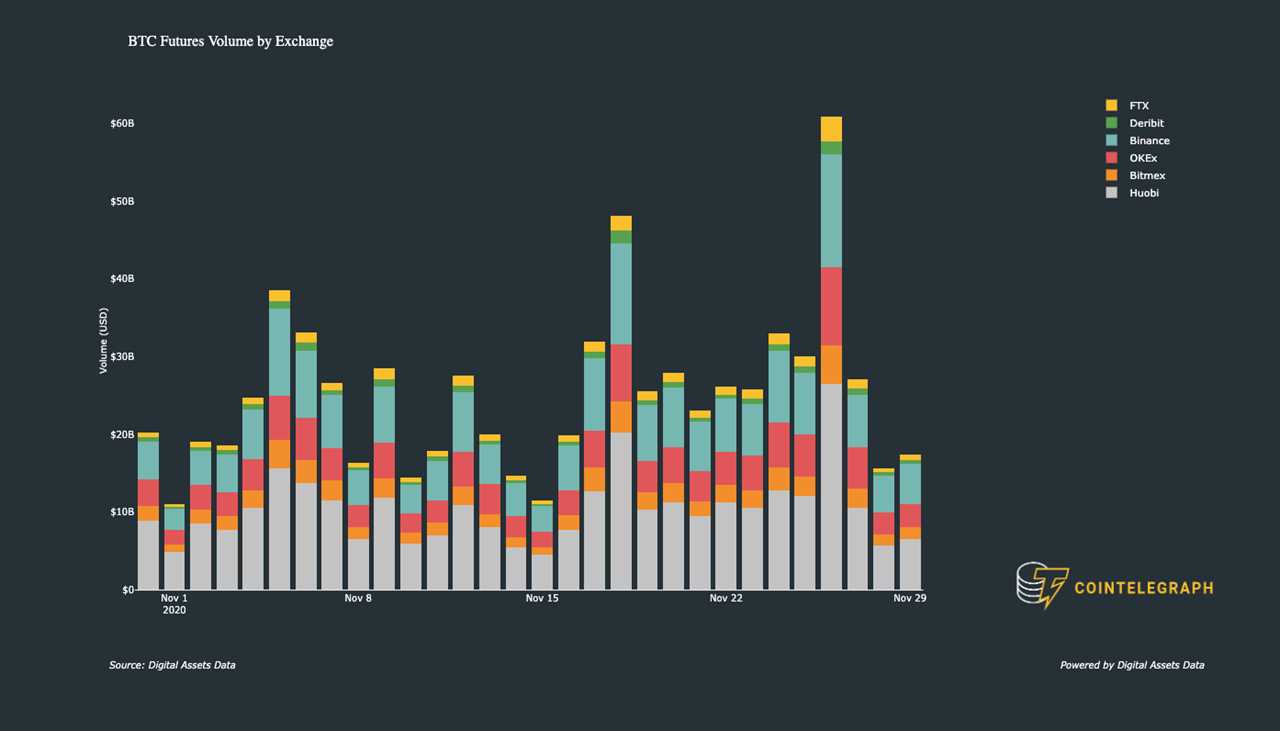
The Chicago Mercantile Exchange (CME), in particular, has seen a noticeable increase in Bitcoin futures trading activity. Interestingly, Arcane Research reported that large traders who hold a minimum position of over 25 BTC more than doubled on the CME in 2020.
The researchers at Arcane explained that this trend shows increased institutional demand for Bitcoin. The heightened trading activity on CME, which tailors to accredited and institutional investors, can cause short-term volatility to increase due to the large sizes of trades. The researchers said:
“Large traders hold at least 5 futures contracts, equaling a minimum of 25 BTC (5 BTC per contract). The average in 2019 was 45 large traders without any notable growth throughout the year. However, this number has more doubled in 2020 and we saw a new record of 102 large traders two weeks ago. This is perhaps one of the best indications of increased institutional demand for bitcoin exposure and we already know that investors like Paul Tudor Jones is a part of this growing group on CME, currently the second largest futures market for bitcoin.”
Although the institutional demand for Bitcoin has been rising, the futures market remains a major factor driving volatility.
Cointelegraph reported earlier this week that when BTC fell from $19,400 to $16,200 largely due to cascading liquidations, over $400 million worth of futures contracts were wiped out on Binance Futures alone.
New weekly candle is a big variable
Bitcoin will see a new weekly candle emerge in the next 48 hours, but the variable remains the overbought nature on the weekly time frame.
The RSI of the weekly chart is at 88, and when the RSI of an asset surpasses 75, it is considered overbought. The weekly candle is also significantly above short-term moving averages (MAs), namely the 5-day, 10-day and 20-day MAs.
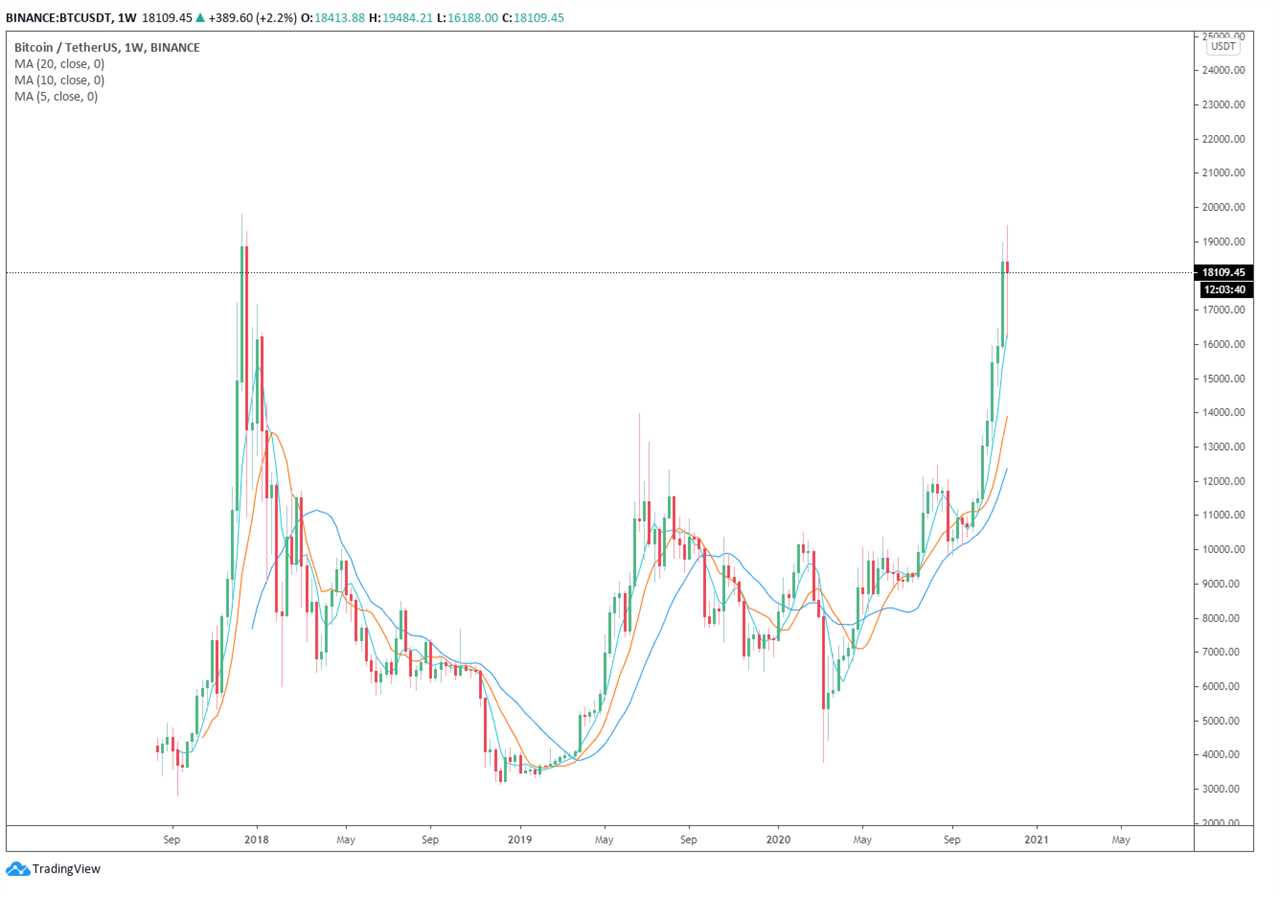
Traders have been anticipating a correction because the weekly chart is overextended. It would make a more sustainable rally if BTC consolidates above short-term MAs, as it would give time for the derivatives market and spot buyer demand to catch up.
Furthermore, the monthly candle chart of Bitcoin is even more overextended than the weekly chart. The 5-day, 10-day and 20-day MAs are at $13,129, $10,778, and $9,685, respectively, and significantly below the current market price.
But whether technicals alone would cause BTC to correct in the foreseeable future remains uncertain. If institutional buyers, like Guggenheim, continue to make headlines by entering the Bitcoin market, it could attract additional buyers and retail interest in the near term.
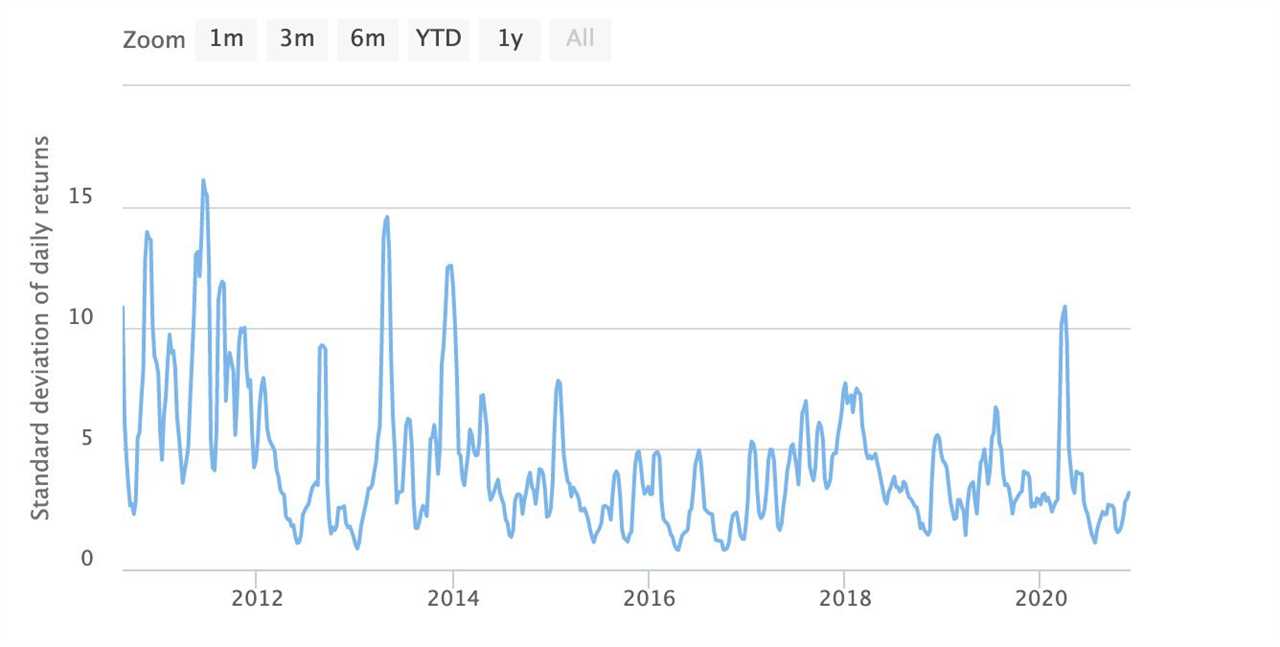
To boot, December has historically been highly volatile for the price of Bitcoin. Though December 2019 recorded a relatively low level of volatility, the end of 2017 and 2018 saw wild price swings including the all-time high BTC price of nearly $20,000 and the bear market bottom, respectively.
If a similar pattern emerges, BTC price could see a spike in volatility as it heads towards the end of the year.
Title: Bitcoin may see major price volatility at the start of December — Here's why
Sourced From: cointelegraph.com/news/bitcoin-may-see-major-price-volatility-at-the-start-of-december-here-s-why
Published Date: Sun, 29 Nov 2020 14:15:54 +0000


