Bitcoin’s (BTC) succession of sharp corrections from its all-time high at $64,900 has turned investor sentiment negative, at least for the short-term. While some analysts believe the bottom may have been hit, others are warning of a further fall due to the “Death Cross” pattern that, at the time of writing, is on the verge of completion.
For new traders, the name death cross itself brings a lot of negativity and a feeling of impending doom. This sentiment can trigger selling panics, especially if the market has already been going through a bear phase prior to the pattern being spotted.
However, is a death cross something to be feared or is it a crystal ball that gives traders insight on when a plunge is imminent?
Let’s find out with the help of a few examples.
What is a death cross and how accurate is it?
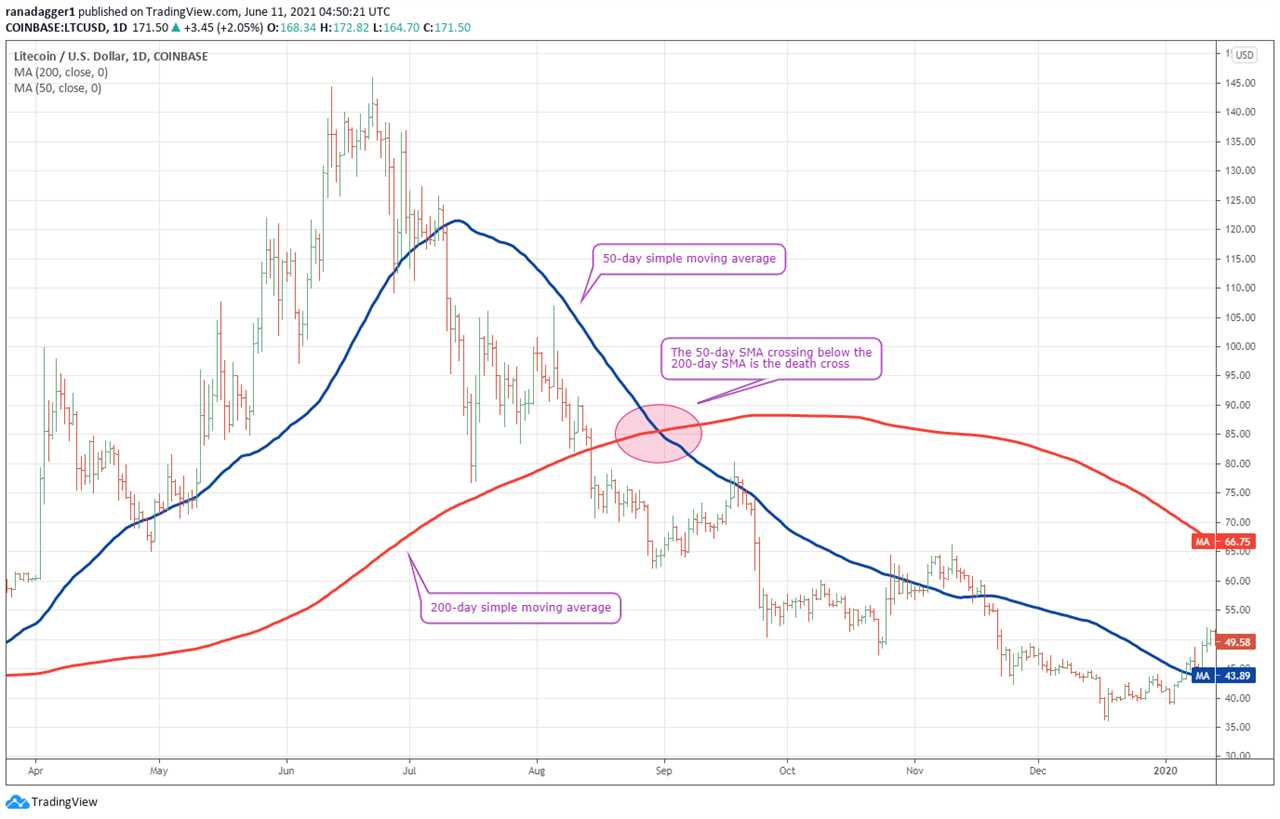
The death cross forms when a faster period moving average, usually the 50-day simple moving average, crosses below the longer-term moving average, generally the 200-day SMA.

The crossover is bearish as it shows that the uptrend has reversed direction. Large institutional investors generally do not buy in a falling market until a bottom is confirmed. Due to this, buying dries up and investors holding positions rush to the exit due to panic, exacerbating the decline.
Before looking at a few death cross examples in the crypto markets, let’s see how the pattern has affected the S&P 500 index between 1929 to 2019. According to Dorsey, Wright & Associates, LLC, the average fall after the formation of the death cross is 12.57% and the median fall is much lesser at 7.75%.
However, if only the post-1950 period is considered, the average fall is less than 10.37% and the median is at 5.38%.
While those figures are not startling, especially for volatility-accustomed crypto traders, the bearish convergence of these two moving averages should not be taken lightly.
History shows that the death cross has resulted in a few instances of massive declines in the U.S. stock market indices.
After the death cross on June 19, 1930, the S&P 500 plummeted 78.84% before bottoming out on Sep. 15, 1932. The next terrible death cross came with a 53.44% correction that occurred from Dec. 19, 2007, to June 17, 2009.
This shows how in select instances, the death cross has been able to predict a sharp correction. However, two sharp declines of over 50% in a 90-year history suggests the pattern is not reliable enough to instil instant fear in traders.
Recent Bitcoin death crosses
As cryptocurrencies are still a nascent market, the available data is limited. Let’s review a few instances of the death cross and how it has affected Bitcoin.

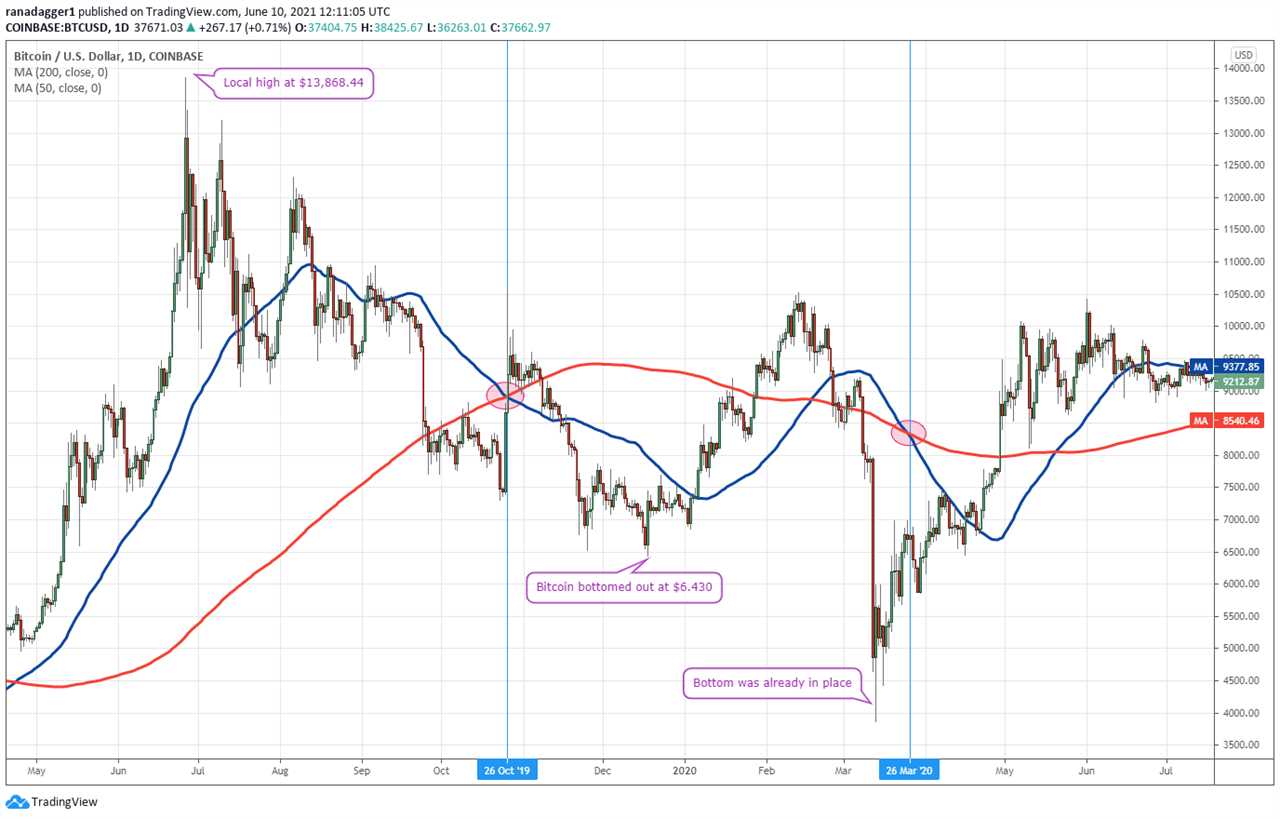
The most recent death cross occurred on March 26, 2020, when the BTC/USD pair closed at $6,758.18. However, this death cross turned out to be an excellent contrarian buy signal as the pair had already formed a bottom2 weeks back at $3,858 on March 13.
Before that, the pair had formed a death cross on Oct. 26, 2019, when the price closed at $9,259.78. By then, the pair had already corrected 33% from the high at $13,868.44 made on June 26, 2019.
After the cross, the pair bottomed out at $6,430 on Dec. 18, 2019, suffering a further 30% fall. From the high of $13,868.44 to the low at $6,430, the total decline was roughly 53%.

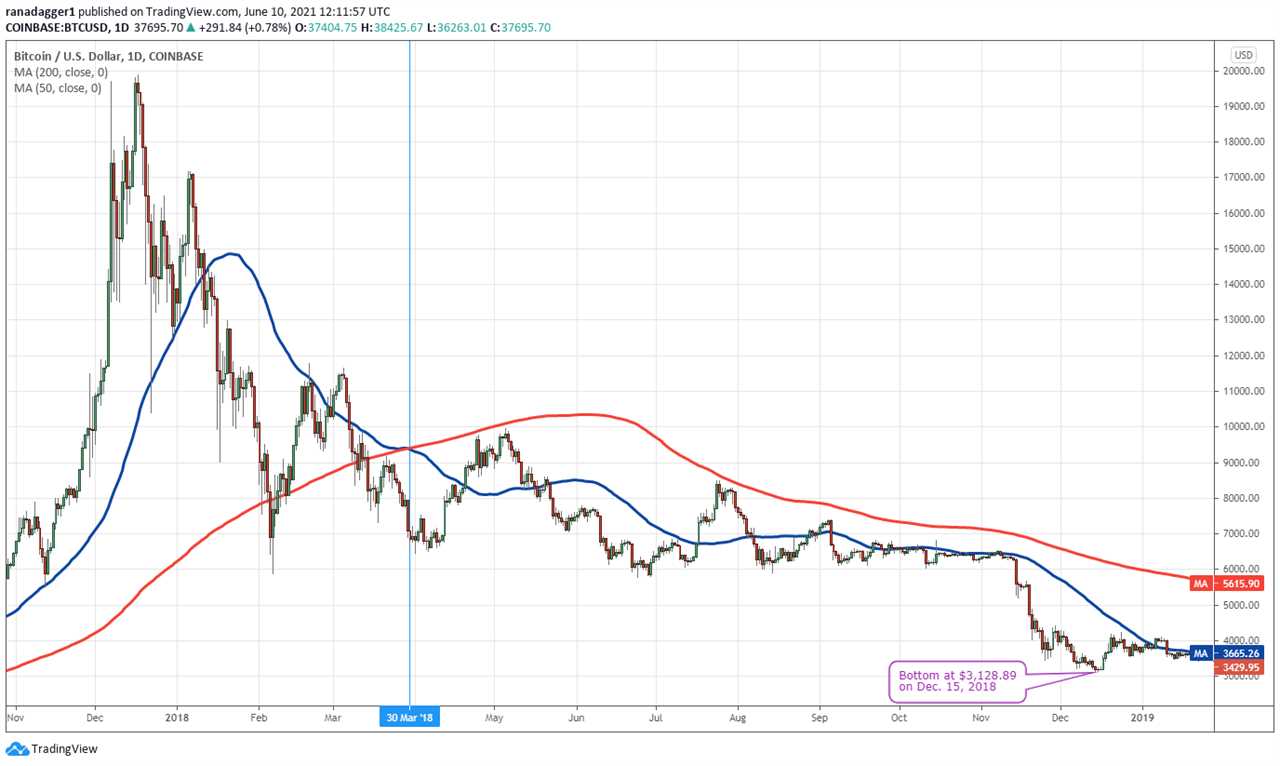
In another scenario, Bitcoin’s roaring bull market topped out at $19,891.99 on Dec. 17, 2017, and the death cross formed on March 30, 2018, when the pair closed at $6,848.01. By then, the pair had already corrected over 65% from the then all-time high.
Thereafter, the selling continued and the bear market bottom formed at $3,128.89 on Dec. 15, 2018. This meant a further fall of about 54% from the death cross and a total drawdown of 84% from the all-time high.
The above instances show how the death cross occurs late in the bear market cycle and investors who wait for the pattern to form give a lot of profits back to the market. At the same time, initiating bearish bets may work for short-term traders but could prove detrimental for long-term investors.
Key takeaways
The examples show how the death cross is a lagging pattern, which forms when a large part of the decline has already occurred. Typically, long-term investors don’t need to panic if they spot the death cross on the daily charts but it is a signal to be more attentive to and perhaps prepare one’s portfolio for positioning for a variety of unanticipated outcomes.
Death crosses can also, at times, be used as a contrarian signal so when they are spotted traders should look for other indications of the chart to spot a possible bottom.
com. Every investment and trading move involves risk, you should conduct your own research when making a decision.
Title: Here’s how Bitcoin’s impending death cross could be a contrarian buy signal
Sourced From: cointelegraph.com/news/here-s-how-bitcoin-s-impending-death-cross-could-be-a-contrarian-buy-signal
Published Date: Sun, 13 Jun 2021 01:15:00 +0100
Did you miss our previous article...
https://trendinginthenews.com/crypto-currency/nvidia-ceo-were-on-the-cusp-of-a-blockchain-and-nftenabled-metaverse-


