CORONAVIRUS cases in one of the worst hit areas in the UK are still rising and this map reveals if your local authority is one of them.
Infections in the South West have been rising for over a week now – with experts concerned that hospitals won’t have the capacity to deal with rising rates.

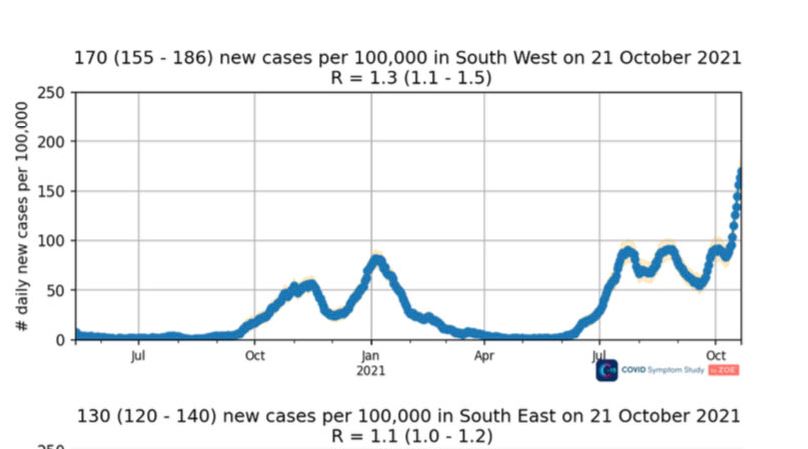
The graph above shows how coronavirus cases are increasing in the South West of England
Cheltenham in Gloucestershire currently has the highest rate of infection in the UK, with 1,478 new cases in the seven days to October 21, the equivalent of 1,273.7 per 100,000 people.
This is up sharply from 602.4 in the seven days to October 14.
Professor Tim Spector of King’s College London and lead on the ZOE Symptom Tracker app said it wasn’t just Cheltenham that is having issues in the region.
Posting to Twitter he used a graph from the app which showed a dramatic increase in infections across the region.
He said: “Zoe recording the highest ever number of new cases in the South West currently – so not just Cheltenham having problems.
“The SW also has the lowest hospital capacity.”
When it comes to other areas in the South West, Tewkesbury in Gloucestershire has the third highest rate in the country, just behind Blaenau Gwent in Wales, up from 484.4 to 1,212.9, with 1,172 new cases.
Many local authority areas in the region feature in the most infected including Stroud, Swindon, Mendip, Bath and North East Somerset, South Gloucestershire and Gosport, each of these areas has seen a rise in cases.
Public health experts in the South West had previously said that an issue with testing had meant that case rates were actually far higher than had been recorded – and was the reason for such a steep increase in infections.
However, the government has stated that rates in the area were linked to previously lower rates across the region – rather than the lab errors that had occurred in Wolverhampton and had impacted testing across most of the South of England.
Prime Minister Boris Johnson’s official spokesperson last night said: “In terms of the causes behind the increase in the south-west, we’ve seen there was this lab error; I don’t believe that accounts for the increases we have seen.
“We know the south-west was an area that did not previously have as high rates as other parts of the country, which may be a factor as well.”
Government data shows that out of the 377 local authorities across the UK, 255 have seen a rise in infections in the seven days to October 21.
In terms of case rate per 100,000, the South West has the highest rate, with 760 cases per 100,000 of the population.
But daily case rates paint a different picture and the government dashboard states that 4,863 people are currently testing positive each day in the South West, this makes it the second highest areas for daily infections, with the South East reporting 6,258 each day.
In terms of daily hospital admissions, the daily rate in the South West has actually gone down in the last few days.
Government data states that 96 people each day are being admitted in the South West, this is down slightly from 100 a day last week.
The area with the most daily hospital admissions is the North East and Yorkshire and the Humber with 154 each day – this is also down from 121 last week.
One expert said while the initial testing blunder would have caused infections, those people who had in fact had Covid would no longer be testing positive – meaning the virus had now been spread across the community.
Dr Kit Yates, a senior lecturer in the department of mathematical sciences at the University of Bath said these figures will be independent of the testing scandal, indicating that the fast rises we are seeing are genuine and not a result of retesting.
Speaking to The Guardian, he said there are two factors as to why the South West might be experiencing high rates.
“Firstly, the south-west has the highest proportion of the new AY4.2 subvariant, which seems to spread slightly faster than the original Delta variant.
“Secondly, it’s also the case that not all the false negatives were sent to the south-west; some were sent to Wales, some to the south-east and some to Yorkshire, so it’s possible that some of the rises in these regions are also due to the false negatives scandal.”
The latest figures from the government yesterday revealed that Covid deaths and cases had dropped to their lowest figures in two weeks.
Another 38 deaths were confirmed yesterday along with 36,567 new infections.
Daily infections have not been so low since October 10, when cases rose by 34,574.
Meanwhile, newly recorded deaths were last lower on October 11, when the number grew by 28.


