Christopher Wood, the global head of equity strategy at Jefferies, has dumped five percent of their physical gold position in order to buy Bitcoin (BTC). This move shows that a growing number of institutional investors consider Bitcoin to be at par or a better store of value than gold.
Wood also said that if Bitcoin were to have a big correction, he would buy more. The fact that institutional investors are content purchasing in the $16,000 to $20,000 range suggests that institutional investors are not worried about a pullback as they view it as an opportunity to accumulate for the long term.
One River Digital Asset Management also recently revealed a $600 million bet on Bitcoin and Ether. CEO Eric Peters, said the hedge fund plans to buy more Bitcoin and Ether in the first half of next year to take the total allocation in the assets to $1 billion.
This is further signal that the institutional demand for crypto assets is likely to remain high going into 2021.
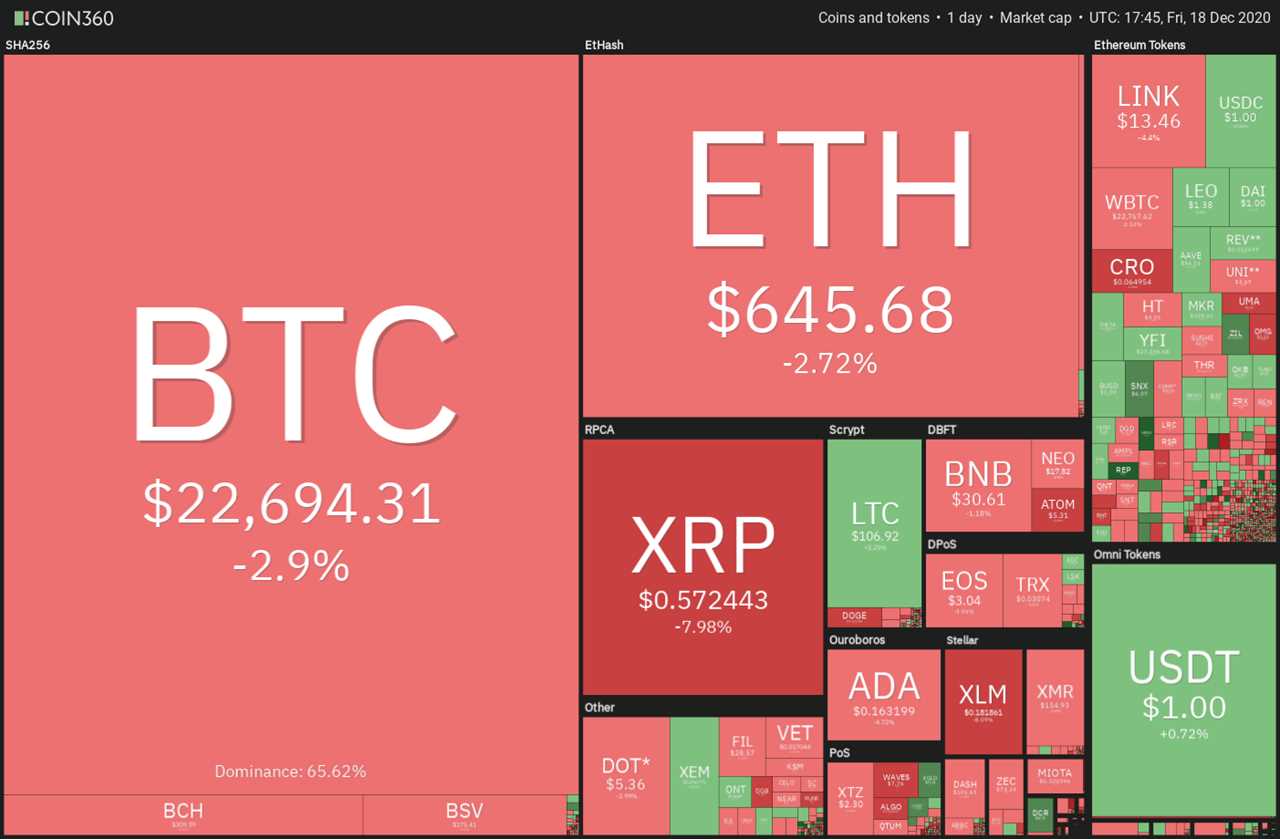
Nigel Green, founder and CEO of deVere Group, expects Bitcoin’s bull run to continue in 2021 as the digital asset's rally will be supported by the influx of “some of the world’s biggest institutions.” Green expects Bitcoin’s price to at least rise by 50% or even possibly double next year.
However, not everyone is convinced about the prospects of Bitcoin. Billionaire Mark Cuban said that Bitcoin is not a hedge “against doomsday scenarios” and it is “unlikely to replace fiat currency anytime soon.”
Will Bitcoin correct in the short term and give a bragging opportunity to the naysayers, or will it continue to rally higher? Let’s analyze the charts of the top-10 cryptocurrencies to find out.
BTC/USD
Bitcoin (BTC) picked up momentum after it crossed the $20,000 psychological barrier on Dec. 16. The up-move continued on Dec. 17 and the price hit a new all-time high at $23,795.29.
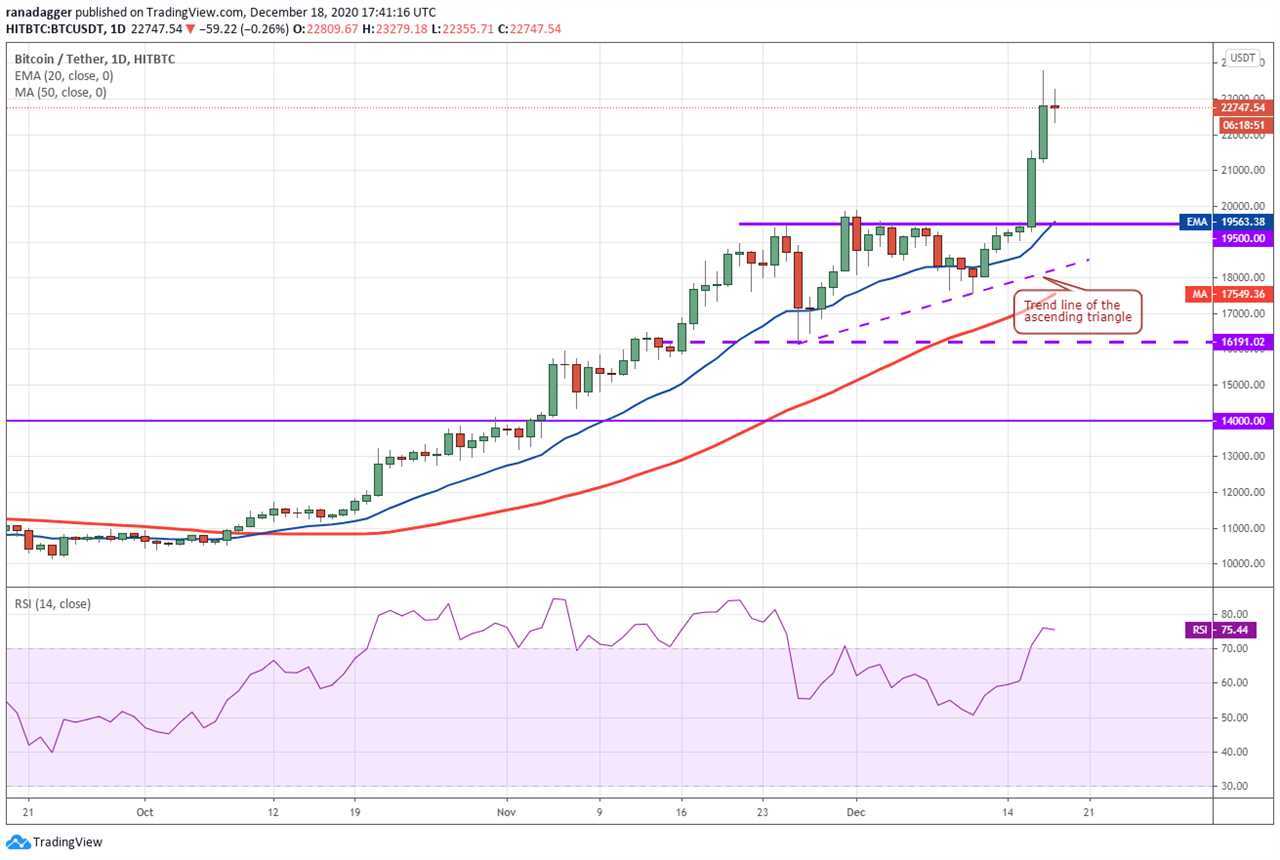
The BTC/USD pair has formed an inside day candlestick pattern today, which usually acts as a continuation pattern. This pattern suggests that bulls are taking a break after the aggressive buying of the past two days.
However, the positive thing is that the price is close to the recent high, which suggests that bulls have not closed their positions in a hurry even after the sharp rally of the past two days. This indicates that traders expect the rally to extend further to $25,000 and then $26,000.
Although it is difficult to call a top in a market backed by strong momentum, the pair could face strong headwinds at $26,000.
On the downside, the critical level to watch is $20,000. If the bulls flip this level to support, then the next leg of the uptrend could resume. However, if the price dips below the $20,000 support and fails to recover the pair could witness a deeper correction.
ETH/USD
Ether (ETH) broke above the $622.807 resistance on Dec. 16, which completed the ascending triangle pattern. This bullish setup has a target objective of $763.614.
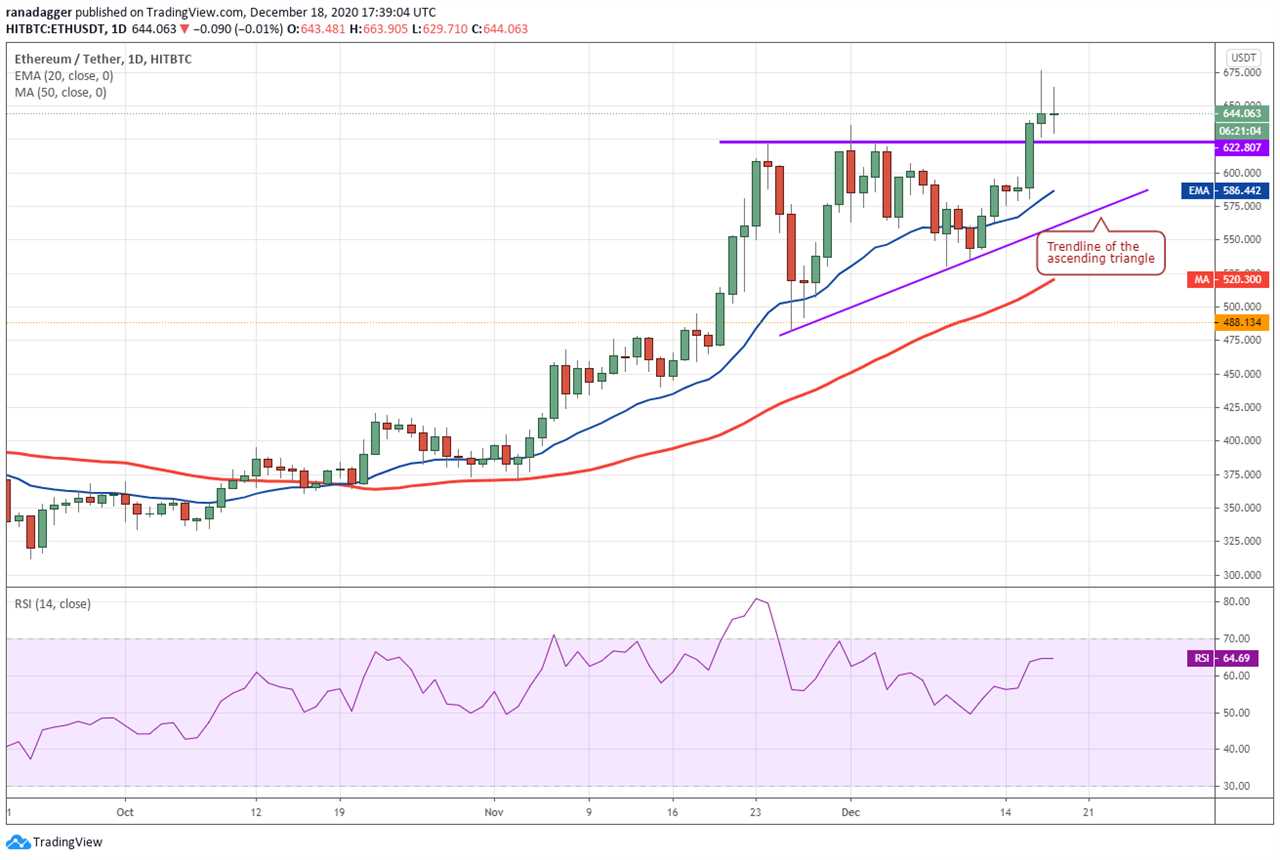
However, after the breakout from a pattern, the price usually retests the breakout level. Even in this case, the price has corrected to $622.807.
If the bulls can flip $622.807 to support, it will suggest that traders are buying at this level. That increases the prospects of the continuation of the uptrend. The rising moving averages and the relative strength index (RSI) above 64 suggest that bulls have the upper hand.
This positive view will be invalidated if the price dips and sustains below $622.807. Such a move could suggest that the recent breakout was a bull trap. This narrative will be further strengthened if the price breaks below the trendline of the triangle.
XRP/USD
XRP broke above the downtrend line and the 20-day exponential moving average ($0.54) on Dec. 16, which suggests that the correction could be over. The bulls attempted to sustain the momentum on Dec. 17 but faced stiff resistance above $0.65.
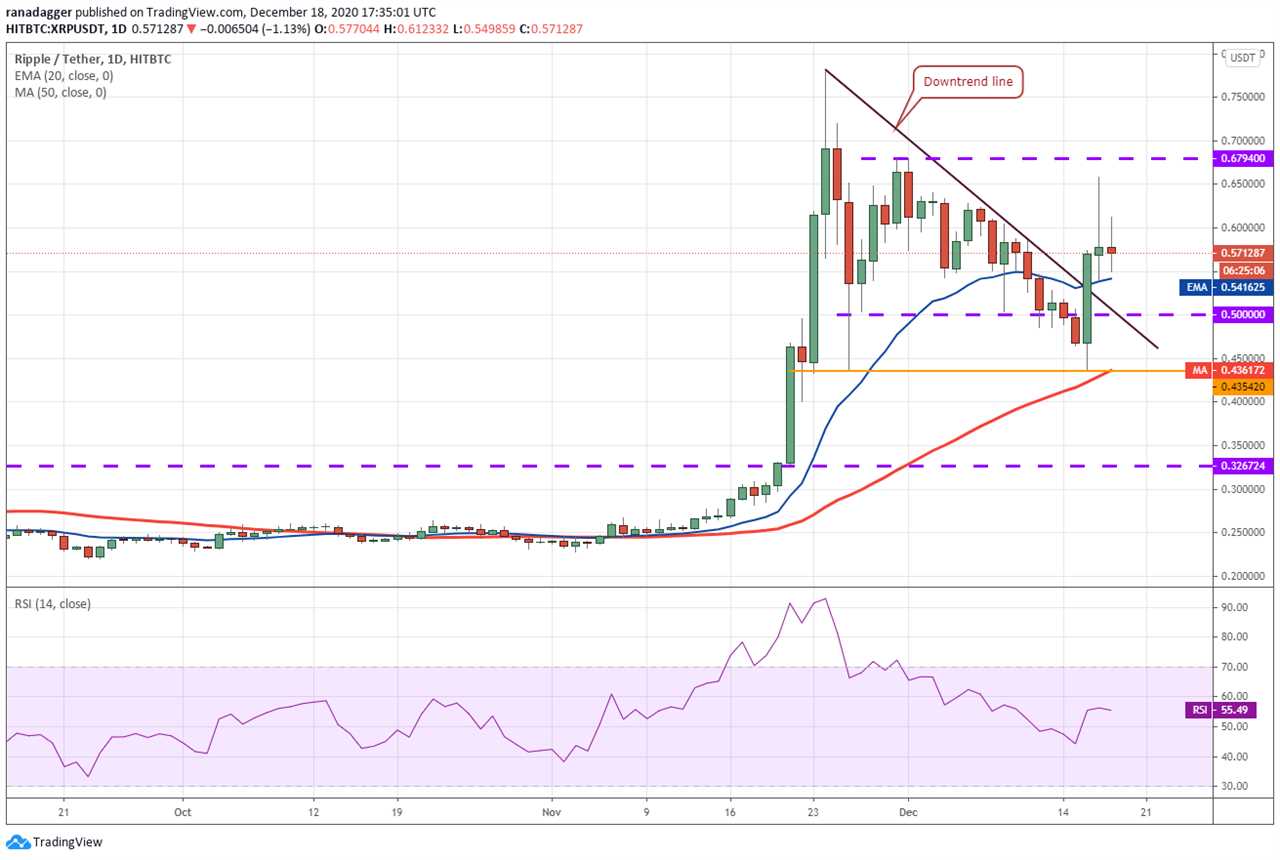
The inside day Doji candlestick pattern today hints at indecision among the bulls and the bears. If the price dips below the 20-day EMA, the XRP/USD pair may drop to $0.50 and then again to $0.435420.
If that happens, it will suggest that the pair may remain range-bound for a few days. A breakout of $0.6794 will invalidate this view.
The flattish 20-day EMA and the RSI oscillating between 43 and 57 also point to a possible consolidation in the near term.
LTC/USD
Litecoin (LTC) surged above the symmetrical triangle on Dec. 16 and followed that up with another strong move on Dec. 17. This move pushed the price above the $93.9282 resistance and the $100 psychological level.
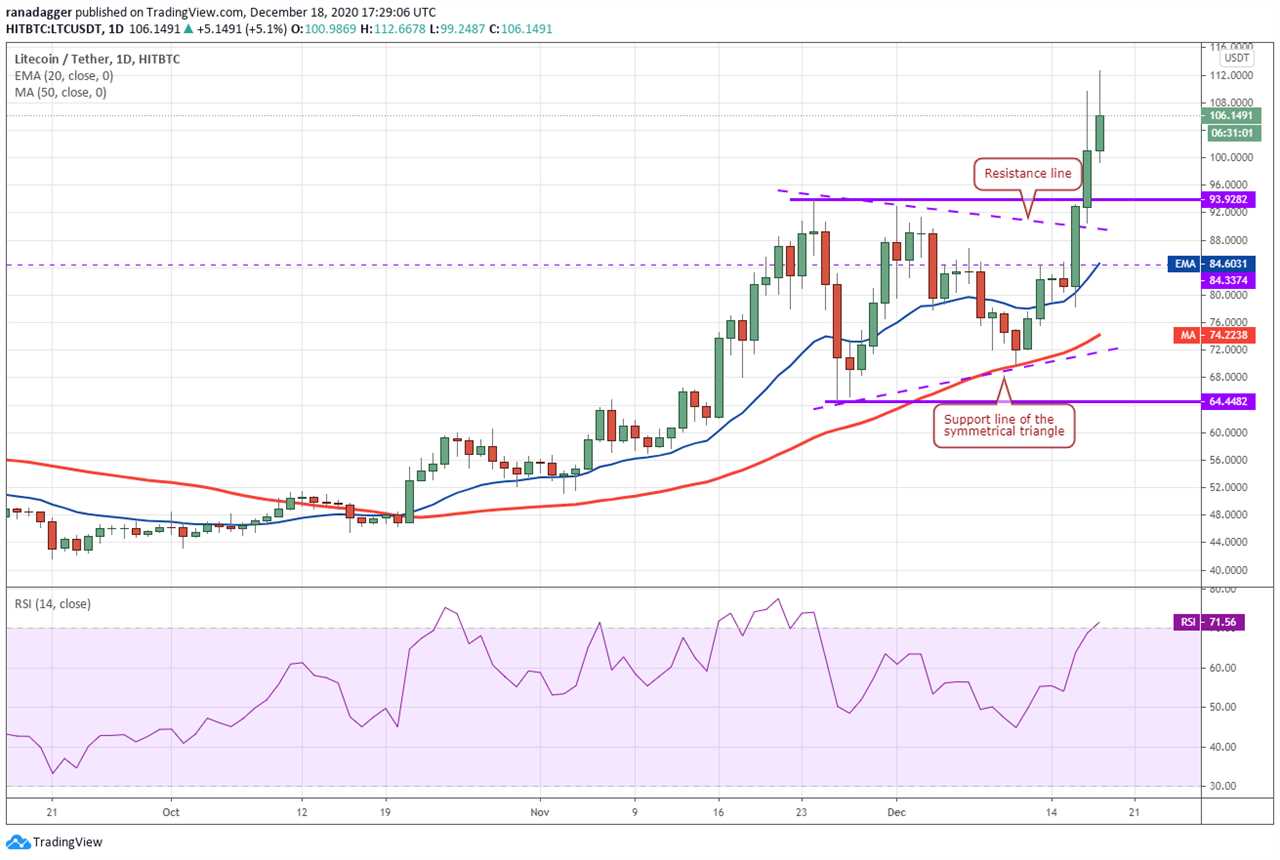
The long wick on Dec. 17 candlestick shows profit booking at higher levels but the bulls did not allow the price to stay below the $100 support. This suggests that traders are buying on every minor dip.
However, the long wick on today’s candlestick shows that traders are again booking profits at higher levels. This is an early signal of exhaustion and if volume dries up the LTC/USD pair could correct to $93.9282 in the next few days.
If the price rebounds off this support, it will confirm it as the new floor. That could start the journey towards the next target level at $140. Conversely, if the price breaks below $93.9282, the pair could drop to the 20-day EMA ($84).
BCH/USD
Bitcoin Cash (BCH) broke above the $322.08 resistance on Dec. 17 but the price turned down from $331.69. This shows that the bears are aggressively defending this resistance.
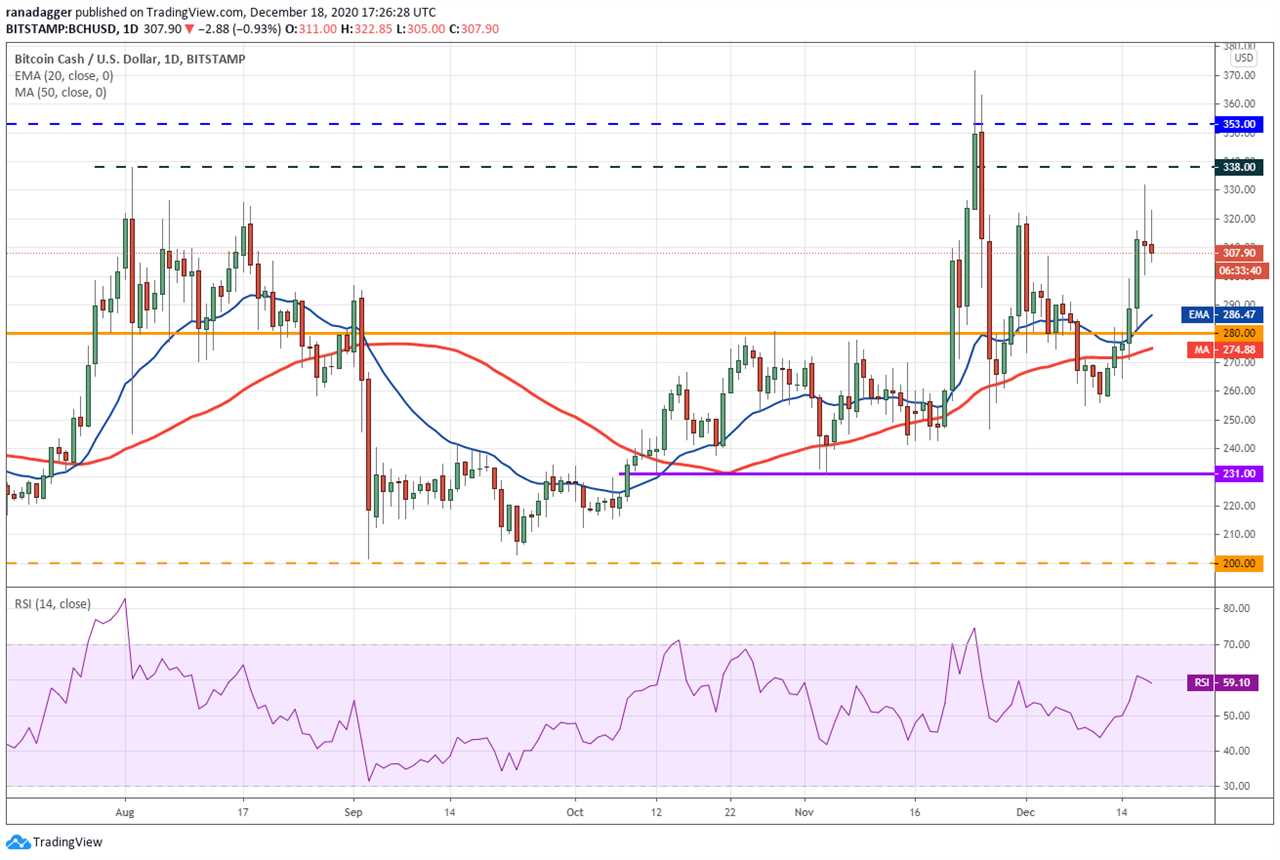
The inside day candlestick pattern today shows that the uncertainty continues as bulls buy on dips and bears sell on rallies. The rising 20-day EMA ($286) and the RSI above 59 suggest an advantage to the bulls.
If bulls can propel the price above $338, the BCH/USD pair could rally to $371.70 and then to $400. Conversely, if the bears sink the price below $300, the pair may drop to the 20-day EMA. Such a move could keep the pair range-bound for a few days.
LINK/USD
Chainlink (LINK) formed a Doji candlestick pattern on Dec. 17 and has made another one today. This shows indecision among the bulls and the bears, but the positive sign is that the price has sustained above the $13.28 support for the past two days.
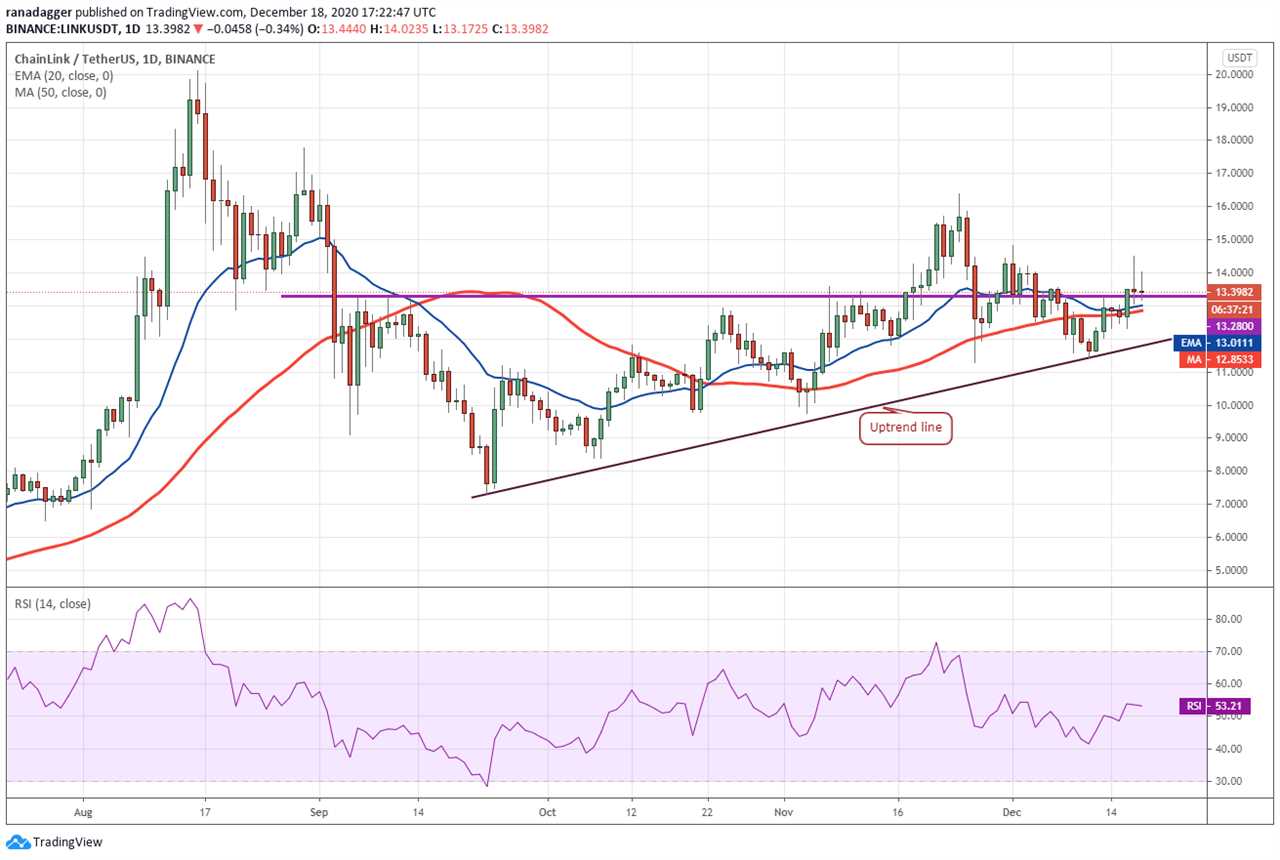
If the bulls can push the price above $15, the LINK/USD pair could rise to $16.39. A breakout of this resistance could signal the start of a new uptrend that may retest the high at $20.1111.
The flat moving averages and the RSI just above the midpoint do not point to a clear advantage either to the bulls or the bears. If the price again turns down from $15, the pair may remain range-bound for a few days.
ADA/USD
Cardano (ADA) turned down from the $0.175 overhead resistance on Dec. 17 but the bears could not prolong the correction. The bulls purchased the minor dip and are likely to again try and push the price above $0.175.
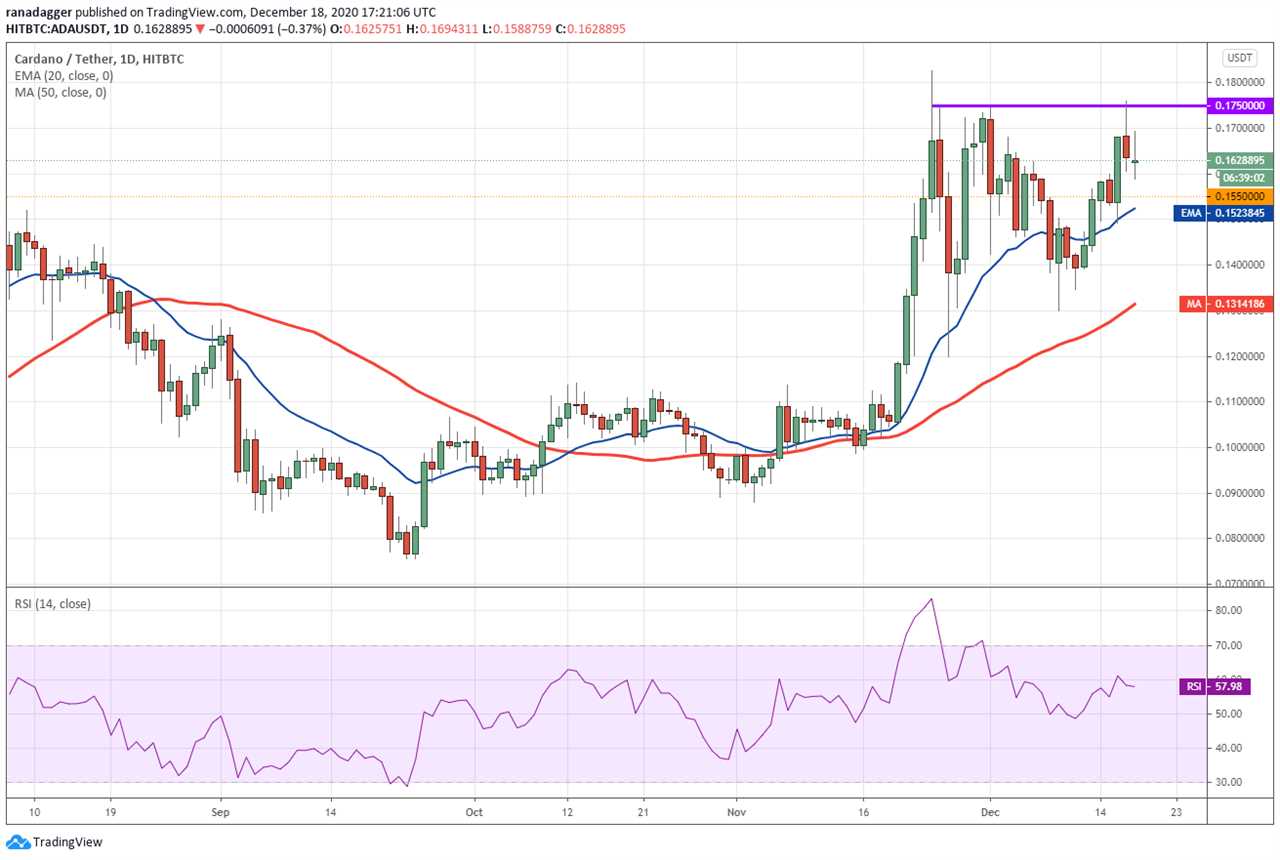
The rising moving averages and the RSI in the positive zone suggest that bulls are in control. If the bulls can drive and sustain the price above 0.175, the next leg of the uptrend could begin. The next target on the upside is $0.20 and then $0.26.
Contrary to this assumption, if the price again turns down from $0.175, a drop to the 20-day EMA ($0.152) is possible. A strong bounce off this support will increase the likelihood of a break above $0.175.
However, if the bears sink the price below the 20-day EMA, the ADA/USD pair could drop to $0.14 and then to the 50-day simple moving average ($0.131).
DOT/USD
The bulls pushed Polkadot (DOT) above the $5.5899 overhead resistance on Dec. 17 but could not sustain the higher levels. This shows that the bears are aggressively defending this resistance.
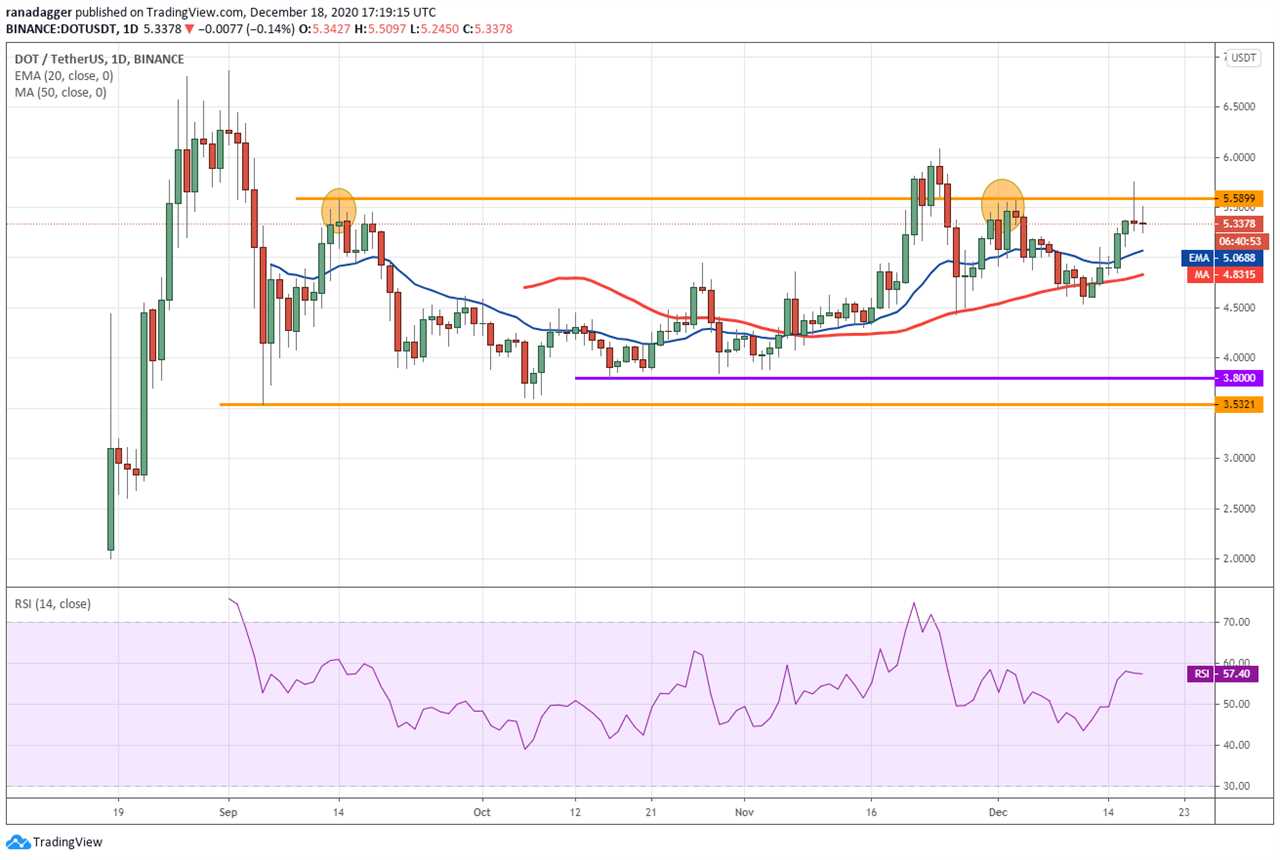
However, the bulls have not given up much ground and are likely to make another attempt to push the price above $5.5899. If they can sustain the price above this resistance, the DOT/USD pair could rally to $6.0857 and then to $6.8619.
The upsloping moving averages and the RSI above 57 suggest that the path of least resistance is to the upside. This positive view will invalidate if the price again gets rejected at $5.5899. In that case, a drop to the 20-day EMA ($5) is possible.
BNB/USD
Binance Coin (BNB) continues to oscillate between the $32 resistance and the $25.6652 support. In an established range, traders sell when the price nears the resistance as they expect the price to turn down.
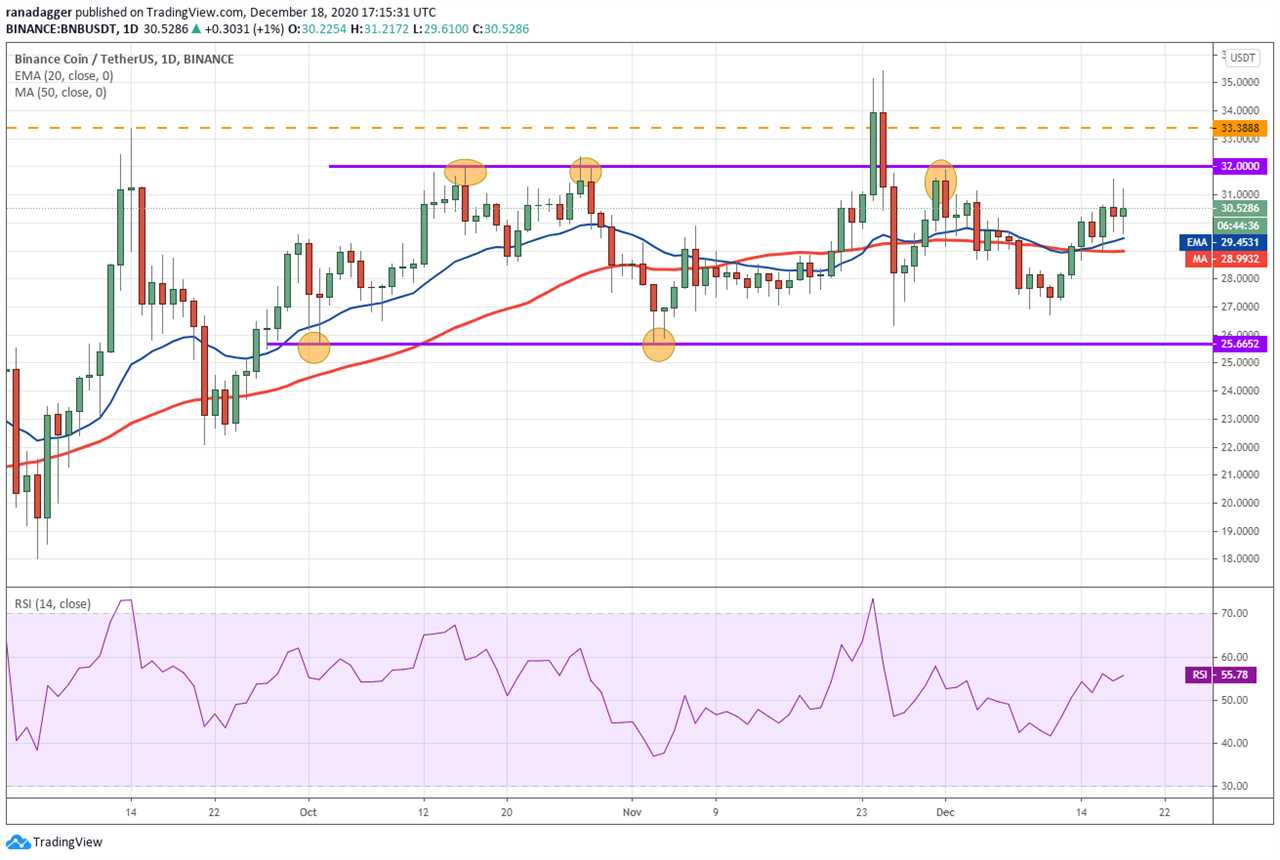
However, the bulls purchased the dip to the moving averages today and will now make one more attempt to push the price above $32.
If they succeed in sustaining the price above the range, the BNB/USD pair could start the next leg of the uptrend that could retest the all-time high at $39.5941.
On the contrary, if the price again turns down from $32, it will suggest that bulls have not been able to overpower the bears. That could keep the pair inside the range for a few more days.
XLM/USD
Stellar Lumens (XLM) broke out and closed above the $0.18 resistance on Dec. 16. This move suggests that the correction may be over. The upsloping moving averages and the RSI in the positive zone also suggest that bulls have the upper hand.

However, the bears have not thrown in the towel yet. The long wick on the Dec. 17 candlestick shows that the bears are selling on rallies.
If the price rebounds off the current levels or the 20-day EMA ($0.168), the bulls will once again try to resume the uptrend. A close above $0.21 could result in a retest of the $0.231655 resistance.
Conversely, if the bears sink the price below the 20-day EMA, the XLM/USD pair may consolidate in a large range for a few days before starting the next trending move.
Market data is provided by HitBTC exchange.
Title: Price analysis 12/18: BTC, ETH, XRP, LTC, BCH, LINK, ADA, DOT, BNB, XLM
Sourced From: cointelegraph.com/news/price-analysis-12-18-btc-eth-xrp-ltc-bch-link-ada-dot-bnb-xlm
Published Date: Fri, 18 Dec 2020 21:18:50 +0000


