CORONAVIRUS cases are still rising in 74 areas across the UK and this interactive map reveals if yours is one of them.
It comes as experts have been warning that the next week-and-a-half is a critical time for the country.
A further 214 Covid deaths were reported yesterday, the third day in a row that they have been over 200.
Data from the government dashboard up to October 31 shows that cases have fallen in 301 of the 377 local authorities in the UK.
Cases have seemingly fallen as data up to October 21 showed that cases had been highest in Tewkesbury, Gloucestershire at 831.1 per 100,000 people.
But the newest data shows that Copeland in Cumbria has the highest rate in the UK, with 526 new cases in the seven days to October 31, the equivalent of 773.1 per 100,000 people.
This is down from 845.1 in the seven days to October 24.
Vale of Glamorgan in Wales has the second highest rate, down from 821.2 to 765.0, with 1,035 new cases.
Torfaen in Wales has the third highest rate, down from 920.6 to 760.3, with 721 new cases.
Clackmannanshire has the highest rate in Scotland (584.9) and Antrim & Newtownabbey has the highest rate in Northern Ireland (553.0).
While these figures are lower than the last seven days, one expert this week warned that cases might be following a similar pattern to last year in that they had come down around October half term, before spiking again later on.
Paul Elliott, director of the React programme at Imperial College London said: “I think watching what happens in the next week, 10 days, is going to be really critical.”
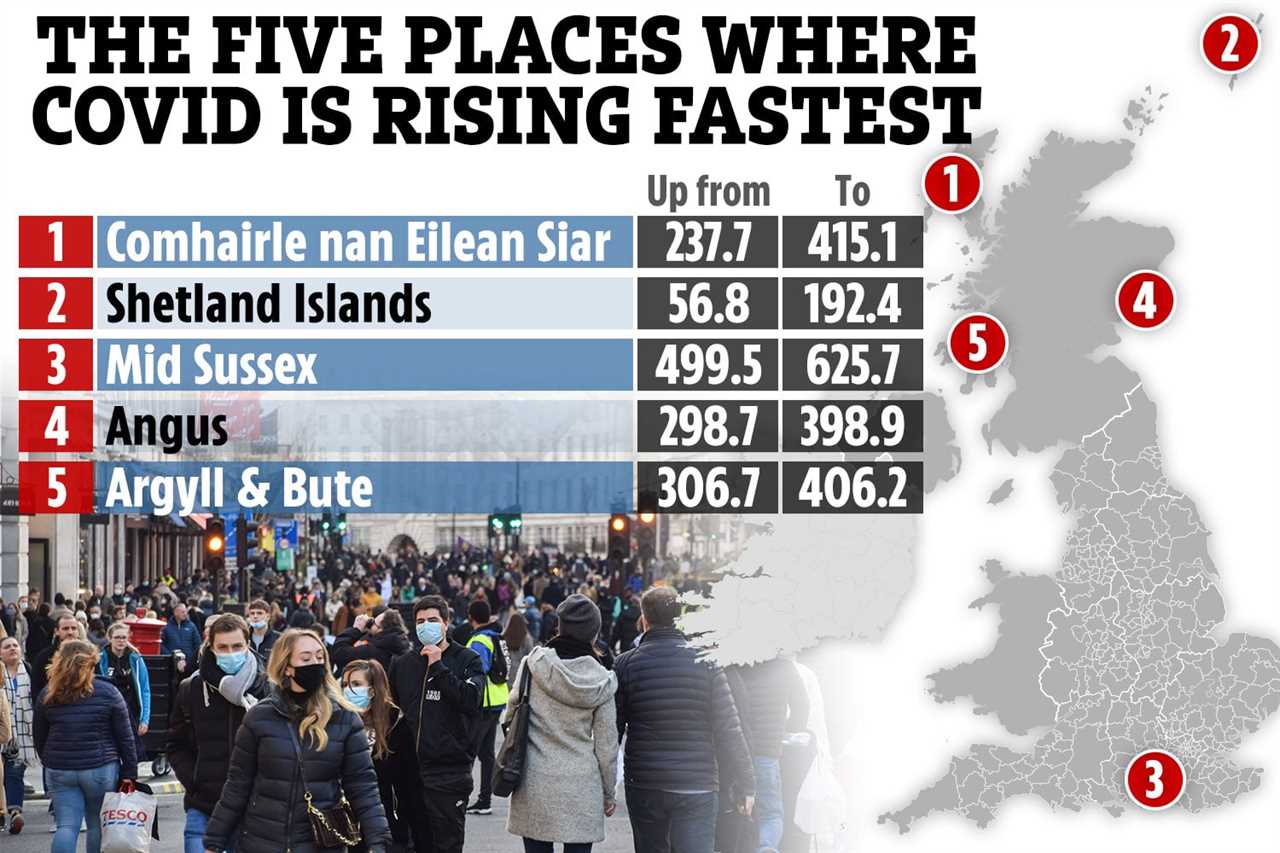
Cases are highest in Copeland, but there are five other areas where infections have seen a significant jump in the last week.
Comhairle nan Eilean Siar in Scotland has seen a rise from 237.7 to 415.1 infections.


