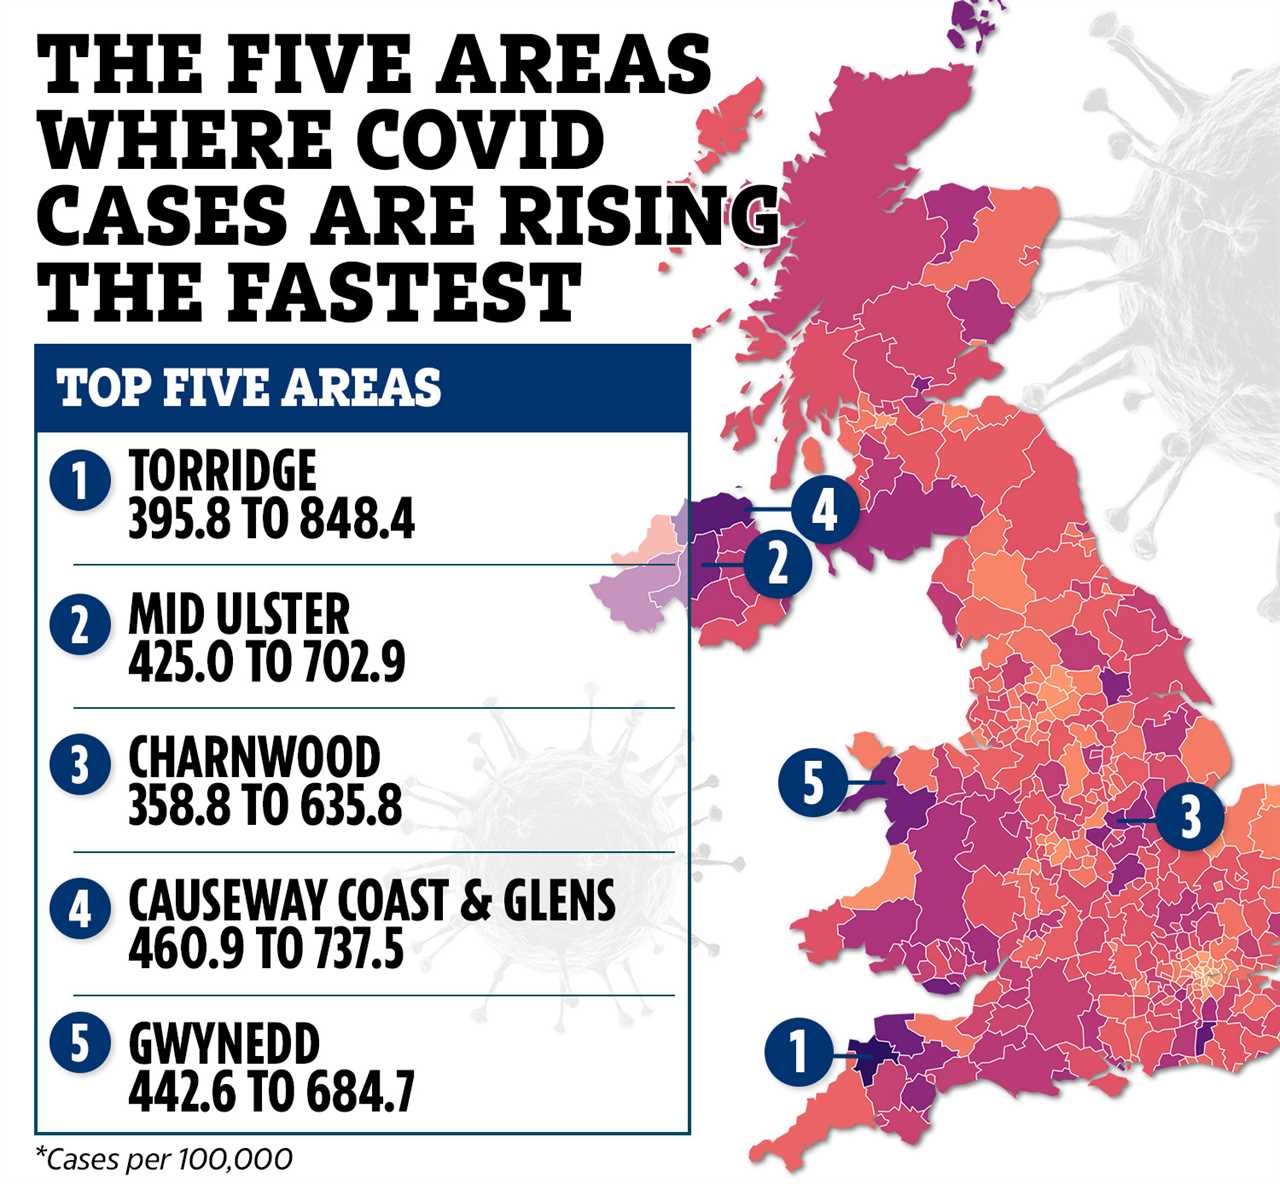
CORONAVIRUS cases are rising in 290 places in the UK and this interactive map reveals if your local area is one of them.
Infections have dropped by more than a fifth in a month as the government continues to urge eligible Brits to come forward for their booster jabs.
Cases have fallen in 87 areas in the seven days up to November 13, and the map above shows the most recent infection rates for each local authority area in the UK.
Torridge in Devon still has the highest rate in the UK, with 583 new cases in the seven days to November 13 – the equivalent of 848.4 per 100,000 people.
This is up from 395.8 in the seven days to November 6.
Director of operations at the Northern Devon Healthcare NHS Trust (NDHT), Heather Brazier has urged people in the area to get their jabs so that NHS services aren’t overwhelmed this winter.
She said: “Like many health and social care organisations, our staffing is impacted by Covid-related illness and isolation, and we are working hard to manage that on an ongoing basis.”
Ms Brazier added that people also needed to avoid calling 999 unless they needed urgent care.
Causeway Coast & Glens in Northern Ireland has the second highest rate in the country, up from 460.9 to 737.5, with 1,069 new cases.
The department of health in Northern Ireland warned that restrictions could be introduced before Christmas in order to combat rising infections.
Mid Sussex has the third highest rate, up from 479.8 to 714.5, with 1,087 new cases.
Gwynedd has the highest rate in Wales (684.7) and Clackmannanshire has the highest rate in Scotland (625.9).
Both Torridge and Causeway Coast & Glens are in the top five areas where infections have risen the most in the last five days.
Mid Ulster has also seen a rise in infections, jumping from 425.0 to 702.9.
Charnwood in Leicester has also seen a steep rise in infections, going from 358.8 to 635.8.
Gwynedd in Wales has also witnessed an increase, going from 442.6 to 684.7.


