CORORNAVIRUS cases are rising in 177 places in the UK and this interactive map reveals if your local area is one of them.
Deaths from Covid-19 have fallen to their lowest level in two weeks as the government has urged eligible Brits to come forward for their booster jabs.
Over the seven days to November 11, 197 areas have seen a fall in cases and the map above shows current infection rates.
Despite infections rising in close to 50 per cent of local authorities, Prime Minister Boris Johnson last night said there was nothing in the data that suggests that more restrictions would be imposed on Brits.
However he urged those eligible to come forward for their booster jabs if they wanted to avoid restrictions on daily life.
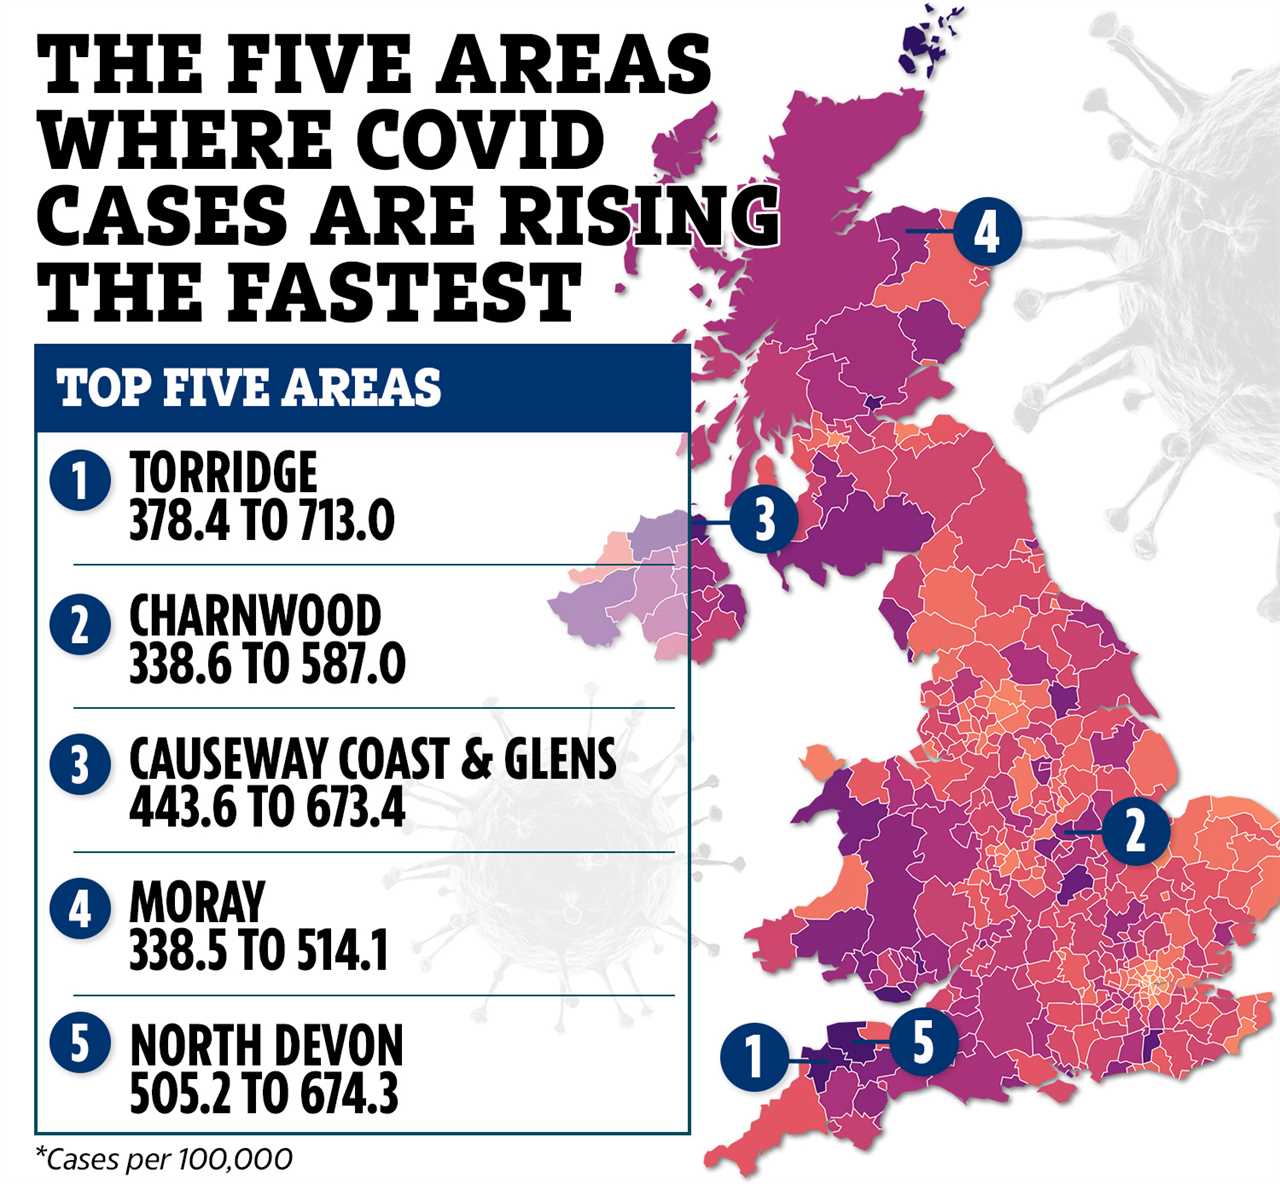
Torridge in Devon has the highest rate of infections in the UK, with 490 new cases in the seven days to November 11 – the equivalent of 713.0 per 100,000 people.
This is up from 378.4 in the seven days to November 4.
North Devon has the second highest rate, up from 505.2 to 674.3, with 662 new cases.
While cases are highest in Torridge and North Devon, the uptick in cases hasn’t yet been reflected in daily hospital admissions.
The most up to date data from North Devon Health Care Trust, which oversees both areas states that at present, 574 people are in hospital with Covid, with one patient a day being admitted.
Causeway Coast & Glens in Northern Ireland has the third highest rate, up from 443.6 to 673.4, with 976 new cases.
Orkney Islands has the highest rate in Scotland (656.3) and Vale of Glamorgan has the highest rate in Wales (640.8).
Torridge, North Devon and Causeway Coast & Glens also feature in the five areas where Covid cases have risen the fastest.
Charnwood in North Leicestershire has also seen a rise in cases, jumping from 338.6 to 587.0.
Moray in Scotland has also seen a rise, jumping from 338.5 to 514.1.


