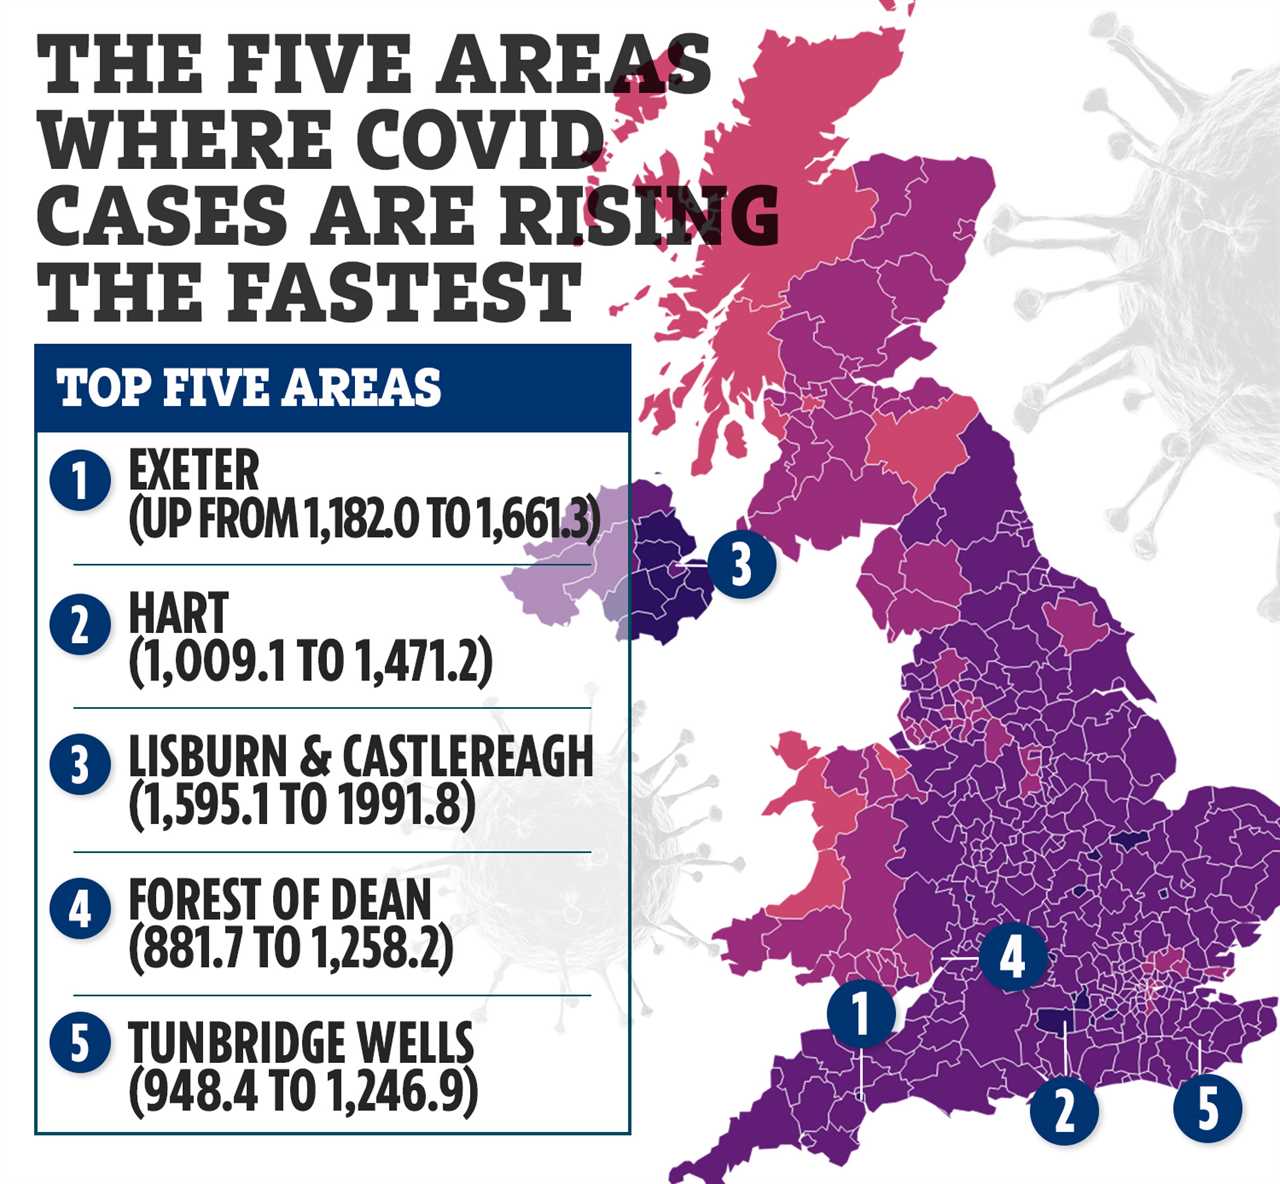
CORONAVIRUS cases are still rising in 172 places across the UK and this interactive map reveals if your area is on the list.
Overall, cases have plummeted across the UK with the majority of people catching Omicron experiencing mild, cold-like symptoms.
Various studies have shown that Omicron is milder and the rollout of booster vaccines has helped bring the UK out of lockdown.
In the seven days up to January 29, cases fell in 205 areas in the UK, and the interactive map shows current infection levels.
Latest data from the government on daily infections yesterday revealed that cases had fallen 21 per cent in a day – but that deaths had reached an 11-month high, after the metric on the dashboard had been changed.
Armagh City, Banbridge & Craigavon in Northern Ireland has the highest rate of infections in the UK, with 4,408 cases in the seven days to January 29 – the equivalent of 2,029.2 per 100,000 people.
This is up from a rate of 1,766.8 for the seven days to January 22.
Lisburn & Castlereagh in Northern Ireland has the second highest rate, up from 1,595.1 to 1,991.8, with 2,917 cases.
Ministers in Northern Ireland have continued to urge people to come forward for their booster shots after it was reported that there had been 179 outbreaks of the virus in care homes.
Health Minister Robin Swann said that vaccinations in some trusts could be pulled back, but that community vaccine sites would likely take over this role.
“GP practices have played an absolutely vital and central role, administering close to 1.4 million vaccine jabs in total, including over 530,000 booster doses”, he said.
Wokingham in Berkshire has the third highest rate, up from 1,574.1 to 1,856.9, with 3,230 cases.
The local council in Wokingham has tried to make vaccines accessible to more people by rolling out vaccine buses across the area.
Newport has the highest rate in Wales (819.4, down from 862.9) and Aberdeen City has the highest rate in Scotland (630.0, up from 588.1).


