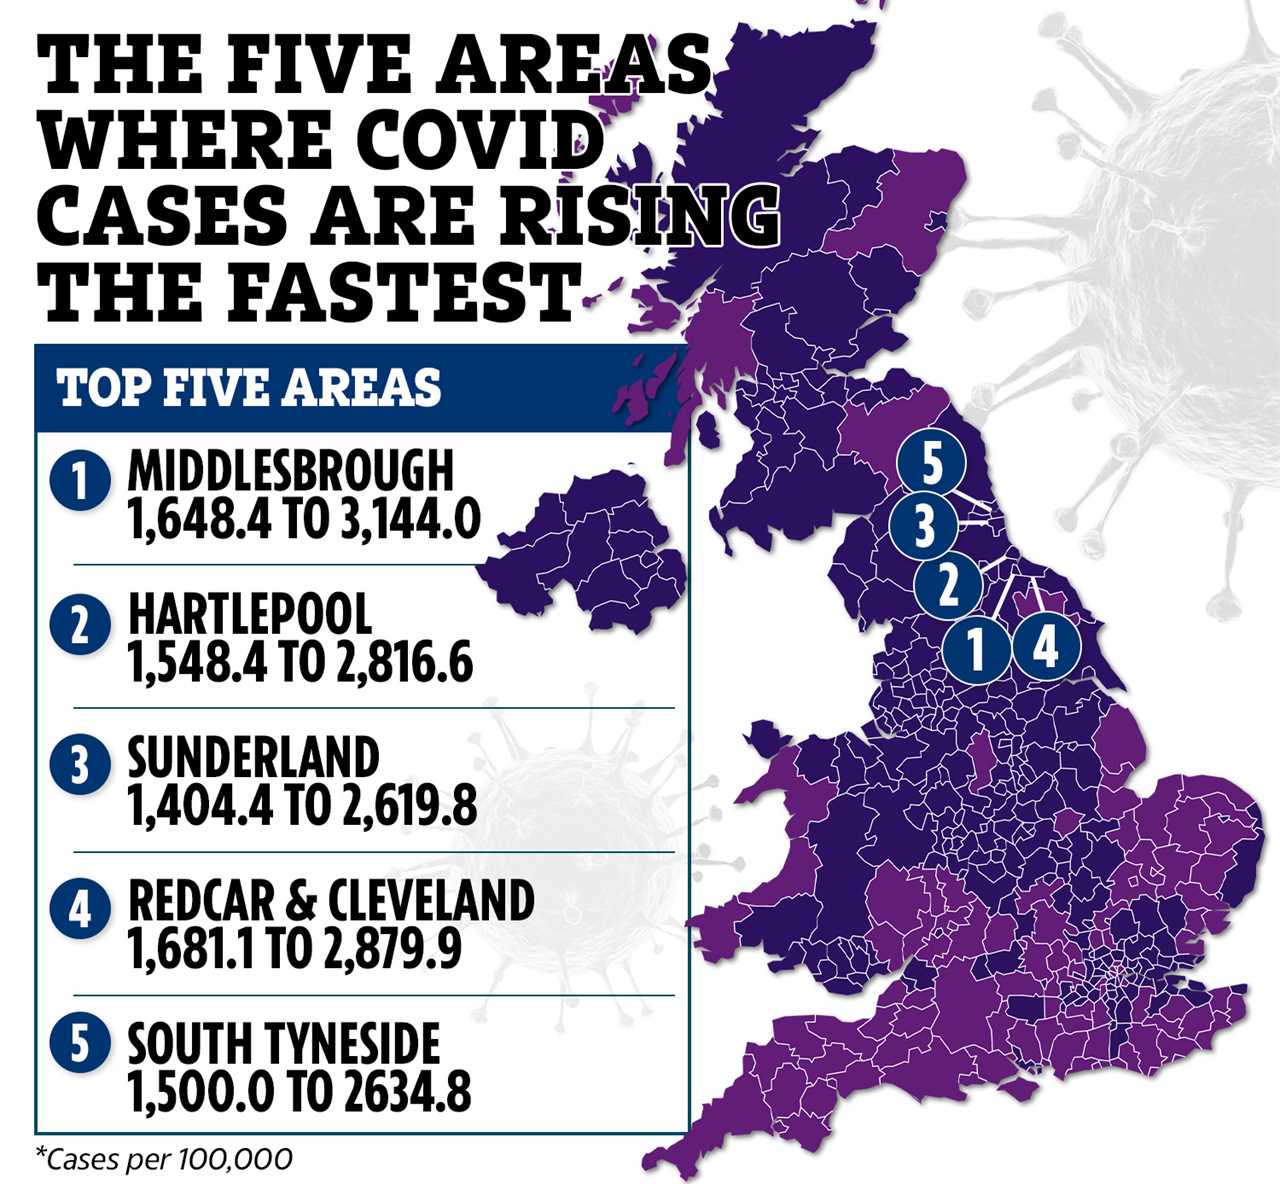
A NEW Omicron epicentre has emerged and this interactive map reveals if your local area is a hotspot for infections.
Coronavirus cases have risen in 242 areas in the last seven days and there are five areas where infections have climbed at a rapid rate.
Cases have fallen in just 134 areas in the seven days to January 7 and the map above shows current infection rates, with an epicentre of infections forming in the North East of England.
Derry City & Strabane in Northern Ireland continues to have the highest rate of Covid infections in the UK, with 6,065 new cases in the seven days to January 6, the equivalent of 4,013.7 per 100,000 people.
This is up from a rate of 3,777.4 for the seven days to December 30.
Fermanagh & Omagh in Northern Ireland has the second highest rate, up from 2,922.4 to 3,309.3, with 3,883 new cases.
Figures for Northern Ireland as a whole show that six additional deaths were recorded yesterday, with a further 2,706 cases.
Some year groups in Northern Irish schools have this week returned to remote learning due to issues caused by Omicron such as further infections and staff shortages.
Middlesbrough has the third highest rate, up from 1,648.4 to 3,144.0, with 4,442 new cases.
Middlesbrough, in the North East is also the area where cases have risen the fastest in the last seven days.
All five areas where cases have seen a rapid increase are in the North East of England.
Just a 28 minute drive away, and the second area which has seen the biggest rise in cases is Hartlepool, where infections have climbed from 1,548.4 to 2,816.6.
Sunderland jumped from 1,404.4 to 2,619.8, Redcar & Cleveland from 1,681.1 to 2,879.9 and South Tyneside also witnessed a jump from 1,500.0 to 2634.8.
The jump in the North East was also reflected in the R rate data which was published on Friday.
Before the Christmas period, London had the highest R rate, but as data shows that the capital could have passed the peak of infections, the North East and Yorkshire recorded the highest R rate, between 1.3 to 1.6.
It was followed by the North West, which sits between 1.3 to 1.5.
The Midlands is at 1.2 to 1.5 and the East of England sits between 1.1 and 1.3.
Both the South East and the South West recorded an R rate between 1.0 to 1.3.
London currently has the lowest R rate in England, and sits between 0.9 to 1.2.
It’s important to note that the R rate changes over time and if R is greater than 1, then it means the epidemic is growing.


