BRITAIN has faced months of restrictions and frightening predictions as coronavirus grips the country.
But as Heath Secretary Matt Hancock insists the second wave is levelling off, analysis shows the grimmest forecasts that plunged us into a second lockdown haven’t materialised.
Do 95% of Covid deaths have underlying conditions?
Yes. Those who have died in England from the virus have largely had pre-existing conditions.
Out of the 37,796 deaths in NHS England hospitals up to November 20, 35,806 had underlying conditions.
There have reportedly been only 42 deaths of people under the age of 40 who didn’t have underlying health problems.
And more than half of those who died in England were over the age of 80.
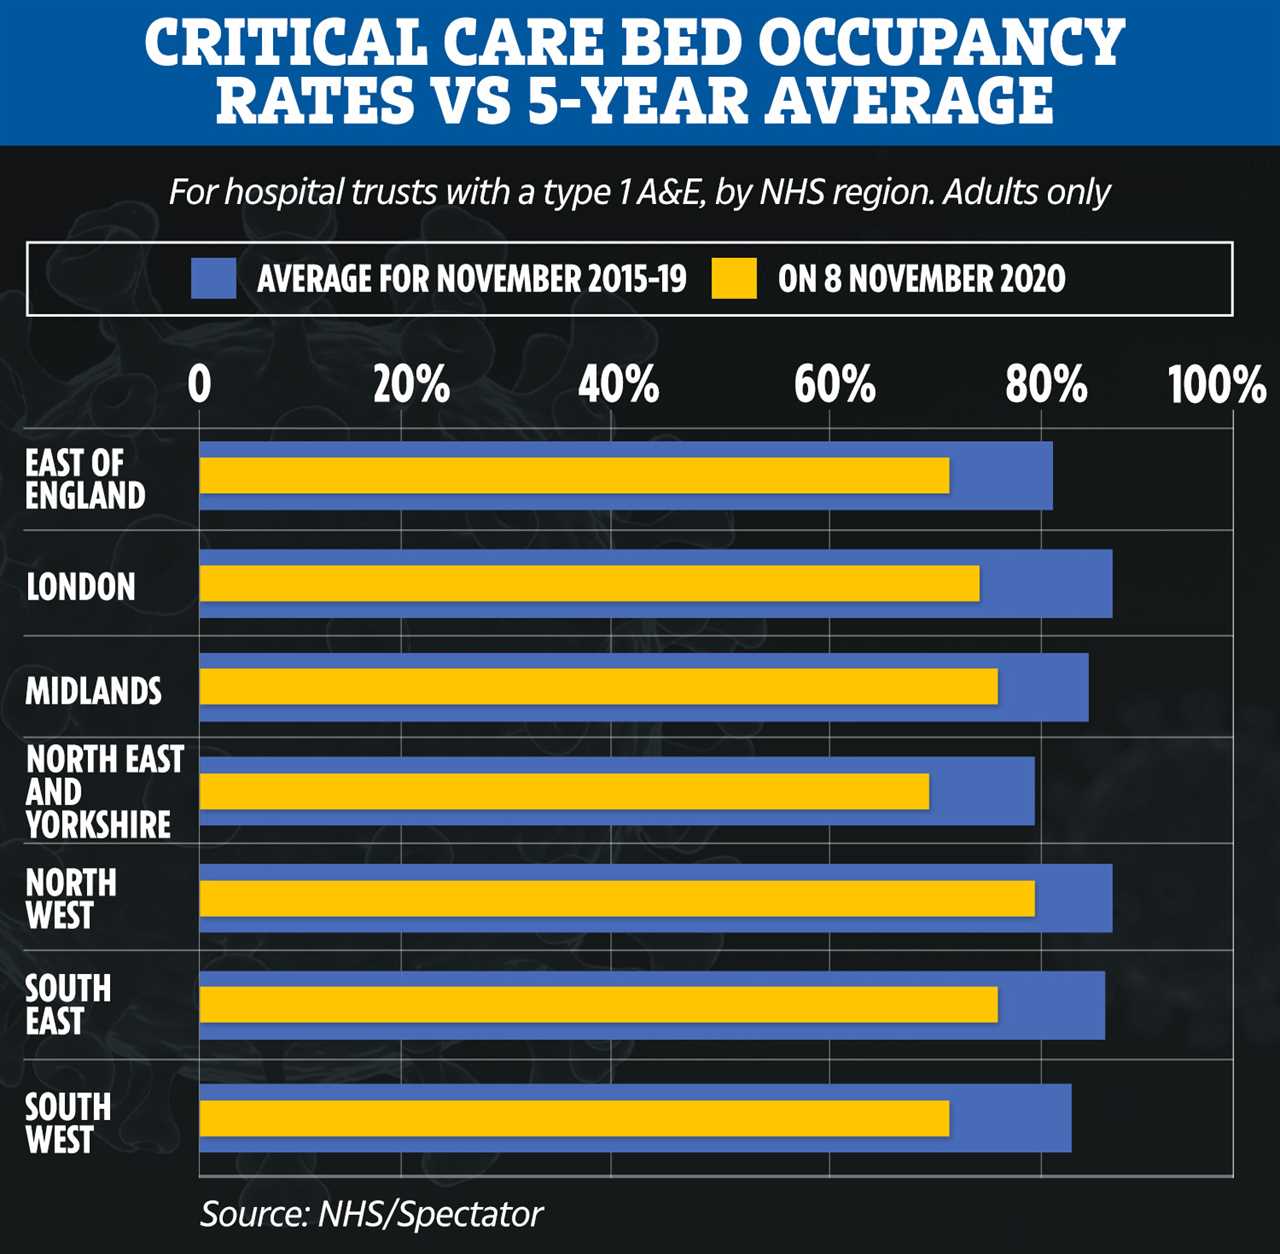
How do critical hospital admissions or beds compare with the last five years?
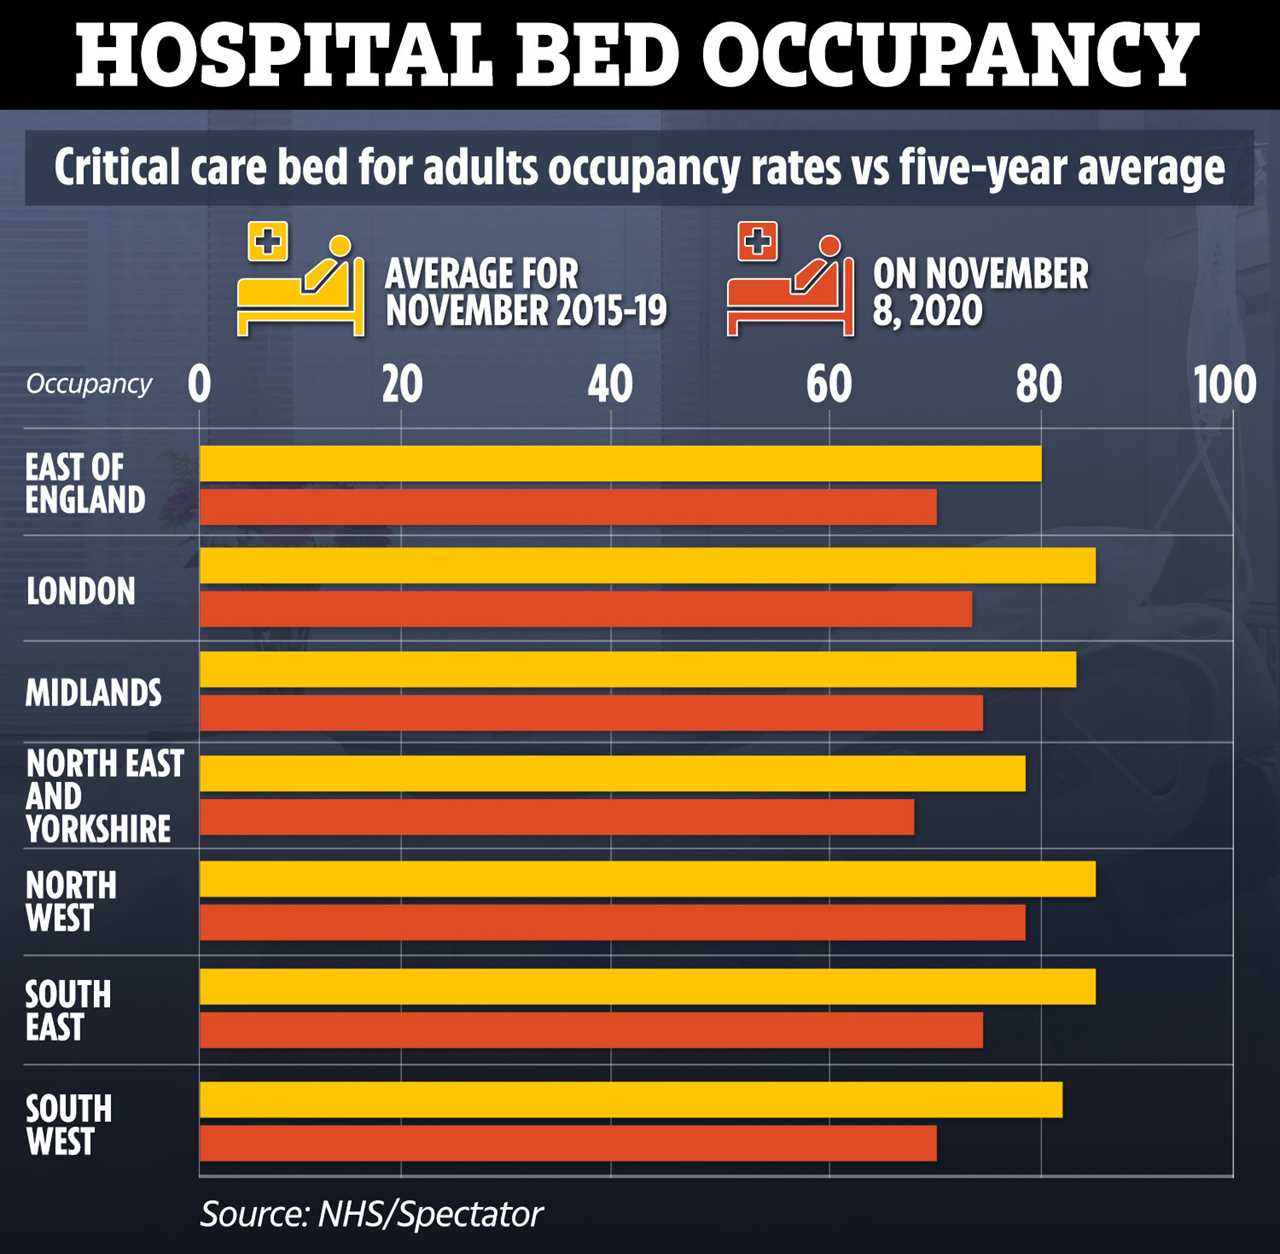
ICU bed occupancy for the beginning of this month was actually lower than the five-year average for November.
Data from November 5 – the most recent date on record – showed the number of beds occupied in England were 113,474, and 114,767 on the same day last year.
This will be largely due to procedures and planned appointments being cancelled or delayed, which would have taken place if the pandemic hadn’t hit.
It will also be due to people still staying away from hospitals and not being able to be referred as quickly.
Are hospitals close to full capacity?
No, hospitals are not close to full capacity.
Many hospitals and medics are under pressure from another influx of coronavirus patients, but this is not the case in all UK hospitals.
Only 13 per cent of beds in NHS hospitals are filled with Covid-19 patients.
Data from the Department of Health said 14,479 people were in hospital on November 17, a drop from the previous day which had 16,271 Covid inpatients.
Covid-19 patients account for around 10 per cent of general and acute beds in hospitals. But, there are still more than 13,000 beds available.
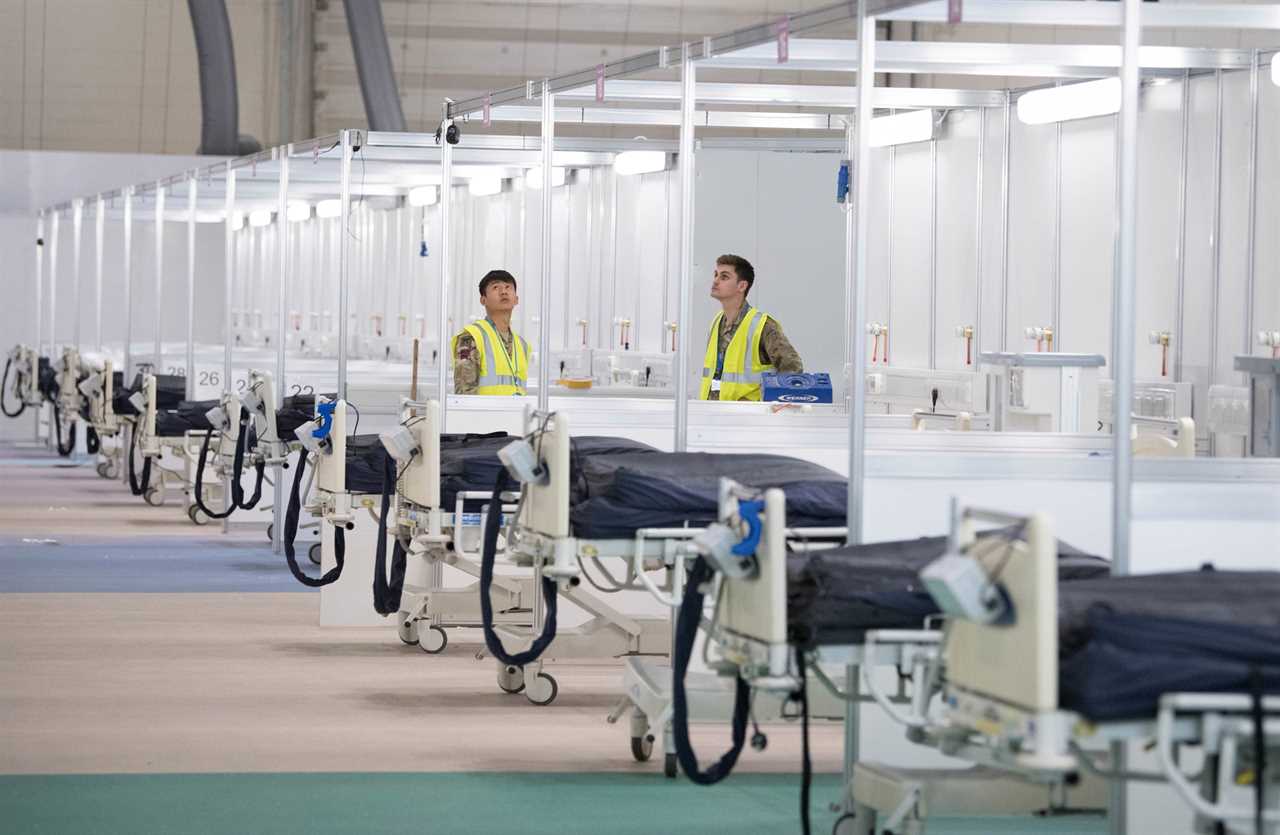
And we still have the Nightingale hospitals around the country allowing for more capacity should the NHS struggle for beds once more.
Are intensive care beds are full?
No, while under pressure due to Covid, ICUs are still able to admit other patients.
Capacity is tracking as normal with the number of beds available that would be expected at this time of year.
Data shows that even in the peak in April, critical care beds were on average never more than 80 per cent full.
Are more dying now than last year?
Compared to the five-year average of deaths, the current numbers show we are relatively in line with that.
Deaths per week earlier this year spiked as the virus took hold and we saw a huge difference compared to the average.
But now it is roughly the same, with deaths running up to November 10 recorded at 10,887, and the five-year average for the same period at 10,861.
Are more dying now than in the first wave?
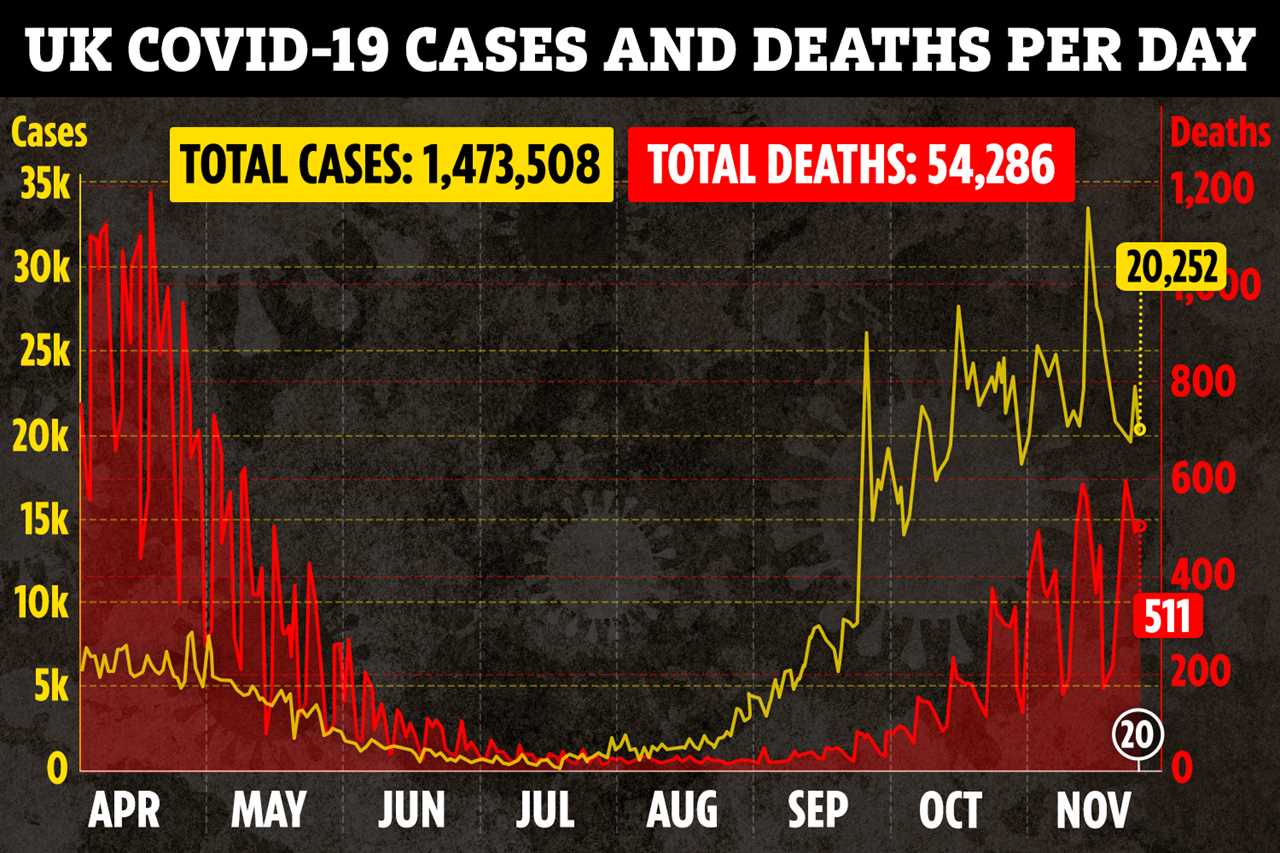
No, we are actually seeing less deaths than the peak in April.
Doctors have more knowledge and experience of the disease and can therefore manage and treat it better.
In April the daily average of deaths was 838 at one point, as deaths in care homes rocketed.
In comparison we are seeing around 500 new deaths daily at the moment.
Are more elderly dying than normal?
Elderly people are more at risk from the virus and have largely been the victims, but aren’t dying more than normal.
Data up to November 18 showed that 53.7 per cent of people who died from Covid in England were over 80 years old.
Deaths of elderly people would be starting to spike in normal years as we approach winter and flu season.
But with more people staying inside and practising social distancing, we could see flu infections not as high as usual.
Is the infection rate rising?
No. The infection rate in the UK is falling.
After months of tier restrictions and now the second lockdown, the country is seeing falling infection rates.
The coronavirus R rate has fallen for the second week in a row- with only the South East above 1, the latest official data shows.
The current R value – the number of people an infected person will pass Covid-19 on to – is estimated to be between 1.0 and 1.1.
The worst case forecast deaths vs actual current daily death toll:
Death graphs used to justify a second Covid lockdown in England were branded “misleading” by experts who said they are “mathematically incorrect”.
Heat maps presented to the general public ahead of a second lockdown made for scary viewing as the colour coded charts showed the pandemic was out of control.
They predicted a worst case scenario of more than 4,000 deaths a day by December.
But, one of the scientists who worked on that study, said the data was presented incorrectly.
Professor Danlela de Angelis said the curve was made to look like a prediction, when in fact it was a model that was a month old and did not take into consideration the tier restrictions that had previously been introduced.
The Cambridge model has since revised its estimates which are around 1,000 deaths by the start of December.
Did you miss our previous article...
https://trendinginthenews.com/covid-19/seven-die-after-drinking-hand-sanitiser-when-they-ran-out-of-booze-at-party-in-russia


