CORONAVIRUS infections are still rising in 327 areas and this interactive map reveals if your local authority is one of them.
It comes as the UK witnessed its higher number of new daily cases in three months yesterday – with 49,156 infections recorded.
Just 13 per cent of places have witnessed a fall in cases in the seven days to October 14.
Last week 234 areas had seen a rise in cases and Trafford in Greater Manchester had the highest infection rate in the country.
Ipswich in Suffolk has now taken over and is the most infected part of the country recording 1,162 new cases in the seven days to October 14 – the equivalent of 854.5 per 100,000 people.
This is up from 681.0 in the seven days to October 7.
Public Health Suffolk has said it is taking the rise in cases ‘seriously’ and has urged people to be vigilant.
Deputy director of public health in the area, Martin Seymour said that while there are no restrictions in place people should continue to take precautions to stop the spread of the virus.
He added that people should continue to wash their hands and wear masks in crowded places.
Wellingborough in Northamptonshire has the second highest rate in the country, up from 738.0 to 817.9, with 655 new cases.
Torfaen in Wales has the third highest rate, up from 687.5 to 814.1, with 772 new cases.
Armagh City, Banbridge & Craigavon has the highest rate in Northern Ireland (561.2) and Stirling has the highest rate in Scotland (493.2).
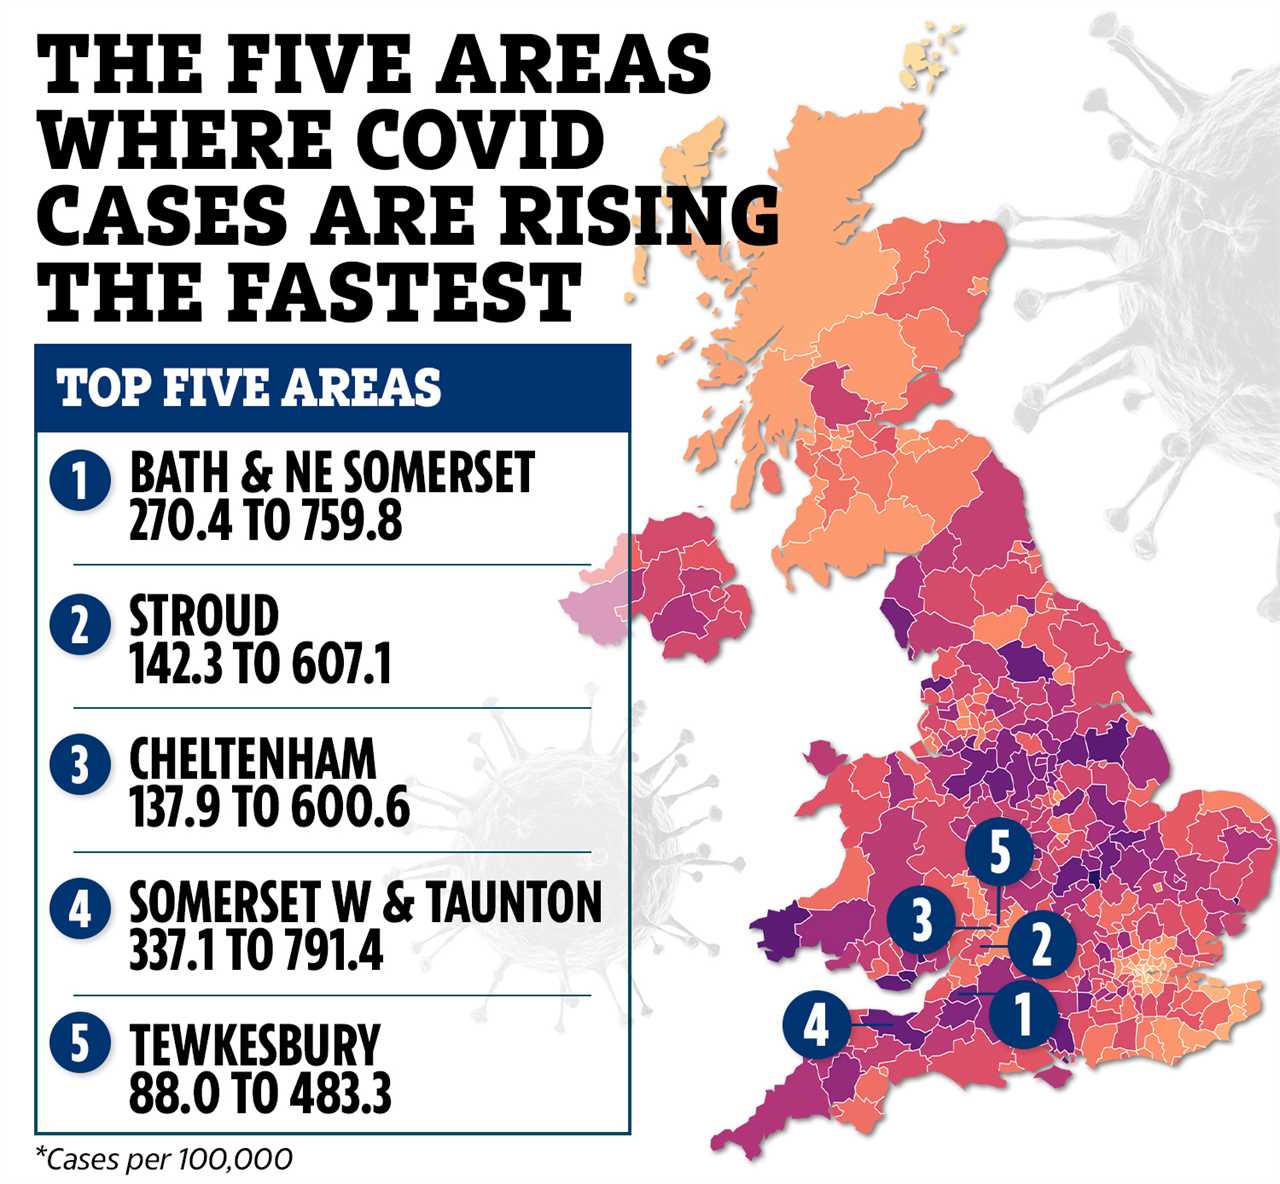
While these areas have the highest case rates across the three nations, there are five areas that have seen a big jump in the last seven days.
Bath & North East Somerset has seen the biggest jump, going from 270.4 cases per 100,000 to 759.8.


