DEATHS caused by the coronavirus are slowing for the first time since the second wave hit in September, official figures show.
Data from the Office for National Statistics (ONS) revealed that while deaths are at the highest since May 15, the figure is an increase of just nine per cent on deaths in early November.
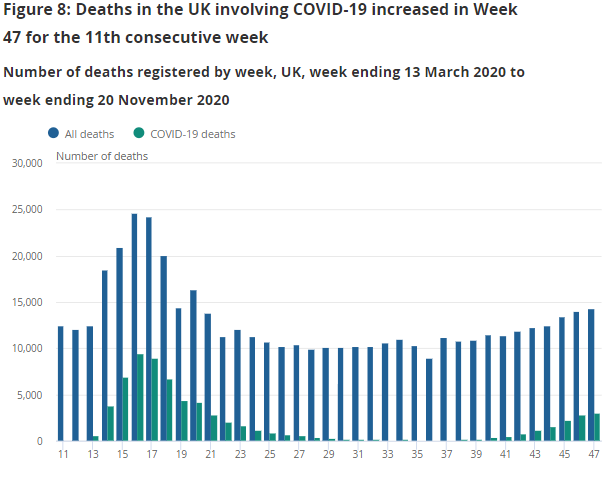
The ONS states that there were a total of 2,697 deaths in the week ending November 20 which mentioned Covid-19 on the death certificate.
This is up just nine per cent from the week ending November 13 and is the lowest since the start of the second wave.
Figures from the ONS show that the increase in deaths started to slow in late October.
The first tier system was introduced on October 14 and lasted until November 5.
A second national lockdown was then introduced to further curb the spread of the virus – but experts have previously claimed that the tier system had been working.
In the week ending October 16 deaths jumped by 53 per cent and then by 46 per cent the following week.
This was followed by jumps of 41 per cent, 40 per cent, 27 per cent and a nine per cent jump reported today.
Covid-19 still accounted for just over a fifth of all deaths registered in England and Wales in the week to November 20.
Regional rates
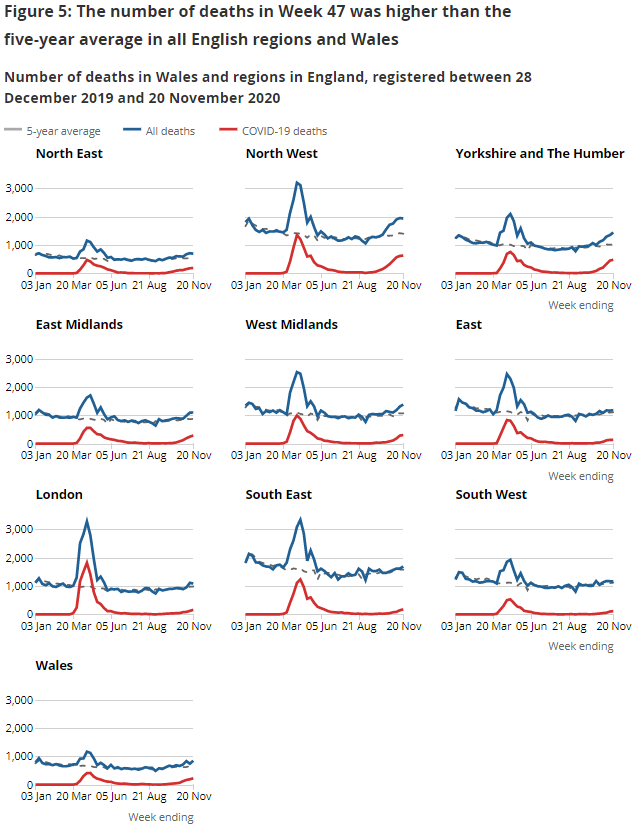
Despite recent Public Health England figures stating that cases of the virus have decreased in recent days the ONS data shows every region of England except one – Eastern England – recorded an increase in deaths involving Covid-19 in the latest figures.
North-west England had 629 deaths involving Covid-19 registered in the week ending November 20 – the highest number for the region since the seven days to May 1.
In Yorkshire and the Humber, 481 Covid-19 deaths were registered: again, the highest for the region since the week to May 1.
Some 306 Covid-19 deaths were registered in the West Midlands, while 289 were registered in the East Midlands – in both cases the highest since the week to May 15.
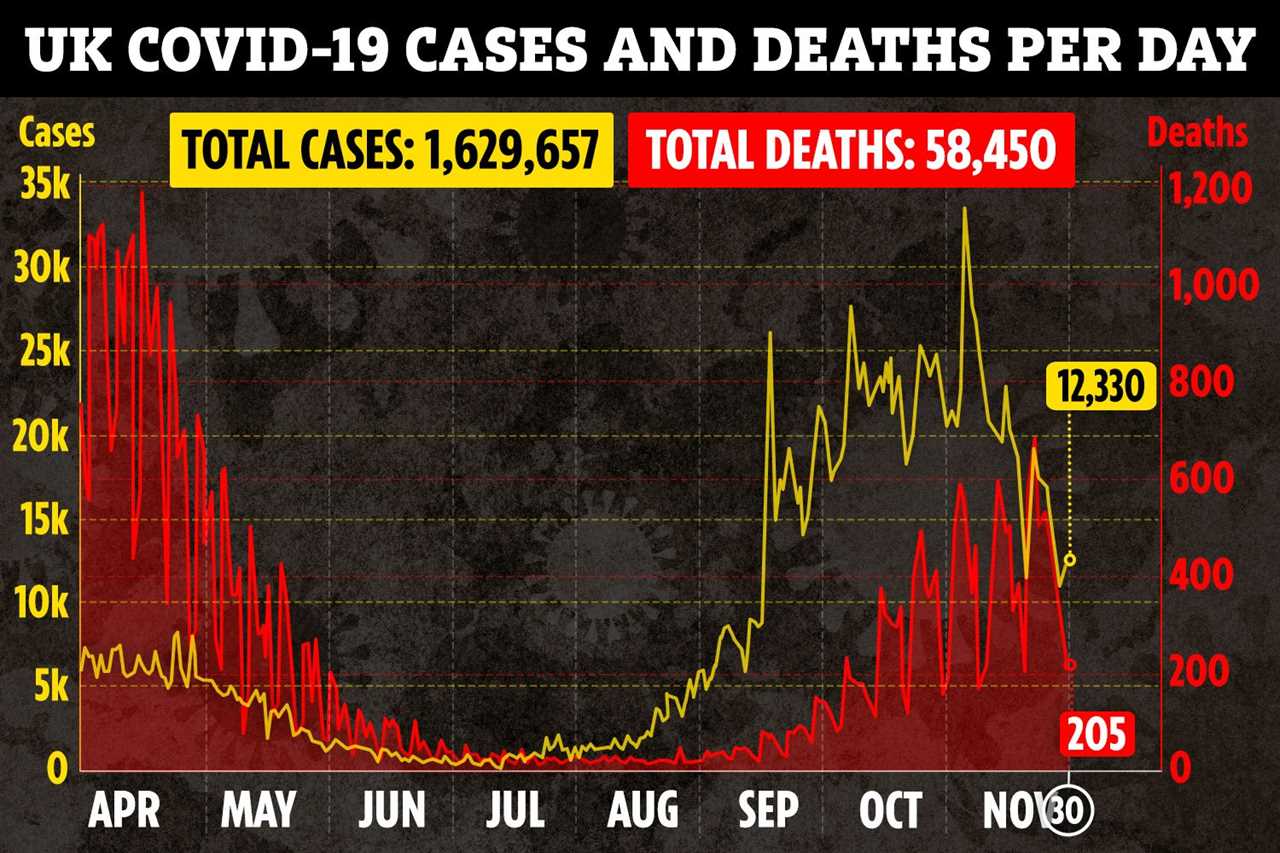
Data from PHE yesterday revealed that cases of the virus had risen in just 17 places across England.
But just five of those 17 areas will be forced into tough Tier 3 restrictions when the country exits the second national lockdown on December 2.
Medway currently has 447.7 cases per 100,000 people and will be placed in Tier 3 alongside Dover, Maidstone, Folkestone & Hythe and Ashford.
Of the 315 local authority areas in England, 298 have seen a drop in cases, data from Public Health England (PHE) states.
The rates are for the week ending November 25 and show that the second national lockdown has been successful in reducing the amount of community infections across most places in England.
The data from the ONS is from the week before and the slow in death rates shows that the pandemic is flattening.
‘COLLATERAL DAMAGE’
Experts however today claimed that the pandemic is still causing “collateral damage”.
Prof Sir David Spiegelhalter, Chair, Winton Centre for Risk and Evidence Communication, University of Cambridge said there was a 21 per cent increase in excess deaths over the five year average.
“And it is also substantially larger than the peak for this week over the last 10 years, which was 10,882 in 2019. This is far greater than could be explained by an ageing population.
“2,697 deaths had Covid on the death certificate, and it is important to note that these are not just deaths ‘with’ Covid. 88 per cent of the Covid deaths, that is 2,361 people, were deaths ‘from’ Covid as the main underlying cause, only 12 per cent were ‘with’ Covid as a secondary cause.”
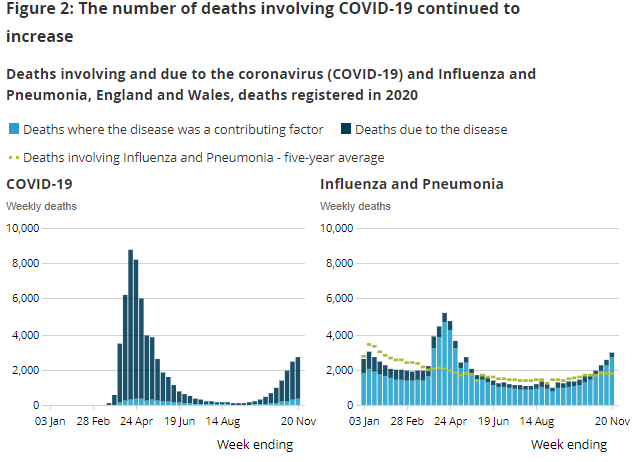
He added that Covid is “currently causing eight times the amount of deaths of flu and pneumonia”.
“It is encouraging that deaths that were not caused by Covid were slightly below the five-year average.
“We might expect some deaths that would normally occur now to have been brought forward by the first wave, but this still suggests that the collateral damage of the measures against the pandemic have not yet had an impact on overall mortality.”
He said the prediction that the second wave would involve tens of thousands of deaths could be fulfilled and added that this could rise to over 20,000 by Christmas.
AGE MATTERS
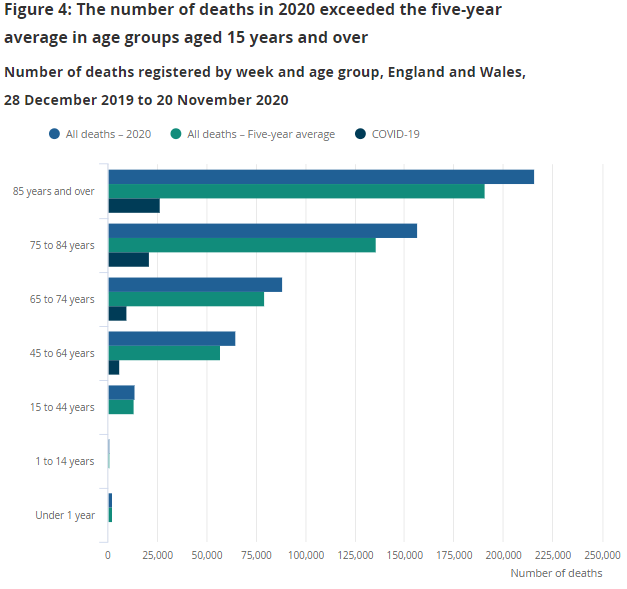
The ONS data states that Covid-related deaths remained the same across all age groups in data up to the week ending November 20.
It stated that the biggest increase was seen in those aged 90 and over.
The figures also revealed that three-quarters of deaths involving Covid had been in people aged 75 and over.
The report stated: “Across Weeks 1 to 47 of 2020, 55.4 per cent of all deaths involving COVID-19 were in males.
“There were more deaths in females aged 85 years and over (14,301) than males aged 85 years and over (12,288).”
The data does not account for the population split – where there are more women aged over 85 than men.
“Looking at excess deaths by age group, the number of deaths up to 20 November 2020 was above the five-year average for all age groups above 14 years.
“While the number of deaths for age groups under 44 years was below the five-year average”, the report added.