CASES of the coronavirus are back at levels seen before the second wave, app data has revealed.
Rates in older people have continued to fall and the R rate is currently at 0.8, as the country continues to push infection rates down.
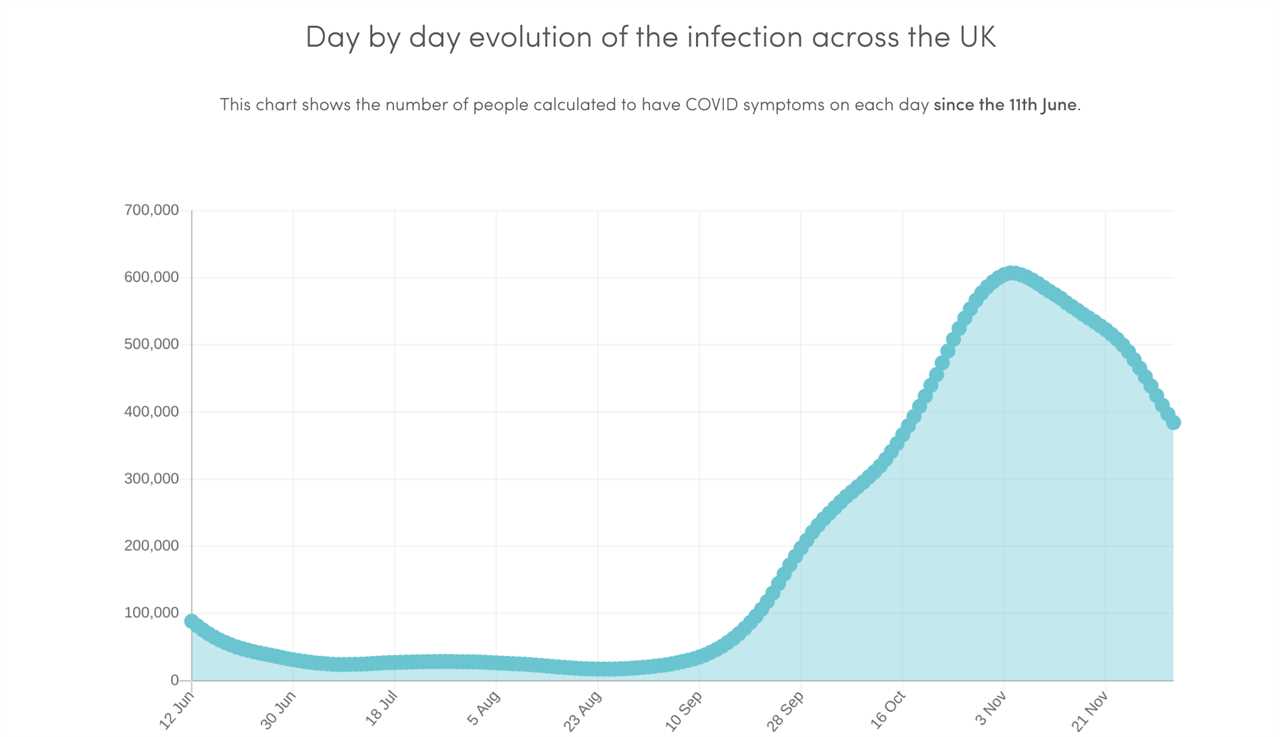
Data from the ZOE Symptom Tracker App shows that 384,408 people have symptomatic Covid-19 in the UK.
Prof Tim Spector, who leads the research tweeted: “New Cases on ZOE CSS app continue to fall across England back to late September levels in line with hospital admissions.
“Rates in older people also falling. R value still 0.8 but not so good for Wales and Scotland.”
Further data from the Zoe app shows that there are 20,496 new cases of the virus every day.
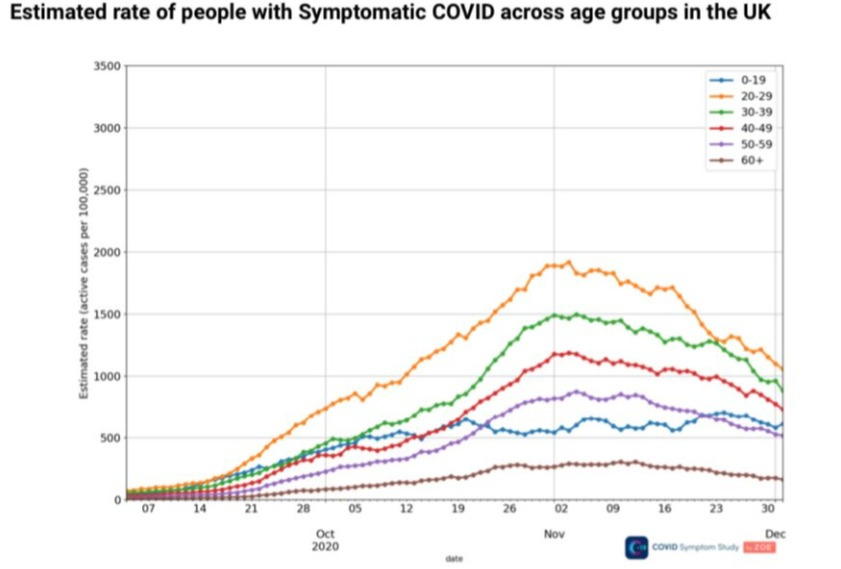
It comes after data from Public Health England (PHE) revealed that Covid-19 case rates in England are continuing to fall in all age groups, according to the latest weekly surveillance report.
The highest rate is among 40 to 49 year-olds, which stood at 190.3 cases per 100,000 people in the week to November 29, but this is down from 249.8 in the previous week.
For 70 to 79 year-olds the rate fell from 112.8 to 78.6, while for people aged 80 and over the rate dropped from 220.7 to 182.0.
Test & Trace data released today also stated that cases have fallen by 28 per cent in England.
Between November 19th and the 25th, 110,620 people tested positive for coronavirus, more than a quarter down on the previous week.
And in a further boost, the number of people being successfully contacted by the Test and Trace system increased too, rising to 72.5 per cent during the week in question after weeks of nearly record lows of around 60 per cent.
The figures give fresh hope that Britain may have turned a corner in its fight against the virus, with the first vaccines to be rolled out next week.
R WE THERE YET?
The R value, predicted by the app is currently at 0.8 and this is down from its prediction on 0.9 last week.
This is not the same as the R rate calculated by Sage which currently sits at 0.9-1.
The government is set to update the country on the R rate on Friday and it is hoped that rate may have fallen due to the second national lockdown.
However experts have previously stated that there is a lag on this data so the full effects on the November lockdown may not been seen for another week.
R0, or R nought, refers to the average number of people that one infected person can expect to pass the coronavirus on to.
The app states that at the end of September there were 221,059 cases, it states that today there is 384,408 cases.
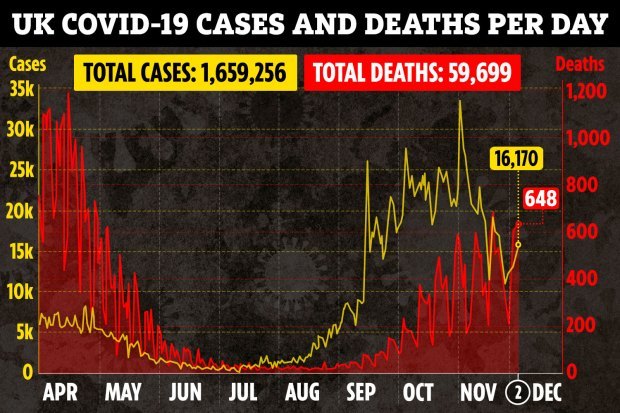
Data from the government’s coronavirus dashboard suggests that over the last seven days there have been 103,533 positive test results and that the daily amount of people testing positive is over 16,000 cases a day.
It also shows that hospital cases of the virus are starting to fall and this is inline will a drop in infections and a slowing in death rates.
Data released by the Office for National Statistics (ONS) this week showed that deaths are also starting to fall.
While deaths are at the highest since May 15, the figure is an increase of just nine per cent on deaths in early November.
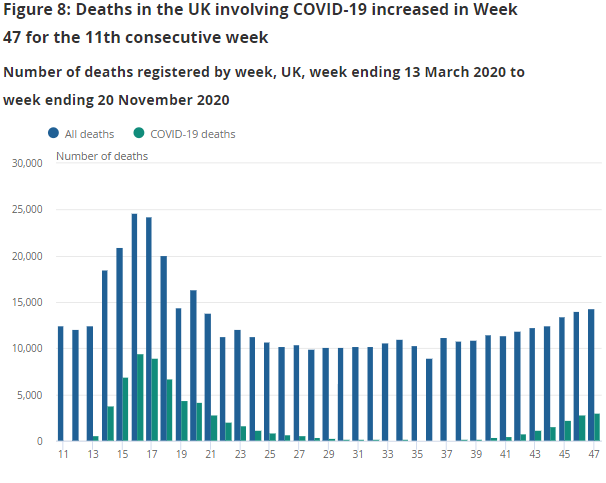
The ONS states that there were a total of 2,697 deaths in the week ending November 20 which mentioned Covid-19 on the death certificate.
This is up just nine per cent from the week ending November 13 and is the lowest since the start of the second wave.
Figures from the ONS show that the increase in deaths started to slow in late October.
The first tier system was introduced on October 14 and lasted until November 5.
A second national lockdown was then introduced to further curb the spread of the virus – but experts have previously claimed that the tier system had been working.
In the week ending October 16 deaths jumped by 53 per cent and then by 46 per cent the following week.
This was followed by jumps of 41 per cent, 40 per cent, 27 per cent and a nine per cent jump reported today.
Covid-19 still accounted for just over a fifth of all deaths registered in England and Wales in the week to November 20.